Introduction
Lysine (Lys) is the second limiting amino acid (AA) in practical corn-soybean meal diets. Growth performance and proper muscle development of broiler chickens is highly dependent of an adequate dietary supply of Lys. Although all AA coded in the nucleic acid sequence are required for muscle protein synthesis, also depending on its frequency and dietary supply, Lys is the main essential AA required for muscle building for broilers [1]. Lysine has also gained importance in the expression of essential AA requirements as its ratio, which is the basis of the popularly known ideal protein concept [2]. Estimation of accurate Lys requirements can greatly affect broiler performance and meat yields because minor deviations lead to the inadequate inclusions of all other indispensable AA [3].
Nutrient recommendations for broilers intend to optimize growth performance as well as the proportions of individual carcass components, especially breast meat, to a point that best economic returns are obtained. It has been reported that Lys can increase carcass yields and alter its composition by increasing meat yield and reducing carcass fat [1,4]. This trend has been exacerbated in the last years since breast muscles, and therefore, meat yields, have been steadily grown as a proportion of the other body components of broiler chickens.
Dietary Lys also plays an important role in breast muscle protein turnover by modulating protein synthesis and breakdown rates [5]. Furthermore, Lys deficiency results in reduced protein mass, especially in the Pectoralis major, which is more sensitive to Lys than wings and thigh muscles [6]. The breast muscles are particularly sensitive to dietary concentration of Lys since it represents approximately 7% of the total body protein content [7]. In contrast to leg muscles, breast muscles are a direct product of genetic selection, have minor functional purpose, and represent a considerable protein storage during periods of nutrient deficiency [6].
Usual determinations of AA requirements target the optimization of growth performance, feed conversion ratio (FCR), and breast meat yields; however, AA concentrations that optimize breast meat yields have shown to be higher than for the other responses [8,9,10]. Improvements in broiler growth performance could indicate a greater AA requirement than determined with previous researches. The last edition of the NRC (1994) [11] is obviously outdated now, but just as a matter of comparison, it suggests 1.10% total Lys from 0 to 21 d and 1.00% total Lys from 21 to 42 d. Recent research [12–14] has demonstrated that the Lys requirements of modern broilers are higher than those previously recommended, although many factors such as strain, sex, age, type of diet, levels of other nutrients, environment, response criteria, and statistical model are capable of influencing the requirements obtained from different studies [3].
Diverse regression methods have been used to estimate Lys requirements for broilers. Pesti et al. (2009) [15] tested different statistical models using the same data set and observed that Lys requirement estimates ranged from 0.90% to 1.28% depending on the model used (quadratic broken-line, quadratic polynomial, linear broken-line, and exponential asymptotic). Other authors recently presented digestible Lys (dig. Lys) requirements from 1 to 14 d using the quadratic broken-line model (QBL) as 1.180% for body weight gain (BWG) and 1.261% for FCR [14], 1.07% for BWG and 1.10% for FCR, respectively, using quadratic polynomial (QP) regression, and as 1.09% for BWG and 1.15% for FCR, respectively, based on QBL model [16] from 14 to 28 d. An older study [12], determined requirements for BWG as 1.13% total Lys from 14 to 28 d and 0.94% for BWG and 0.95% for FCR from 28 to 42 d using linear broken-line (LBL) model.
An adequate statistical model is essential to correctly interpret the requirements [12,14,17– 19]. Multiple-range tests are not suitable to estimate requirements because their outcome is between two tested concentrations of the AA, hence no precise requirement prediction is possible [15,20]. There are many models that relate performance variables with feed composition, such as QP, LBL, QBL, and exponential asymptotic (EA), which have been thoroughly reviewed by Pesti et al. (2009) [15] and were used in the present study. The objective of the present research was to estimate the dig. Lys requirements of Cobb x Cobb 500 male broilers from 1 to 12 d, 12 to 28 d, and 28 to 42 d-of-age using different statistical regression models such that further comparisons regarding this nutrient can be performed.
Materials and methods
All procedures utilized in the present study were approved by the Ethics and Research Committee of the Federal University of Rio Grande do Sul, Porto Alegre, Brazil. The Ethics Committee approved this study (approval number 216/2015).
Bird husbandry
Three experiments (Exp.) were conducted using 1,200 one-d-old male, slow-feathering Cobb 500 x Cobb broilers. Chicks were vaccinated for Marek’s and infectious bursal diseases at the hatchery (BRF, Lajeado, Brazil) and then randomly distributed into 48 pens of 1.65 × 1.65 m (9.2 birds/m2, 25 birds per pen). Experimental pens had rice hulls as bedding, one 15 kg capacity tube feeder, and 3 nipple drinkers. Mash feeds and water were available for ad libitum consumption. Mortality was recorded daily. Initial temperature was set to 32°C being reduced to maintain bird comfort throughout the studies. A continuous lighting schedule was used until 7 d-of-age, whereas a 20L:4D cycle with constant intensity was used thereafter.
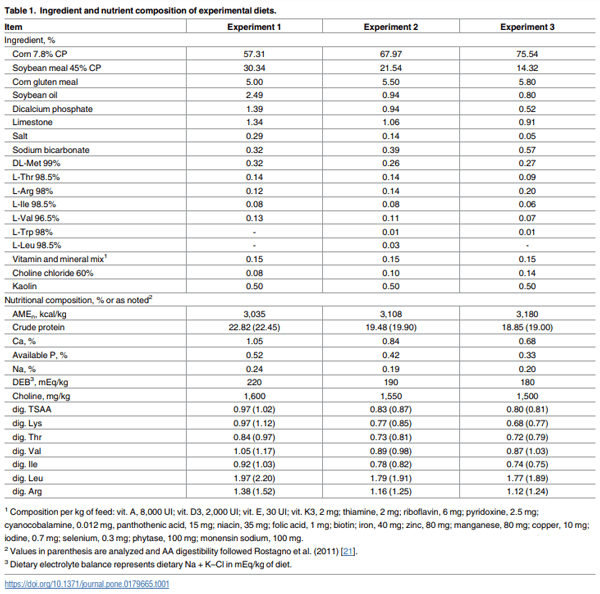
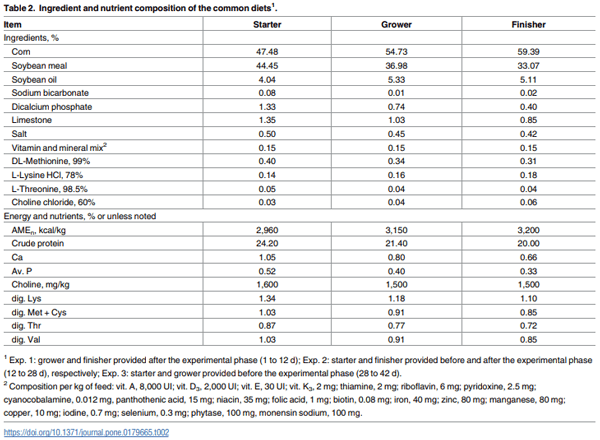
Experiments 1, 2, and 3 were designed to estimate Lys requirement from 1 to 12 d, 12 to 28 d, and 28 to 42 d-of-age, respectively. In Exp. 1, birds were fed the experimental diets from placement to 12 d whereas in Exp. 2 and 3, birds received common standard commercial diets based on corn and soybean meal until the start of the experimental period (Table 1). The standard common diets from 1 to 12, 12 to 28, and 28 to 42 d had 24.2, 21.4, and 20.0% CP; 1.05, 0.80, and 0.66% Ca, and 0.52, 0.40, and 0.33% Av. P, respectively (Table 2). Birds and feeds were weighed on d 1 and 12 in Exp. 1, d 12 and 28 in Exp. 2, and d 28 and 42 in Exp. 3 when BWG, feed intake (FI), and FCR corrected for the weight of dead birds were calculated.
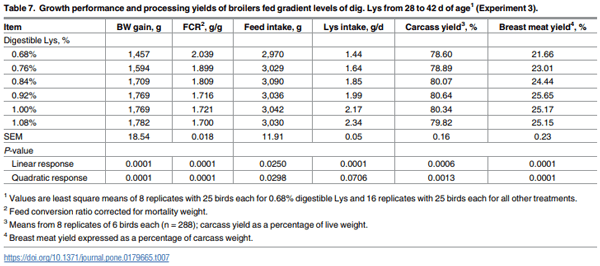
In the Exp. 3, six birds per pen (n = 288) were selected within the upper and lower 5% of each pen average at 43 d of age for processing to carcass and breast yields evaluation. Birds were fasted for 6 h, individually weighed before electrical stunning (45 V for 3 s), bled for 3 min after carotid and jugular veins cut, scalded at 60°C for 45 s, and mechanically defeathered. Carcasses were manually eviscerated and then statically chilled in slush ice for 3 h before processing. Breast fillets were manually deboned from the carcasses. Carcass yield was expressed as a percentage of live weight and breast yield was expressed as a percentage of the eviscerated carcass weight.
Experimental diets
Dietary treatments in Exp. 1 were provided from 1 to 12 d-of-age, in Exp. 2 from 12 to 28 d-ofage and in Exp. 3 from 28 to 42 d-of-age. Diets in the experiments were based on corn, soybean meal, and corn gluten meal [21]. Basal diets were formulated without supplemental L-Lysine (L-Lys) (0.97% dig. Lys in Exp. 1, 0.77% dig. Lys in Exp. 2 and 0.68% of dig. Lys in Exp. 3, respectively), and contained all other essential AA that meet or exceed commercial recommendations to ensure dietary adequacy such that responses were only limited by dig. Lys.
Treatments were structured with the addition of increasing levels of dig. Lys in 0.08% increments from 0.97% to 1.37% in Exp. 1, from 0.77 to 1.17% in Exp. 2, and from 0.68 to 1.07% in Exp. 3 by adding L-Lysine HCl at the expense of an inert filler (kaolin). Standard corn-SBMbased broiler diets were provided to all treatments in the periods after (grower diet grower from 12 to 28 d-of-age; finisher from 28 to 42 d-of-age) the experimental phase of Exp. 1, before (starter diet from 1 to 12 d-of-age) and after (finisher diet from 28 to 35 d-of-age) experimental phases of Exp. 2, and before (starter diet from 1 to 12 d-of-age; grower from 12 to 28 d-of-age) the experimental phase of Exp. 3 (Table 2). Before diets formulation, near infrared reflectance spectroscopy was used to analyze the ingredients for crude protein (CP) and AA contents [22,23] and analyzed values were used to determine diet formulation applying digestibility coefficients [24] to analyzed total AA content. Diets were manufactured in mash form and representative samples of each complete feed were obtained to validate Lys concentrations.
Statistical analysis
The experiments had a gradient treatment structure in a completely randomized design. Treatments had 8 replications in every experiment. Four mathematical models were used to estimate the optimal level of dig. Lys inclusion to maximize broiler responses based on a gradient treatment structure [15,25–27]. Body weight gain, FCR, and carcass traits were selected as broiler responses. Linear broken-line, QBL, and EA models were estimated using a nonlinear procedure, whereas the QP regression model was estimated using a regression procedure [28]. Models were summarized as follows: the QP regression model was expressed as Y = β0 + β1 × X + β2 × X2, where Y is the dependent variable, X is the dietary Lys concentration, and β0 is the intercept, β1 and β2 are the linear and quadratic coefficients, respectively; maximum response concentration was obtained by:—β1 ÷ (2 × β2). The LBL model was expressed as Y = β0 + β1 × (β2—X), where (β2—X) = 0 for X > β2, Y is the dependent variable, X is the dietary Lys concentration, β0 is the value at the plateau, β1 is the slope and β2 is the Lys concentration at the break point. Quadratic broken-line model is Y = β0 + β1 × (β2—X)2 , where (β2—X) = 0 for X > β2, Y is the dependent variable, X is the dietary Lys concentration, β0 is the value at the plateau, β1 is the slope and β2 is the Lys concentration at the break point. The EA was expressed as Y = β0 + β1 × (1 –EXP(– β2 × (X– β3), where Y is the dependent variable, X is the dietary Lys concentration, β0 is the response for the dependent variable estimated for the feed with the lower Lys, β1 is the difference estimated between the minimum and maximum response obtained by the increasing Lys, β2 is the slope of the exponential curve, β3 is the Lys at the lower level; requirement were estimated by calculating (ln(0.05) ÷ – β2) + β3 for 95% of the requirement and (ln(0.01) ÷ – β2) + β3 for 99%.
Results
Overall, there were no statistical differences between % mortality in any of the experiments (P > 0.05). Overall means for the period mortality in the 3 studies were 0.37%, 0.64% and 0.52% in Exp. 1, 2, and 3, respectively.
Experiment 1–1 to 12 d of age
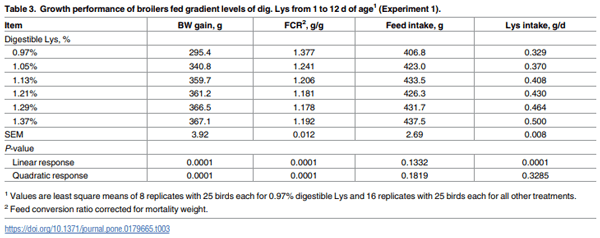
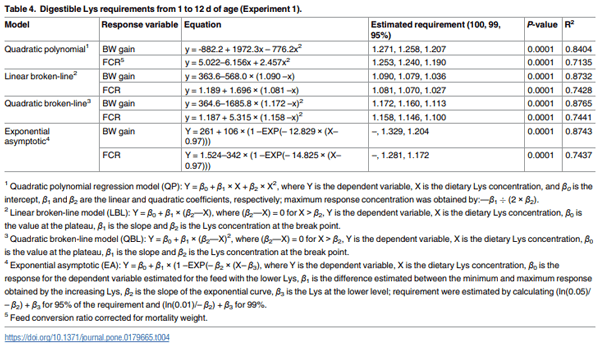
Feeding Cobb × Cobb 500 birds with increasing levels of dig. Lys resulted in a positive linear response (P ≤ 0.01) for dig. Lys intake and quadratic responses (P ≤ 0.01) for BWG and FCR (Table 3). Digestible Lys requirements estimates based on 100 and 99% of optimal responses were calculated and are shown in Table 4. The QP regression equations estimated 95% of dig. Lys requirement at 1.207% and 1.190% for BWG and FCR, respectively; the LBL model estimates were the lowest at 1.036% and 1.027% for BWG and FCR, respectively; the QBL model estimated at 1.113% for BWG and 1.100% for FCR; and the EA model estimated as 1.204% for BWG and 1.172% for FCR. When averaged across variables, 95% of dig. Lys requirement was estimated as 1.199% using the QP regression, 1.032% using LBL model, 1.107% using QBL model, and 1.188% using the EA model. The best fit was provided by the QBL for both BWG and FCR since its R2 was the highest (0.88 for BWG and 0.74 for FCR).
Experiment 2–12 to 28 d of age
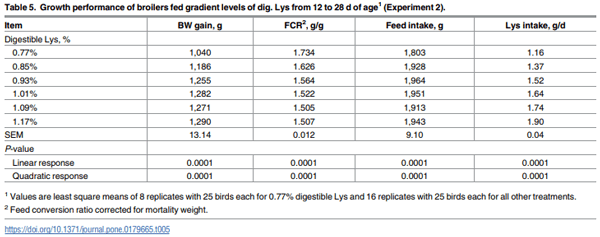
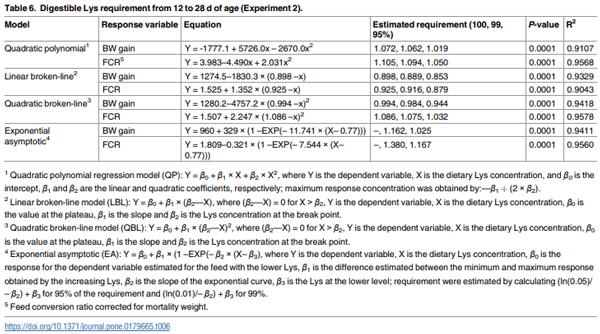
Significant quadratic responses (P ≤ 0.01) were observed for BWG, FCR, feed intake, and dig. Lys intake in the period from 12 to 28 d (Table 5). Digestible Lys requirements estimates based on 100, 99%, and 95% of optimal responses were calculated and are presented in Table 6. Digestible Lys requirements were estimated at 1.019% for BWG and 1.050% for FCR using the QP regression whereas the LBL model estimates were 0.853% for BWG and 0.879% for FCR. As in Exp. 1, the QBL model provided the best fit, which, at 95% of maximum response were 0.944% and 1.032% for BWG and FCR, respectively. The EA model estimated dig. Lys requirements as 1.025% for BWG and 1.167% for FCR. When averaged across variables, dig. Lys requirement were estimated as 1.035% using QP regression, 0.866% using LBL model, 0.988% using QBL model, and 1.096% using the exponential model.
Experiment 3–28 to 42 d of age
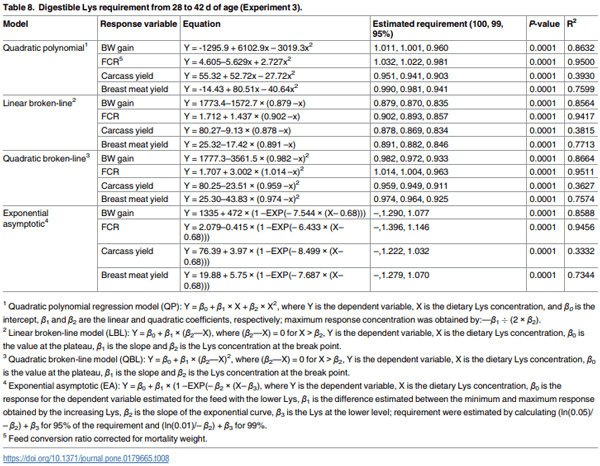
Growth performance and broiler processing data from 28 to 42 d are presented in Table 7. Providing broilers gradient concentrations of dig. Lys resulted in a linear response (P ≤ 0.01) for dig. Lys intake, and quadratic responses (P ≤ 0.05) for BWG, FCR, feed intake, dig. Lys intake, carcass yield, and breast meat yield from 28 to 42 d. Digestible Lys requirements estimates based on 100, 99%, and 95% of optimal responses were calculated and are represented in Table 8. The QP equations estimated dig. Lys requirements at 0.960, 0.981, 0.903, and 0.941% for BWG, FCR, carcass yield, and breast meat yield, respectively. The LBL model estimates were the lowest at 0.835% for BWG, 0.857% for FCR, 0.834 for carcass yield, and 0.846% for breast meat yield. The QBL model estimated dig. Lys requirements at 0.933, 0.963, 0.911, and 0.925% for BWG, FCR, carcass yield, and breast meat yield, respectively. The EA model estimated dig. Lys requirements as 1.077% for BWG, 1.146% for FCR, 1.032% for carcass yield, and 1.070% for breast meat yield. When averaged across variables, dig. Lys requirements were calculated as 0.946% using QP regression analysis, 0.843% using LBL model, 0.933% using QBL model, and 1.081% using the EA model. As in Exp. 1 and 2, QBL model provided the best fit for BWG and FCR. However, for the carcass yield, the LBL provided the best fit.
Discussion
Basal experimental diets utilized in the present research were based on corn, soybean meal, and corn gluten meal, and were formulated to contain CP and energy levels comparable to usual commercial diets in Brazil and US. It is crucial that requirement studies use a basal diet that is deficient in the tested AA to produce accurate estimates. Amino acid analysis determined that the basal diets in Exp. 1, 2, and 3 contained 1.12, 0.85, and 0.77% total Lys, respectively. Moreover, in these 3 experiments, broilers fed the basal diets presented poor performance compared with broilers fed the dose-response diets with increasing Lys levels, demonstrating that Lys was deficient in the basal diets.
In the present research, dig. Lys requirements varied depending upon the response criterion. Requirements for FCR was higher than BWG in Exp. 2 and 3, similar as observed in previous researches [12–14,16,29]. Apparently, as dig. Lys exceeds the concentration required for optimal BWG, growth rate is maintained while feed intake decreases, thus resulting in a higher requirement for FCR than BWG [3]. Furthermore, Lys increments produce more pronounced increases in BWG than feed intake and this is a consequence of FCR being a ratio between these variables. Therefore, as BWG increases, FCR is reduced thus increasing its requirement.
In parallel to results from the present study, previous research with broilers fed diets with progressive additions of dig. Lys had have shown quadratic increases in BWG and decreases in FCR in all studied ages [13,14,29,30]. Garcia and Batal (2005) [30] using the LBL model, estimated dig. Lys requirements ranging from 1.01 to 1.10% from 1 to 7 d, which is in agreement with our results from Exp. 1. Labadan et al. (2001) [12] estimated total Lys requirements from 1 to 14 d as 1.28% for BWG and 1.21% for FCR using the LBL model. Using the same model, Sklan and Noy (2003) [17] estimated lower dig. Lys requirements (0.92 to 0.96%) from 1 to 7 d. Digestible Lys requirements, from 1 to 14 d, using the QBL model was reported as 1.180% for BWG, which is in close agreement to our findings [14].
Dozier et al. (2009b) [16] estimated dig. Lys requirements from 14 to 28 d as 1.07% for BWG and 1.10% for FCR, respectively, using QP regression analysis, and as 1.09% for BWG and 1.15% for FCR, respectively, based on the QBL model. Although slightly lower, requirements from 12 to 28 d in Exp. 2 are similar to those previously reported. Furthermore, the QP regression demonstrated by Baker et al. (2002) [3] estimated dig. Lys requirements from 8 to 21 d as 0.97% for BWG and 1.03% for FCR using 90% of the maximal responses, which is in close agreement to the observed in Exp. 2. Labadan et al. (2001) [12] observed higher requirement estimate for BWG as 1.13% total Lys from 14 to 28 d using the LBL model.
Dozier et al. (2010) [13] estimated dig. Lys requirements from 28 to 42 d as 0.965% for BWG, 1.012% for FCR, 0.963% for carcass yield, and 0.981% for breast meat yield using QBL model, which are comparable to results in the present study. Similarly, Labadan et al. (2001) [12] using LBL model determined total Lys requirements as 0.94% for BWG and 0.95% for FCR. In contrast to our findings, Garcia et al. (2006) [18] estimated high dig. Lys requirements as 0.97, 0.96, 0.94, and 0.98% for BWG, FCR, and carcass yield, respectively, using the LBL model.
In the present study, 4 statistical models were generated in order to estimate dig. Lys requirements. Comparisons with previous research are valid; however, as breast muscles consistently increase as proportions of the total broiler due to genetic selection, the demand for Lys consumed also is expected to increase. Since genetic improvements also affect body weight gain and, therefore, feed intake, it could be questioned that the increased feed intake with the modern broiler would provide the increased Lys to sustain maximum breast yield. However, the breast muscle mass of the Ross 708 of 2009 broiler was 18% whereas the one from a heritage chicken of 1962 was 9% of the total body mass at 5 weeks [31]. Havenstein et al. (2003) [32] also concluded that genetics, nutrition and other management changes over the last 44 year have resulted in a 2001 broiler that required approximately one-third the time and over a threefold decrease in the amount of feed consumed to produce an 1,815 g Arbor Acres broiler. Additionally, Dozier et al. (2010) [13], using Cobb 700 broilers, also observed in two studies that the accelerated growth rate of broilers resulted in 10 to 12% higher digestible Lys requirements when expressed as a percentage of the diet than birds used in previous research.
The QP, LBL, QBL, and EA models have been thoroughly reviewed by Pesti et al. (2009) [15]. According to Pesti et al. (2009) [15], the QP regression analysis is simple to fit to data and maximum responses are easily obtained; however, it is not able to characterize the plateau that most nutritional responses are admitted to have. The broken-line models represent the concept of requirement, defined as the minimum nutrient level that result in maximum response; however more levels of the tested nutrient are required to obtain accurate estimates. Vedenov and Pesti (2008) [33] tested several nonlinear models, including LBL and QBL using different data sets and observed that one particular model is not necessarily the best for all nutritional responses and, therefore, the results of experiments should be the ones to dictate the model choice.
It is possible to compare models through their R2 and the sum of the square of residuals. Since the latter is a linear function of R2 values, the order of fit is the same. In the present research, all models tested were statistically significant (P ≤ 0.01). The model that provided the best fit was the QBL for BWG and FCR and the LBL for carcass and breast meat yield. The LBL model can underestimate requirements because response of broilers to increasing Lys levels is clearly nonlinear decreasing as the AA approaches its requirement what is popularly referred as the law of diminishing returns [25,27]. The QBL model provide a more accurate estimate of the Lys requirement when compared to the LBL model. The later simplifies the interpretation of growth curves if the response to a limiting AA is assumed to be sigmoidal [27]. On the other hand, the shape of QBL response curves does not allow for the safe limit for toxicity or growth impairment from a nutrient to be determined, which is possible with quadratic regression [15]. The model of choice, however, should meet both mathematical and biological aspects.
The comparisons between the present study with previous research have to take in consideration differences in studied variables such as strain, sex, age, type of diet, statistical model, and method (factorial vs. empirical). Overall, requirement estimates observed in the present research are notably higher than the recommended by the NRC (1994) [11]. The higher dig. Lys requirement observed in the present research was probably affected by genetics of the modern broiler, which allowed for less feed intake per unit of BW and greater meat accretion [13,32].
In conclusion, estimates of Lys requirements vary among response variables and statistical models; therefore, influencing recommendations to optimize economic performances. Throughout the 3 studies the requirement estimates for FCR were higher than BWG. Overall, the QBL model provided the best fit for growth performance variables and seemed adequate in both mathematical and biological backgrounds. Regardless of the model of choice, researchers should be familiar with the characteristics of each model to obtain precise and coherent requirements estimates.
Acknowledgments
Authors wish to thank Coordenac¸ão de Aperfeic¸oamento de Pessoal de Nivel Superior (CAPES), Fundac¸ão de Amparo à Pesquisa do Rio Grande do Sul (FAPERGS) and Evonik Nutrition & Care GmbH for their support.
Author Contributions
Conceptualization: SLV AH.
Data curation: HSC.
Formal analysis: CS MK.
Funding acquisition: SLV AH.
Investigation: HSC SLV.
Methodology: HSC.
Project administration: HSC SLV.
Resources: HSC SLV CS.
Supervision: LK.
Validation: HSC.
Visualization: HSC SLV.
Writing – original draft: HSC SLV CS.
Writing – review & editing: SLV CS.
This article was originally published in PLoS ONE 12(6): e0179665. https://doi.org/10.1371/journal. pone.0179665. This is an Open Access article distributed under the terms of the Creative Commons Attribution License. 


.jpg&w=3840&q=75)