Introduction
Over the years, nutritionists have studied several ways to determine the ideal dietary supply of essential amino acids to optimize poultry performance. However, considering only performance objectives without taking into account economic factors may not reflect maximum profitability, since optimizing performance is not always viable (Pack et al., 2003). An economic approach to determine amino acid supply by minimizing feeding costs and maximizing revenues was proposed by Pack et al. (2003). However, the minimum cost approach is only acceptable from an economic standpoint, when the revenue is held constant (Vedenov and Pesti, 2010; Pesti and Vedenov, 2011). The revenue is constant when a segmented model, such as the quadratic-plateau model, is used. In this model, once the plateau is reached, any increase in amino acid levels is assumed not to have any additional response effect (Hauschild et al., 2010).
Modern broiler diets are formulated with reduced crude protein and are often supplemented with crystalline SAA, Lys, and Thr to meet muscle accretion and feather synthesis requirements. In a previous study (Siqueira et al., 2011), the optimal economic levels of dietary Lys for broilers were estimated using the exponential equations described by Pack et al. (2003). Since maximum economic return is ideal for poultry production, determining SAA and Thr levels could represent an important step forward to optimizing production cost.
Imbalances in dietary amino acids supply may decrease their efficiency for utilization and consequently impair bird growth potential (Kidd, 2000; Kidd, et al., 2004) compromising economic return. In this context, establishing amino acid intake also requires an economic evaluation to determine which amount of the amino acid should be supplied in the feed to maximize economic return. Some researchers have reported dietary levels of SAA (Pack and Schutte, 1995) and Thr (Kidd et al., 1999) using economic evaluations, but the exponential models used in their economic approach may have limitations (Pesti and Vedenov, 2011).
In the present study we aimed to estimate the optimal SAA and Thr levels in broiler diets using segmented models fitted to performance data obtained in dose-response assays and based on economic analysis of gross margin over feed costs.
Materials and methods
Ethical considerations
The Ethics Committee on Animal Use of Faculdade de Ciências Agrárias e Veterinárias, Unesp, campus in Jaboticabal, São Paulo, Brazil, approved all the experimental procedures adopted in this study (protocol No. 007125-08).
Experimental design
Two dose-response assays were conducted to obtain the response of broilers submitted to different levels of digestible SAA and Thr. The trials were conducted at the Poultry Science Laboratory of Faculdade de Ciências Agrárias e Veterinárias, Unesp, campus in Jaboticabal, São Paulo, Brazil. For both amino acids, the study was divided into initial (1-14 days), grower (15-28 days), and finisher (29‑42 days) phases. In each trial, five hundred and sixty male Cobb 500® broilers were randomly assigned into seven treatments with four replicates of 20 birds. The treatments consisted of seven levels of digestible SAA or Thr.
Experimental diets
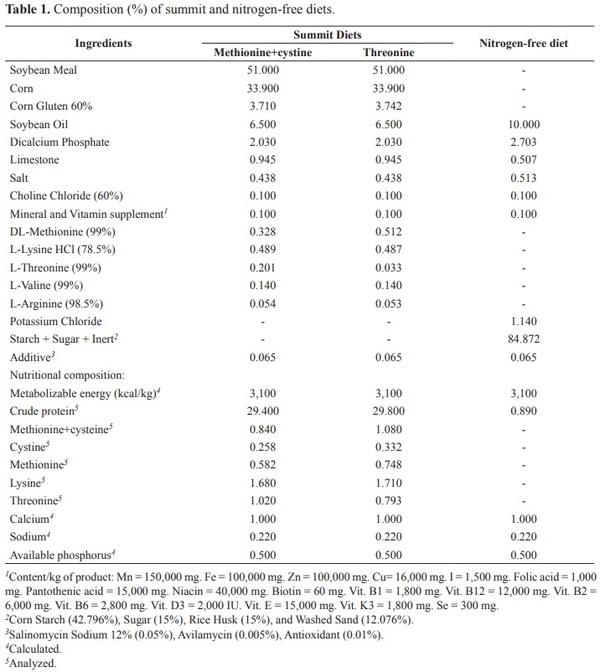
The experimental diets were formulated using the dilution technique (Fisher and Morris, 1970). The procedure consisted of formulating two diets: a summit diet with high nitrogen content, and a nitrogen-free diet (Table 1).
The summit diet was formulated to contain approximately 1.2 times the requirement of SAA or Thr suggested by Rostagno et al. (2011) for broilers during the respective phases. All the other essential amino acids were set at a minimum of 1.4 times their suggested levels.
The diets contained the same levels of energy, minerals, and vitamins recommended by Rostagno et al. (2011). Sulfur amino acid levels obtained from graded dilution of the summit and nitrogen-free diets ranged from 0.253 to 0.904%, 0.226 to 0.814%, and 0.208 to 0.750% for the starter, grower, and finisher phases, respectively. In the Thr assay, the levels studied ranged from 0.150 to 0.999% in the starter phase, 0.130 to 0.889% in the grower phase, and 0.120 to 0.819% in the finisher phase.
Management and data collection
In each trial, before assigning chicks to dietary treatments, all birds were individually weighed to guarantee homogeneous initial body weights among treatments and were randomly distributed in the experimental units. At the beginning of grower and finisher phases, birds were replaced by chicks raised separately until the 14th and 28th days of age, respectively. This practice avoided residual effects of treatments and, throughout this period, chicks were fed diets formulated to meet or exceed the nutritional recommendations of Brazilian Tables for Poultry and Swine (Rostagno et al., 2011). Broilers were raised in an environmentally controlled facility, in which temperature and humidity were set according to genetic guideline recommendations. Photoperiod was set daily at 24L. All pens were equipped with hanging feeders and nipple drinkers, which provided free access to water and feed (mash form) throughout the entire experimental period. The birds and the remaining feed were weighed at the end of each phase in each experiment to determine the mean body weight (BW) and feed intake (FI). Bodyweight gain (BWG) and feed conversion ratio were also calculated . Mortality was recorded daily to adjust FI and hence FCR.
Fitting the segmented models
To evaluate broiler response and proceed with the economic analysis, data was fitted to a quadratic model with a plateau (Robbins et al., 2006). This model consists of two segments that connect in a smooth manner. Therefore, for values of x less than x0, the mean of Y is a quadratic function in x. On the other hand, for values of x greater than x0, the mean of Y is constant, as follows:
where α, β, and γ are the coefficients of the quadratic segment and c is the plateau of the function. The NLIN procedure was used to fit the segmented model and to determine the join point (x0) between the quadratic function and plateau. Moreover, conditions on the two segments of the model were imposed:
1) The curve should be continuous, i.e., the quadratic and the plateau section need to meet at x0
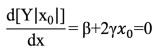
2) The curve should be smooth, i.e., the first derivative of the two segments with respect to x need to coincide at x0:
Solving x0 and substituting into the expression for c (c = α+ βx0 + γx02), the two conditions jointly imply that x0 = – β/2γ and c = α – β2/4γ. Thus, the PROC NLIN was used to fit this segmented model and obtain these coefficients for body weight gain (BWG) and feed intake (FI).
Determination of the optimal methionine and threonine level through economic approach
The procedures adopted to estimate the optimal economic SAA and Thr levels are described as follows. Initially, variation of feed price (ΔFP) (USD $/kg) was calculated in response to increasing dietary digestible SAA or Thr levels, as follows:
ΔFP = [PBD + (CAAS - ICAABD) × PAA]/100,
where PBD is price per kg of the basal diet without the addition of DL-methionine or L-threonine (USD $/kg); CAAS is the concentration of the amino acid in diet after its supplementation in crystalline form (%); ICAABD is the initial concentration of the amino acid in the basal diet (%), and PAA is the price of DL-methionine or L-threonine per kg (USD $/kg). Then, total feed costs (TFC) were calculated for each level of amino acid supplementation by multiplying daily feed intake (g) estimated in the segmented model by feed price variation (ΔFP) in the interval tested for each amino acid. Gross income (GI) was obtained by multiplying total body weight gain (daily BWG x number of days of the assay) estimated using the segmented model by the selling price of live broilers (USD $/kg). Based on feedstuff prices in Brazil, the price of basal diets used were calculated for starter, grower and finisher phases as 0.56, 0.55, and USD $0.52/kg, respectively, whereas the selling price of live broiler weight was assumed at USD $1.40/kg. The current prices of crystalline Met and Thr were considered as USD $3.00/kg. The gross margin obtained per bird (USD $/bird) was calculated for each supplementation level of either Met or Thr, as follows:
GM = GI - TFC,
where GM is the gross margin obtained per bird (USD $/bird); GI is the gross income (USD $/bird), and TFC is the total feed cost per bird (USD $/bird). In each phase, the optimal levels of digestible SAA and Thr in diets were obtained based on economic analysis, i.e., the optimal amino acid level was obtained when the amplitude between GI and TFC reached the greatest value, resulting in the maximum gross margin (GMmax). After this point, each supplementation level above the optimal would increase total feed costs, reducing the gross margin.
Statistical analyzes were performed using the computer program SAS, version 9.3, by means of GLM procedures for variance analysis and NLIN (Gauss-Newton) to adjust the segmented models (SAS, 2011).
Results
Growth performance
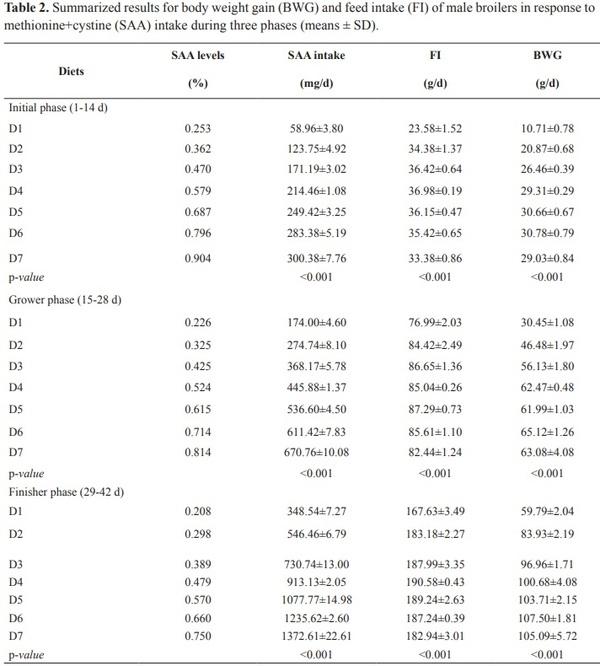
Graded SAA concentration in diets elicited a response in broiler FI and BWG regardless of the phases assessed (p< 0.01). Broilers in the starter phase exhibited maximum FI (35.67 g/ bird/d) and maximum BWG (30.04 g/bird/d) at 0.410 and 0.630% of SAA, respectively (Table 2). In the grower phase, FI achieved the highest value of 85.41 g/bird/d and maximum BWG was 63.42 g/bird/d when dietary Thr was provided at 0.380 and 0.590%, respectively. In the finisher phase, the amount of SAA in diets of 0.380% supported a maximum FI of 187.42 g/ bird/d, whereas the level of these amino acids, which maximized BWG in 104.58 g/bird/d was 0.520%. In all the phases assessed, the estimated breakpoints for BWG were higher than those estimated for FI; i.e., at some point, BWG continually grew when FI had already achieved the response plateau. Therefore, assuming that broiler FI theoretically remained the same after the breakpoint, we estimated the optimal SAA intake (mg/bird/d) for BWG by multiplying the maximum FI estimated in each phase by the SAA level (%) which optimized BWG. Therefore, optimal daily SAA intake for BWG in the starter, grower, and finisher phases were 225, 504, and 975 mg/bird/d, respectively.
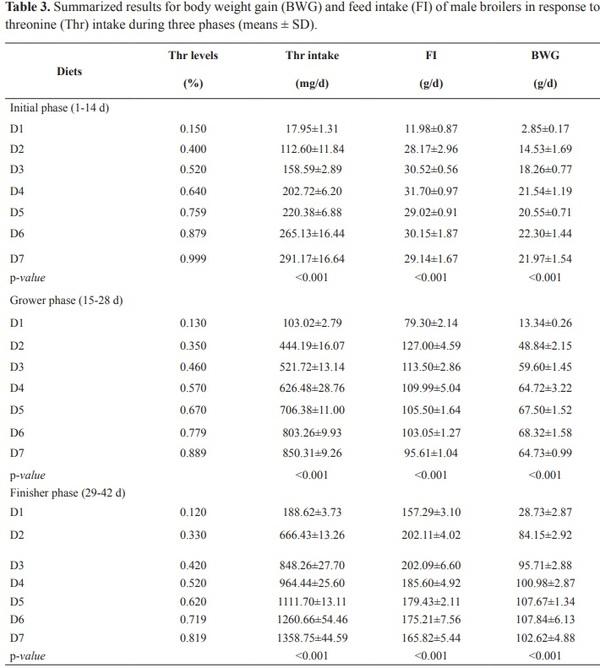
As SAA, graded levels of digestible Thr influenced (p< 0.01) broiler BWG and FI regardless of the phase evaluated (Tables 2 and 3).
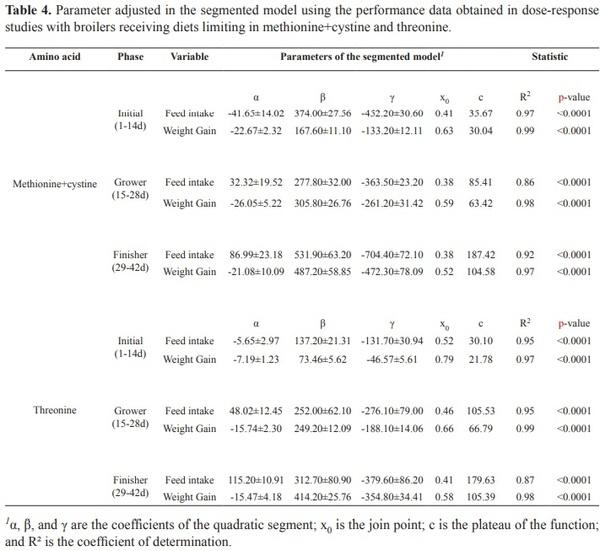
For broilers in the starter phase, the quadratic broken-line model estimated maximum FI (30.10 g/bird/d) at 0.520% of Thr, and maximum BWG (21.78 g/bird/d) at 0.790%. In the grower phase the highest values of FI (105.53 g/bird/d) and BWG (66.79 g/bird/d) were achieved at 0.460 and 0.660% of Thr, respectively. In the finisher phase, the Thr levels, which maximized FI in 179.63 g/bird/d and BWG in 105.39 g/bird/d, were 0.410 and 0.580%, respectively. Following the same procedures adopted in SAA assays, we estimated the optimal Thr intake for BWG in the starter, grower, and finisher phases in 236, 696, 1,042 mg/bird/d, respectively. From a statistical point of view, the segmented models were adequate to describe broiler responses in function of increasing dietary digestible SAA and Thr levels in all phases (Table 4).
Economic analysis
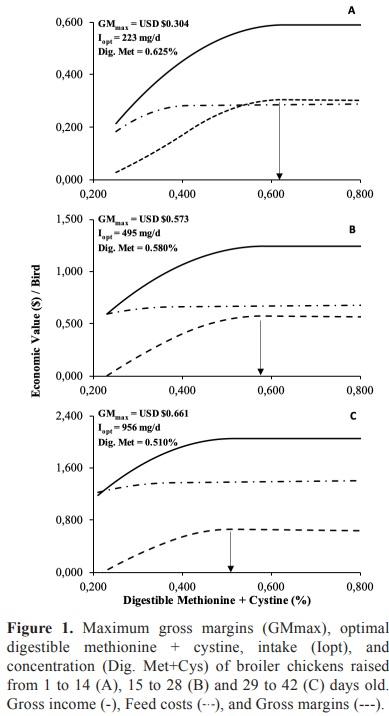
Sulfur amino acids. The GI values calculated for the starter, grower, and finisher phases were 0.589, 1.244, and USD 2.049/bird, respectively. Total feed cost was calculated as 0.285, 0.670, and USD 1.412/bird for the starter, grower, and finisher phases, respectively. Hence, the gross margin (GI-TFC) calculated for the starter, grower, and finisher phases were 0.304 (Fig. 1A), 0.573 (Fig. 1B), and USD 0.638 (Fig. 1C), respectively.
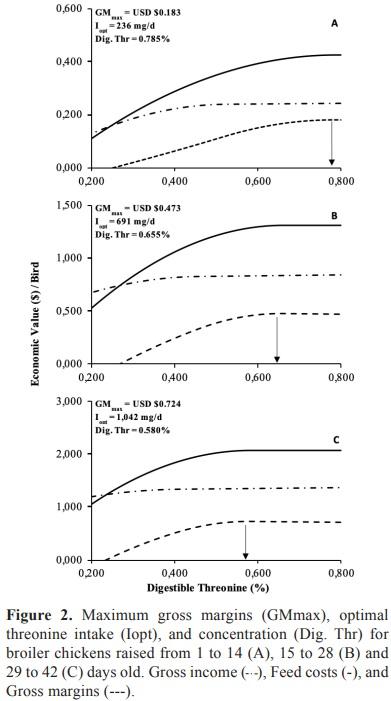
Threonine. The calculated gross income for the starter, grower, and finisher phases were 0.427, 1.309, and USD 2.066/bird, respectively. The values obtained for TFC were 0.244, 0.836, and USD 1.342/bird for the starter, grower, and finisher phases, respectively. Based on these values, the gross margin (GI-TFC) for starter, grower, and finisher phases were calculated as USD 0.183 (Fig. 2A), USD $0.473 (Fig. 2B), and USD 0.724 (Fig. 2C), respectively.
Discussion
Rather than using an exponential model to estimate the optimal economic SAA and Thr levels for broilers, this study opted for a segmented model (polynomial quadratic with plateau) to fulfill such purpose. We believe that extrapolating unknown points outside the control point distribution space may increase errors, which in turn, may not represent properly the biological processes, as observed by Kratzer and Littell (2006). Our results showed that the optimal economic amino acid intake coincides with the optimal amino acid intake for optimal weight gain, which leads to conclude that, in this case, weight gain is the determinant factor in defining the optimal level that maximizes profit. Similarly, Kidd et al. (1999) noted that the optimal Thr level for best profitability was close to that which maximized broiler performance.
Regarding the optimal Thr level for performance for the starter phase, Barkley and Wallis (2001) reported that 7.2 g Thr/kg diet maximized broiler BW from 7 to 21 d of age. This value was lower in the present study, but it was expected due to the modeling and the procedures used to estimate body composition. For the grower phase, Rangel-Lugo et al. (1994) estimated that 6.3 g/kg of diet could be used to maximize weight gain in broilers from 16 to 28 d, which is close to the amount of Thr found herein (6.6 g/kg of diet). After performing economic analysis, Kidd et al. (1999) suggested that meeting the minimum dietary amount of Thr for broilers in the finisher phase (about 0.60% digestible Thr in the diet) is necessary to optimize profitability. This value is not too far from the digestible Thr recommendation found herein, which was 0.580%.
Ohta and Ishibashi (1994) suggested that 0.66% of SAA is required for maximum broiler growth performance from 8 to 18 days of age, which is slightly higher than the 0.630% estimated in our study. Lumpkins et al. (2007) also found a similar SAA requirement for BWG (0.67%) in the starter phase (0 to 3 weeks of age). At the grower period (21-42 d), the same authors found the requirements for SAA as 0.55% to maximize BWG, which is close to the values observed here (0.590% in the grower phase, and 0.520% in the finisher phase). On the other hand, Goulart et al. (2011) reported the optimal SAA levels of 0.873, 0.755, 0.748, and 0.661% for Cobb male broilers in the prestarter (1-7d), starter (8-21d), grower (22-35d) and finisher (36-42d) phases, respectively.
Pack and Schutte (1995) suggested a dietary level of 0.95% SAA as the most profitable level for broilers grown to 1.7 kg under European price conditions, which is higher in comparison with the recommendations based on the given price conditions of the current study. The optimal intake observed for dietary Thr to optimize BWG or GM are not too different from those reported in the literature, even when different models were used.
However, the same behavior was not observed for SAA levels recommended in the literature, where higher values are often described. The optimal intake for SAA found in the current study was similar to Lumpkins et al. (2007), who used a broken-line model with one slope that is known by underestimating the nutrient requirements. On the other hand, the segmented model used for fitting the performance data estimated the optimal level in the highest point as in the polynomial quadratic model. However, the values were lower than those predicted by Goulart et al. (2011) using the quadratic model. A possible explanation may rely on the difference among birds on dietary SAA utilization for gain, which resulted in lower levels of SAA required than in those studies.
Considering the prices of L-threonine and DL-methionine as USD $3.00/kg, the optimal SAA levels to improve GM were 225, 504, and 975 mg/d. In contrast, for Thr these values were 236, 696, and 1042 mg/d for the starter, grower and finisher phases, respectively. When both crystalline amino acid prices doubled to USD $6.00/kg, the optimal SAA intakes switched to 222, 494, and 946 mg/d and Thr intakes to 233, 686, and 1,033 mg/d in starter, grower and finisher phases, respectively. Regarding different economic scenarios (changing prices of feed and selling price), the optimal economic intake of dietary SAA and Thr were slightly affected. The DL-methionine and L-threonine are the feed ingredients with highest impact on economic return; such observation was also reported by Pack and Schutte (1995). The increase in the crystalline amino acid price from USD 3.00 to 6.00 decreased the maximum GM by 1.89, 2.24, and 3.70% for SAA and by 4.54, 5.15, and 4.99% for Thr within the starter, grower and finisher phases, respectively. The increase of the DL-methionine price caused a lower variation in the gross margin than the Thr price increase. This is because broilers are 3less efficient in using dietary Thr, since they need more feed to achieve a lower value of BWG when compared to birds fed a diet containing crescent levels of SAA. Therefore, to achieve the optimum economic return, the efficiency of nutrient utilization should be taken into account.
Even though our simulations provide an idea about the behavior of feed cost in response to changes in the price of inputs (feedstuffs) and outputs (live broiler BW), a complete economic analysis should include all the variable and/or fix costs in poultry production. Nevertheless, feed costs represent about 65 to 70% of total poultry production, thus, improving the economic return related to feed cost is an essential step toward maximum profit. For example, the TFC in the finisher phase resulted in USD 1.412/bird for broilers fed SAA. However, one may assume the existence of 30% more costs, aiming to estimate a total production cost, in this case resulting in USD 1.836/bird. Discounting this value from GI of USD 2.049/bird, net profit will result in approximately USD 0.213 per bird.
In conclusion, variations on the crystalline amino acid prices slightly affected the optimal economic intake of total sulfur amino acid and Thr. Therefore, considering the cost of DLmethionine and L-threonine at USD $ 3.00/ kg, the optimal total sulfur amino acid intakes to optimize GM was 223, 504 and 975 mg/ bird/d, and 236, 696, and 1,042 mg/bird/d for Thr in starter, grower and finisher phases, respectively.


.jpg&w=3840&q=75)