Relative Bioavailability of DL and L-Methionine in Broilers
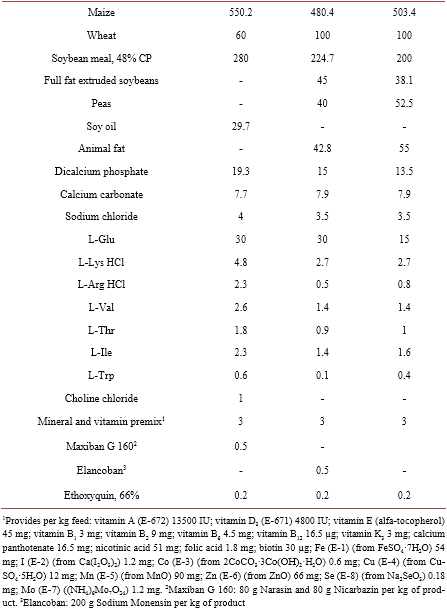
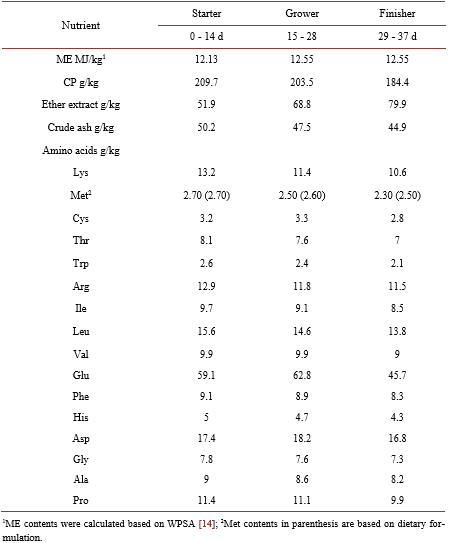
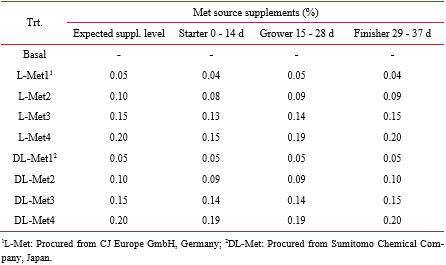
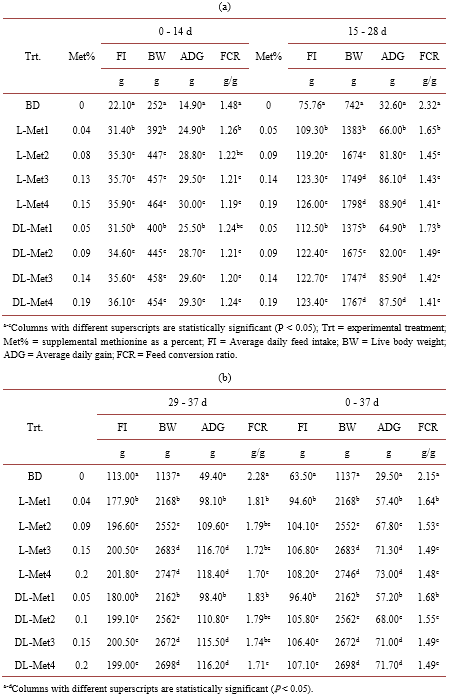
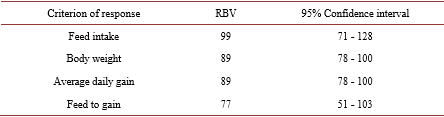
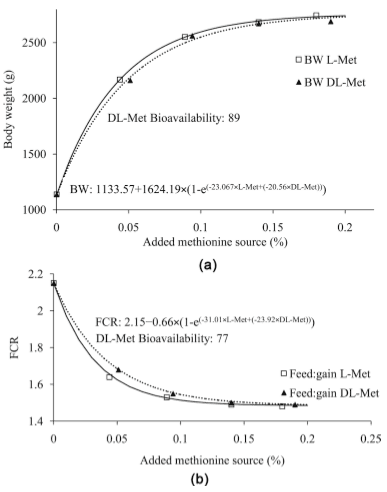
Studies on the relative bioavailability (RBV) of DL-Methionine (DL-Met) to L-Methionine (L-Met) have produced variable results. An experiment was conducted to determine the RBV of DL to L-Met. A total of 2268 1-day old male chicken were housed in 54 floor pens (42 bird/pen). There were 9 treatments (6 repetitions) including the basal diet (BD). The BD was deficient in Met content with 0.27, 0.26 and 0.25 in the starter, grower and finisher periods respectively. Four levels of experimental diets for each DL-Met and L-Met were created by supplementing 0.05%, 0.10%, 0.15% and 0.20% of DLor L-Met to the BD. The feeding program consisted of starter (0-14 d, 21% CP and 2900 kcal ME/kg), grower (15 - 28 d, 20% CP and 3000 kcal ME/kg) and finisher period (29 - 37 d, 18.5% CP and 3050 kcal ME/kg). Chickens and feed were weighed at the end of each age period. Regression coefficients of a common plateau asymptotic regression were used to calculate RBV. Birds responded to gradual increase in Met levels, BW, FCR and ADG were significantly (P < 0.05) higher in treatment groups as compared to control. Through the study period (37 d), the RBVs of DL-Met for BW and FCR were 89 and 77 respectively.
Keywords: Bioavailability, DL-Methionine, L-Methionine, Broilers.
2. Materials and Methods
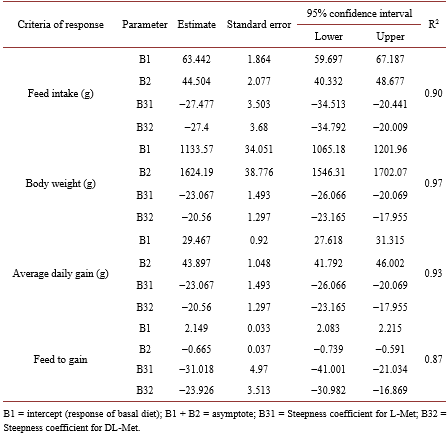
B1 = intercept (response of basal diet)
B1 + B2 = asymptote
B31 = Steepness coefficient for L-Met
B32 = Steepness coefficient for DL-Met
X1 = level of L-Met
X2 = level of DL-Met
The bioavailability for DL-Met relative to L-Met was calculated by the ratios
of regression coefficients B31 and B32 according to Elwert et al. [18]. RBV = 100
* B31/B32
3. Results
5. Conclusion
[1] Esteve-Garcia, E. and Austic, R.E. (1993) Intestinal Absorption and Renal Excretion of Dietary Methionine Sources by the Growing Chicken. Journal of Nutritional Biochemistry, 4, 576-587. https://doi.org/10.1016/0955-2863(93)90026-S
[2] Grau, C.R. and Almquist, H.J. (1943) The Utilization of the Sulphur Amino Acids by the Chick. Journal of Nutrition, 26, 631-640. https://doi.org/10.1093/jn/26.6.631
[3] Fell, R.V., Wilkerson, W.S. and Watts, A.B. (1959) The Utilization by the Chick of D- and L-Amino Acids in Liquid and Dry Diets. Poultry Science, 38, 1203-1204.
[4] Leveille, G.A., Shapiro, R. and Fisher, H. (1960) Amino Acid Requirements for Maintenance of the Adult Rooster. Journal of Nutrition, 72, 8-15. https://doi.org/10.1093/jn/72.1.8
[5] Brüggeman, J., Drepper, K. and Zucker, H. (1964) Quantitative Bestimmung der Verwertung von D-, L-, DL-Methionine und Ca-DL-2-hydroxy-4-methylthiobutyrat durch das Hüner Küken. Natturwissenschaften, 49, 334. https://doi.org/10.1007/BF00602214
[6] Smith, R.E. (1966) The Utilization of L-Methionine, DL-Methionine and Methionine Hydroxy Analogue by the Growing Chick. Poultry Science, 45, 571-577. https://doi.org/10.3382/ps.0450571
[7] Gutteridge, D.G.A. and Lewis, D. (1964) Chick Bioassay of Methionine and Cytosine. II. Assay of Soybean Meals, Ground and Nut Meals, Meat Meals, Methionine Isomers and Methionine Analogue. British Poultry Science, 5, 193-200. https://doi.org/10.1080/00071666408415532
[8] Dilger, R., Kobler, N.C., Weckbecker, C., Hoehler, D. and Baker, D.H. (2007) 2-Keto-4-(Methylthio)Butyric Acid (Keto Analog of Methionine) Is a Safer and Efficacious Precursor of L-Methionine in Chicks. Journal of Nutrition, 137, 1868-1873. https://doi.org/10.1093/jn/137.8.1868
[9] Marret, L., Bird, H.R. and Sunde, M.L. (1964) The Effects of Different Isomers of Methionine on Growth of Chicks Fed Amino Acid Diets. Poultry Science, 43, 1113-1118. https://doi.org/10.3382/ps.0431113
[10] Katz, R.S. and Baker, D.H. (1975) Efficacy of D- L- and DL-Methionine for Growth of Chicks Fed Crystalline Amino Acid Diets. Poultry Science, 54, 1667-1674. https://doi.org/10.3382/ps.0541667
[11] Tipton, H.C., Dilworth, B.C. and Day, E.J. (1966) A Comparison of D-, L- and DL-Methionine and Methionine Analogue Calcium in Chick Diets. Poultry Science, 45, 381-387. https://doi.org/10.3382/ps.0450381
[12] European Union (2010) Directive 63 of the European Parliament and of the Council of 22 September on the Protection of Animals Used for Scientific Purposes. Official Journal of European Union L, 276, 33.
[13] Aviagen, T. (2014) Ross 308 Broiler Nutrition Specifications. Aviagen Group, Huntsville. http://en.aviagen.com/assets/Tech_Center/Ross_Broiler/Ross-308-Broiler-Nutrition -Specs-2014r17-EN.pdf
[14] WPSA. World’s Poultry Science Association (1984) The Prediction of Apparent Metabolizable Energy Values for Poultry in Compound Feeds. World’s Poultry Science Journal, 40, 181-182.
[15] AOAC (2000) Official Methods of Analysis. 17th Edition, Association of Official Analytical Chemists Washington DC.
[16] Naumann, C. and Bassler, R. (1997) Die chemischen Untersuchungen von Futtermitteln. Methodenbuch, Volume III, Kapital 4.11.1. Aminosäuren, VDLUFA-Verlag, Darmstadt.
[17] Littell, R.C., Henry, P.R., Lewis, A.J. and Ammerman, C.B. (1997) Estimation of Relative Bioavailability of Nutrients using SAS Procedures. Journal of Animal Science, 75, 2672-2683. https://doi.org/10.2527/1997.75102672x
[18] Elwert, C., De abreu fernandes, E. and Lemme, A. (2008) Biological Effectiveness of Methionine Hydroxyl-Analogue Calcium Salt in Relation to DL-Methionine in Broiler Chickens. Asian-Australasian Journal of Animal Sciences, 21, 1506-1515. https://doi.org/10.5713/ajas.2008.80201
[19] Hoehler, D. (2006) No Evidence of Different Dose Responses of Commercial Methionine Sources in Broiler. Poultry Science, 85, 2047. https://doi.org/10.1093/ps/85.12.2047
[20] Zelenka, J., Heger, J., Machander, V., Wiltafsky, M. and Lestak, M. (2013) Bioavailability of Liquid Methionine Hydoxyanalogue-Free Acid Relative to DL-Methionine in Broilers. Acta Universitatis Agriculturae et Silviculturae Mendelianae Brunensis, 61, 1513-1520. https://doi.org/10.11118/actaun201361051513
[21] Shen, Y.B., Weaver, A.C. and Kim, S.W. (2014) Effect of Feed Grade L-Methionine on Growth Performance and Gut Health in Nursery Pigs Compared with Conventional DL-Methionine. Journal of Animal Science, 92, 5530-5539. https://doi.org/10.2527/jas.2014-7830
[22] Kong, C., Park, C.S., Ahn, J.Y. and Kim, B.G. (2016) Relative Bioavailability of DL-Methionine Compared with L-Methionine Fed to Nursery Pigs. Animal Feed Science and Technology, 215,181-185. https://doi.org/10.1016/j.anifeedsci.2016.03.011
[23] Rosen, G.D. (2007) Nutritive Values of Methionine Sources. Poultry Science, 86, 209-210. https://doi.org/10.1093/ps/86.2.209
[24] Kratzer, D.D. and Littell, R.C. (2006) Appropriate Statistical Methods to Compare Dose Response to Methionine Sources. Poultry Science, 85, 947-954. https://doi.org/10.1093/ps/85.5.947
[25] Piepho, H.P. (2006) A Cautionary Note on Appropriate Statistical Methods to Compare Dose Responses to Methionine Sources. Poultry Science, 85, 1511-1512.
[26] Noll, S.L., Waibel, P.E., Cook, R.D. and Witmer, J.A. (1984) Biopotency of Methionine Sources for Young Turkeys. Poultry Science, 63, 2458-2470. https://doi.org/10.3382/ps.0632458


.jpg&w=3840&q=75)


Dr. Kamaran, to complement your suggestion it would be opportune to inform, which would be the amino acids that have antagonism with methionine.


United States


