Measurement of the nutrient and energy contents of feedstuffs: Is the adoption of the latest approaches to analysis overdue?
Published: July 13, 2026
Source : Gene M. Pesti 1, 2 * / 1 The Poultry Hub Australia, CJ Hawkins Homestead, University of New England, Armidale, NSW 2351, Australia; 2 Poultry Science and Animal Nutrition, University of Georgia, Athens, GA 30602-2772, USA.
Introduction
Poultry scientists have long discussed and debated how the energy values of feed ingredients should be expressed (Zuidhof 2019). Pesti (2024) suggested that it is time for a paradigm shift in the way feed ingredient nutrient contents are described, and labeled the new categories collectively the Armidale method (see Fig. 1 for examples). He also proposed expanding the net energy (NE) to NEATP, based on the production of adenosine triphosphate (ATP) system of (Jansman et al.2004; Van Der Klis et al. 2010; Van Der Klis and Jansman 2019)(NEATP) by using the categories from the Armidale method (Pesti 2025a, 2025b)..
Proximate analysis methods are crude by definition and inconsistent with the current understanding of chemistry. For instance, the crude fiber in wheat is near 2%, whereas the true fiber content is near 12% (Pesti et al.2024). The energy content of feed ingredients is still based on bioassay results, related primarily to crude chemical analyses based on 1860s technology.
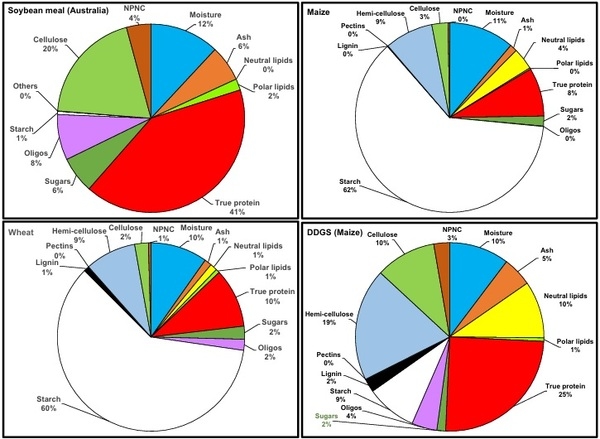
Fig. 1. The composition of several feed ingredients as measured by the Armidale method. DDGS, distillers dried grains with solubles; NPNC, non-protein nitrogenous compounds.
Nutritionists are taught the latest 21st-century nutritional biochemistry, molecular genetics and, perhaps, feed analytical techniques. Then they begin to work in the animal industries where they are expected to know how to formulate animal feed by using 1950s, least-cost, linear programming technology. Their challenges are reduced to questions of what value they should put in the computer, for example, for the lysine requirements of finishing broilers or what values should be used for the digestible threonine of soybean meal when a feed is super-dosed with phytase, etc.
Fisher (2015) expressed the importance of changing from least-cost feed formulation models based on meeting minimum requirements to profit-maximizing formulation models:
The idea that populations of birds have characteristic requirements for nutrients is hard to defend and the logical way to determine nutrient feeding levels for commercial use is to interpret the experimentally observed response in economic terms :::. This is one area of poultry science where the early adoption of a systems approach and the use of modelling would have led to a better use of resources and to better practical decision making. These ideas were discussed by Pesti and Miller (1997) and have been updated by Gous (see Gous, Chapter 13, this volume) (p. 5).
Although there have been profit-maximizing models available for some time (Oviedo-Rondon 2015), the industry has been slow to adopt them. At least part of the reason for slow adoption may be the nature of the crude dietary descriptions on which many advanced models have been based on. How best then to move forward, away from the 19th century paradigms?
The NEATP system can help nutritionists conceptualize existing problems with feed formulation
The critical argument for changing to a new NEATP system can be found by careful study of Fig. 2, including the following:
DE = GE − FE,
where DE = digestible energy, GE = gross energy and FE = fecal energy. FE is not usable by the animal and is meaningless.
ME = DE − UE,
where ME = metabolizable energy and UE = urinary energy. UE is not available to the animal and should be omitted.
NE = ME − HI,
where HI = heat increment, or calorigenic effect of feed.
In contrast, HI energy is usable by the animal and is helpful for animals in cool environments. The misconception that the heat increment is not usable is shown in Fig. 2 (from fig. 15.1, p. 280, of The Fire of Life by Max Kleiber (1975)). The HI is usable and useful for the animal to raise its body from ambient environmental temperature to body temperature. It makes no sense to not credit feed ingredients for energy that contributes to keeping the animal’s body warm! HI is measurable only if it is greater than what is needed to warm the body from ambient environmental to normal body temperature. If the HI is greater than what is needed to warm the body, then heat stress exists, and the animal will have to use energy to cool itself. The HI, or caloric effect of food, lowers the critical temperature, allowing the animal to deposit energy in meat, milk or eggs (Fig. 3).
To properly compare the dynamics of feed energy allocation and needs for different animals kept at different temperatures, it will be necessary to model both the total potential energy content and HI of feed ingredients (Fig. 4). The comparable energy content of the various nutrients in a feed are best represented by their ATP-generating potentials (Livesey 1984; Jansman et al. 2004; Coles et al. 2013; Moughan 2018). The entire amount of ATP generated by a feed ingredient should be used to determine how much energy is available to heat the body and to produce meat,
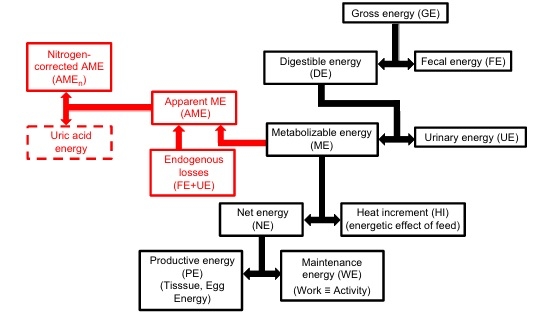
Fig. 2. The classical animal energy classifications (black) and terminology based on assay conditions (red).
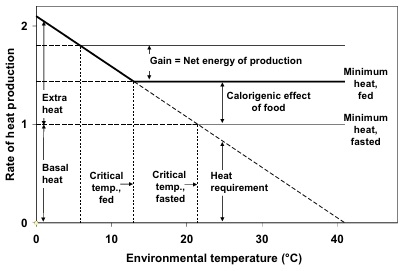
Fig. 3. Schematic diagram showing bird heat production versus environmental temperature (redrawn from fig. 15.1 of Kleibe
milk, or eggs. The ATP energy from the HI is necessary to model how the ingredient is affecting total heat production and the potential for heat stress at different environmental temperatures (Küçüktopcu 2023). The HI should not be ignored, but estimated through the calculation of ATP produced in nutrient metabolism for its value in warming the body and deleterious effects when warming the body is not needed.
Nutrition is a relatively new and evolving science
Feed ingredient (proximate) analysis is still primarily based on 1860s crude chemical analytical techniques (Severe 2022). Since the introduction of the Weende (or proximate analysis) system in 1866 (Wardeh 1981) and its adoption by the US Department of Agriculture in 1888 (Severe 2022), great strides in both the chemical analysis of feeds and, subsequently, nutritional requirements of livestock have been made.
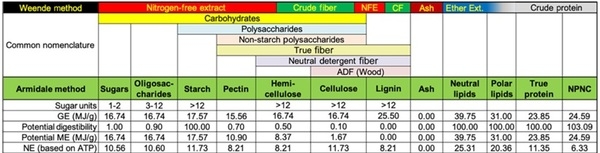
Fig. 4. A comparison of the Weende and Armidale methods for classifying ingredient composition. ADF, acid detergent fibre; NPNC, non-protein nitrogenous compounds.
The Weende system categorized the chemical composition of feed ingredients into the following six components: the moisture content; the nitrogenous or albuminous material (the nature of protein was not yet known); the ether extract or fat soluble material; the ash that was the residual after burning; the fibrous material that was not ash and not soluble in acid or alkali solutions; and the nitrogen-free extract representing the soluble carbohydrate fraction. Nitrogen-free ‘extract’ was a poor translation from German into English, because it is the residual, not an extract. It is found by difference, 100 minus the percentages of the others. As a result, the Weende system results always total exactly 100%.
Over time, analytical and synthetic chemists improved methods of food and feed analysis, leading to many improvements in nutritional science (e.g. DuVigneaud 1952; Carpenter et al.1997; Olson 1998). The ash has been fractionated into many macro- and micro-minerals and the requirement of each has been determined. The albuminous fraction was determined to be mainly protein, made of amino acids, but also many other non-protein nitrogenous compounds such as nucleotides and phospholipids. The crude fiber fraction has been found to contain cellulose, hemi-cellulose, lignin and some of the nitrogen-free extract.
Nutritionists decided to use metabolizable energy (ME) as the standard for poultry feeds because productive energy (PE) was too variable and results could not be repeated. The results could not be repeated because the bird’s nitrogen balance and activity were affecting the results. The simple solution was to use one ME value adjusted to zero nitrogen retention and not credit the feed for energy retained in the bird carcass. An alternative is to find and properly adjust for the energy used for heat production versus body warming according to nitrogen retention, and give the feed its due. NEATP modeling will make that possible. Another system with the same goal (effective energy) was proposed by Emmans (1994) and applied to the EFG growth model (Fisher and Gous 1998). The NEATP method improves on Emmens’ system because it is not based on ME measurements, which are based on crude measures of feed composition.
Towards a new feed energy paradigm
The one obvious exception to nutritional science changing with improvements in analytical chemistry has been in the estimation of the energy content of feeds. Methods to estimate the energy content of feed ingredients are still primarily based on proximate analysis (WPSA 1989; Mateos et al. 2018). Jansman et al. (2004) proposed a new net energy system for broilers based on the ATP-generating capacity contributions of the various chemicals in feed ingredients. The system is based on digestible true protein, digestible DNA and RNA bases, digestible fat, fermentable carbohydrates, and fermentation of sugars and starch.
Pesti (2024, 2025b) expanded on the feed composition categories proposed by Jansman et al. (2004) to create the Armidale method (Fig. 4). Instead of a single coefficient to convert nitrogen content to crude protein, true protein is represented as the sum of the amino acid residues. A category called the non-protein nitrogenous (NPNC) compounds was introduced to replace Jansman’s digestible pentose bases, DNA and RNA. The lipid fraction was separated into neutral and polar lipids. The carbohydrate fraction was separated into sugars, oligosaccharides, starch, pectin, hemicellulose, cellulose and lignin on the basis of the work of Choct (2015).
Unlike the Weende method, components of the Armidale method do not always sum to a perfect 1000 g/kg. When the Armidale method constituents were estimated for 25 ingredients primarily by using the Australian Feed Ingredient Database (AFiD; Moss 2020), the mean ± s.d. was 1032 ± 49.5 g/kg (Pesti 2024). Some ingredient totals were very close to comparable Weende method values, whereas some were not.
Defining and developing a new feed composition paradigm
Reliance on the Weende method led to considerable complacency in finding out what is in many commonly fed ingredients. For instance, xylanase is currently being added to many feeds around the world, without knowing the actual xylan concentration of important feed ingredients such as soybean meal.
The Armidale method should be seen only as a beginning point for discussion. There are questions that need to be answered before it can be implemented, including the following:
How should each fraction be defined and determined?
○ Are different methods appropriate for different ingredients?
○ What method should be used for starch?
○ What methods should be used for neutral and polar lipids?
○ How should choline and betaine be accounted for because they are oxidized to glycine?
The ash contents of which ingredients are best measured by wet and dry methods?
Is the difference even important?
What is the best way to measure the carbohydrate fractions?
Do the various methods sum to 1000 g/kg for all ingredients?
○ If not, why not?
Defining and developing a new feed energy paradigm
As already discussed, the present ME and NE systems used for estimating the potential energy contributions of feed ingredients are fraught with problems (Mateos et al. 2018; Pesti 2025a). ME estimates the apparent, not true, energy contributions of ingredients. The values for fats are not additive, depending on the level of inclusion (Mateos and Sell 1980a, 1980b, 1981). For poultry, values are corrected to zero nitrogen balance, despite the animals being fed not being in a state of zero nitrogen balance. Feed manufacturing methods affect overall nutrient and ingredient utilization. The technical value of feed processing, especially pelleting, on utilization of each nutrient needs to be quantitated so that the economic value can be properly evaluated.
Each of the nutrient categories in the Armidale method should ideally have estimates of their potential digestibilities and energy contents. The energetic contribution of each component can then be calculated and tailored to individual samples. Knowing what the digestion and absorption of all ingredient fractions is important for all systems and ingredients.
In the present ME and NE system predictions, the energy contents of all the nitrogenous fractions (including the phospholipid-containing choline, betaine, serine, etc.) are based on the total nitrogen content of the ingredient. In the future, energy contributions of proteins should be based on the digestibility and energy contents of each amino acid. Jansman et al. (2004) proposed using a single coefficient of 9.70 KJ for the NEATP content of protein. Since the amino acid compositions of feed ingredients are known, it is reasonable to base the energetic content of proteins on their individual amino acids. There are important differences in the energetic contribution of proteins. The NEATP of sorghum protein is 19% higher than is the NEATP of meat meal protein, for instance (Pesti 2025b).
As discussed by Pesti (2025b), ME measurements are dependent on the nitrogen balance of animals, and especially so for birds. PE is dependent on the activity and temperature of the test animal’s environment. Bioassay results based on crude feed analytical techniques are not helpful for adapting to environmental changes, except to calibrate advanced models, which is, of course, very important.
Advantages of NEATP for feed formulation and modeling
When the pioneers of energy metabolism were first investi gating the heat increment, their experiments lacked appropriate controls (Kleiber 1975, Fig. 3). The obligatory heat loss from nutrients during metabolism was measurable only when it exceeded the amount of energy from warming the animal’s body from the ambient environmental temperature to body temperature (Fig. 3). Extra heat production followed feeding meat, but not feeding bone. The chemical energy provided in meat was more than that provided by bone, but only the obligatory heat loss from meat exceeded the heat necessary to warm the body. Today, through understanding the biochemistry involved, we know that the conclusion that there is more obligatory heat loss when protein is being digested, absorbed and deposited in tissue than when minerals are being digested, was correct. It is possible to estimate the heat produced as a function of ATP production through understanding the biochemical pathways involved.
As animals grow, feed protein utilization (grams oxidized per grams ingested) increases. Therefore, the proportion of obligatory heat loss (HI) increases as birds age. Understanding how ATP generation changes with age will allow producers to balance the costs of heat coming from the feed versus heat coming from the environment. Young birds have relatively low obligatory heat loss from dietary protein (HI) because they deposit a relatively high amount of protein into their tissues, but they have relatively high heat losses to the environment because of their greater surface area to bodyweight ratio (Pesti and Billard 2024).
With an NEATP-based system, adjustments in heat production for the amino acids being deposited in the animal’s body, versus those oxidized to uric acid, can be accounted for. The feed ingredients should be given credit for all heat they supply, whether it is deposited in the tissues or used to heat the bird’s body.
Animals can be a significant source of heat for their environments. By modeling the NEATP production of the birds, the additional heat added to poultry houses can be estimated on a continuing basis. Several equations, such as the one of Sakomura (2004), have been fitted to determine the energy needs of laying hens (Fig. 5). The cost of providing heat from bird metabolism versus fossil and other fuels can be modeled to maximize profits. Such information can be used to alter feeds and to minimize bird heat production under heat stress conditions. The results from Sakomura (2004) and other experimental data indicate that there is no thermoneutral zone where ambient temperature does not affect growth or feed conversion efficiency (Davis et al.(1973): ‘There was a linear relationship between heat production and ambient temperature with no thermoneutral zone or critical temperature’, p. 173). In general, layers kept at warmer temperatures have better feed utilization efficiencies. Models of layer performance should balance the costs of feed energy with maintaining environmental temperatures to maximize profits.
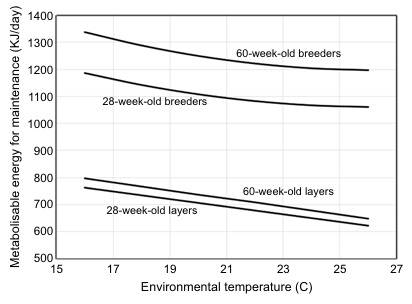
Fig. 5. The heat production of broiler breeders and laying hens kept at different environmental temperatures. Based on data from Sakomura (2004).
The same phenomena exist for broilers, but because bodyweight, bodyweight to surface area and rate of protein deposition change more quickly, and heat dissipation is subject to ventilation rates, the solution is much more complex. Again, data show that there is no thermoneutral zone. Hurwitz et al. (1980) showed maximum bodyweight gain for broilers at 19°C or lower, but feed conversion efficiency was maximized at 27°C. Modeling performance of broilers and layers should always include heat coming from the energetic effects of digestion and obligatory metabolism (Fig. 4) to maximize production efficiency. In general, broilers kept at cooler temperatures eat more feed and grow more quickly, whereas birds grown at warmer temperatures grow more slowly but have better feed utilization efficiencies. Models of broiler performance should balance the costs of feed energy with maintaining environmental temperatures to maximize profits.
Estimates of NEATP represent the potential energy that can be provided by feed ingredients. There remains the influence of anti-nutritional factors such as phytate and the arabinoxylans, their levels fed, and feed processing to be considered. When the ME of ingredients is determined, antinutritional factors and nutrient interactions present under the assay conditions influence the results. For instance, when meat meal is assayed for ME, its saturated fats may not be well absorbed, but in a mixed feed with corn oil from corn present, the saturated fats should be very well absorbed (Fig. 6; Ketels and De Groote 1989).
Assay conditions do not affect NEATP values. Factors that affect utilization by different animal species during assays and under production conditions need to be understood so they can be applied to animal feeds in practice. For instance, nitrogen ‘corrections’ to imply that all birds are in nitrogen balance are not correct nor helpful. Very few commercial birds are in nitrogen balance; most are not. Broiler chickens are not in nitrogen balance because they deposit protein into their carcasses. They have lower heat increments than old roosters near nitrogen balance. Correcting for the nitrogen balance for each bird and maximizing profitability through proper modeling should be the goal of meat production. Formulating least-cost feeds for broilers on the basis of ingredient energy values adjusted for some other nitrogen balance situation does not mean that this criterion is not productive.
In general, the oil from vegetable products is highly absorbed because of its high unsaturated fatty acid content, but the grease from animal products is less well absorbed due to its low content of unsaturated fatty acids. The energy value for formulation should be based on the unsaturated fat to saturated fat ratio in the final ration. The relationship is non-linear and is not easily or accurately solved by traditional least-cost, linear feed-formulation programs. By knowing the ATP-generating capabilities of the various fatty acids and triacylglycerols, and the final unsaturated fat to saturated fat ratio in the formulation solution, the NEATP can be estimated.
Similarly, when oilseed meal nutrients are studied at high proportions in test feeds, dietary fiber affects the absorption of the amino acids (Messad et al. 2016). In mixed feeds with lower concentrations of oilseed meal, the fiber concentration is lower, thus allowing more amino acids to be absorbed. Feed utilization efficiency (gain/feed intake) increases with feed processing, but it is important to determine which nutrients are affected. Nutritional interactions are important, and depend on whether ME, MEn, NE, PE, or NEATP is used. Interactions should be easier to model by using NEATP, because the starting point is the energy available from the finished feed, not what has already been discounted for nitrogen balance in the bird or when anti-nutritional factors are not present at the concentration of the finished feed.
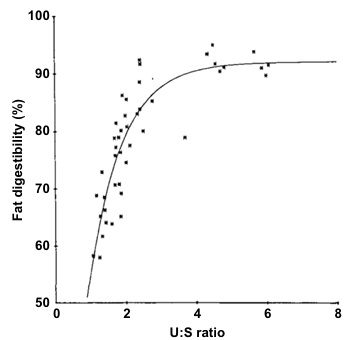
Fig. 6. Fat digestibility as a function of the unsaturated to saturated fatty acid ratio (from Ketels and De Groote 1989).
Conclusions
Classic metabolizable energy measurements have many problems (Mateos et al.2018; Pesti 2025a). Net energy systems based on ME systems ignore that the heat increment is available and useful to animals whenever they need to raise their body temperatures from ambient room temperature. Both the Armidale method for feed ingredient analysis and the NEATP system of estimating potential feed ingredient energy are still in the proposal stages, but offer considerable advances over current methodologies. To properly model sustainability of animal production, it will be necessary to include all sources of energy in animal houses, including the energetic effect of feed. It seems obvious that if precision feed formulation and modeling systems are to evolve, it will be best to change from the 19th to 21st century technologies as soon as possible. Birds kept in warmer environments have reduced feed intake and improved feed utilization efficiencies. Proper modeling of all sources of heat, including the HI or energetic effects of feed, need to be modeled to balance feed energy levels and environmental temperatures, to maximize broiler profitability. A similar situation exists for laying hens. If nutritionists want to formulate feeds with precision, they need to find out precisely what is in their ingredients.
This article was originally published in Animal Production Science 66, AN25373. https://doi.org/10.1071/AN25373. This is an Open Access article distributed under the Creative Commons Attribution Non Commercial - No Derivatives 4.0 International License (CC BY-NC-ND).
- Carpenter KJ, Harper AE, Olson RE (1997). Experiments that changed nutritional thinking. The Journal of Nutrition 127(5), 1017S–1053S. doi:10.1093/jn/127.5.1017S
- Choct M (2015). Feed non-starch polysaccharides for monogastric animals: classification and function. Animal Production Science 55(12), 1360–1366. doi:10.1071/AN15276
- Coles L, Rutherfurd S, Moughan P (2013). A model to predict the ATP equivalents of macronutrients absorbed from food. Food & Function 4(3), 432–442. doi:10.1039/C2FO30239J
- Davis RH, Hassan OEM, Sykes AH (1973). Energy utilization in the laying hen in relation to ambient temperature. Journal of Agricultural Science 81(1), 173–177. doi:10.1017/S0021859600058470
- Du Vigneaud V (1952). A trail of research. Cornell University Press, Ithaca, NY, USA.
- Emmans GC (1994). Effective energy: a concept of energy utilization applied across species. British Journal of Nutrition 71, 801–821. doi:10.1079/BJN19940188
- Fisher C (2015). An overview of poultry models. In: Nutritional Modelling for Pigs and Poultry. Eds. NK Sakomura, RM Gous, I Kyriazakis, L Hauschild. CABI, Wallingford and Boston, USA.
- Fisher C, Gous RM (1998). Evaluating a broiler growth model. Proceedings of the Australian Poultry Science Symposium 10, 1–11.
- Hurwitz S, Weiselberg M, Eisner U, Bartov I, Riesenfeld G, Sharvit M, Niv A, Bornstein S (1980). The energy requirements and performance of growing chickens and turkeys as affected by environmental temperature. Poultry Science 59(10), 2290–2299. doi:10.3382/ps.0592290
- Jansman AJM, Kwakernaak C, Van Der Klis JD, De Bree J, Fledderus J, Brandsma GG, Blok MC (2004). A net energy system for broilers [in Dutch]. ASG-report 04/5917.
- Ketels E, De Groote G (1989). Effect of ratio of unsaturated to saturated fatty acids of the dietary lipid fraction on utilization and metabolizable energy of added fats in young chicks. Poultry Science 68, 1506–1512. doi:10.3382/ps.0681506
- Kleiber M (1975). The fire of life: an introduction to animal energetics. 2nd ed. Robert Krieger Publishing, Huntington, NY, USA.
- Küçüktopcu E (2023). Comparative analysis of data-driven techniques to predict heating and cooling energy requirements of poultry buildings. Buildings 13, 142. doi:10.3390/buildings13010142
- Livesey G (1984). The energy equivalents of ATP and the energy values of food proteins and fats. British Journal of Nutrition 51(1), 15–28. doi:10.1079/BJN19840005
- Mateos GG, Sell JL (1980a). True and apparent metabolizable energy value of fat for laying hens: influence of level of use. Poultry Science 59(2), 369–373. doi:10.3382/ps.0590369
- Mateos GG, Sell JL (1980b). Influence of graded levels of fat on utilization of pure carbohydrate by the laying hen. The Journal of Nutrition 110(9), 1894–1903. doi:10.1093/jn/110.9.1894
- Mateos GG, Sell JL (1981). Nature of the extrametabolic effect of supplemental fat used in semipurified diets for laying hens. Poultry Science 60(8), 1925–1930. doi:10.3382/ps.0601925
- Mateos GG, Camara L, Fondevila G, Lazaro RP (2018). Critical review of the procedures used for estimation of the energy content of diets and ingredients in poultry. Journal of Applied Poultry Research 28(3), 506–525. doi:10.3382/japr/pfy025
- Messad F, Létourneau-Montminy MP, Charbonneau E, Sauvant D, Guay F (2016). Meta-analysis of the amino acid digestibility of oilseed meal in growing pigs. Animal 10(10), 1635–1644. doi:10.1017/S1751731116000732
- Moss A (2020). Database of the nutrient contents of Australian feed ingredients. AgriFutures Australia Publication No. 20-078.
- Moughan PJ (2018). An overview of energy and protein utilisation during growth in simple-stomached animals. Animal Production Science 58(4), 646–654. doi:10.1071/AN15791
- Olson RE (1998). Evolution of ideas about the nutritional value of dietary fat: introduction. The Journal of Nutrition 128(2), 421S–422S. doi:10.1093/jn/128.2.421S
- Oviedo-Rondón E (2015). Model applications in poultry production and nutrition. In: Nutritional Modelling for Pigs and Poultry. CABI, Wallingford, UK.
- Pesti GM (2024). A new analytical procedure to replace the outdated Weende proximal feed ingredient analysis paradigm is long overdue. Animal Production Science 64(15), AN24176. doi:10.1071/AN24176
- Pesti GM (2025a). Perspectives on methods for expressing energy values of poultry feed and energy requirements. 1. History and critique of the metabolizable energy paradigm. Animal Production Science 65(16), AN25293. doi:10.1071/AN25293
- Pesti GM (2025b). Perspectives on methods for expressing energy values of poultry feed and energy requirements. 2. A proposal for net energy based on ATP potential. Animal Production Science 65(16), AN25294. doi:10.1071/AN25294
- Pesti GM, Billard L (2024). The perils of scaling response variables: metabolic body size and its negative impact on statistical inference. Animal Science Cases. CABI.
- Pesti GM, Miller BR (1997). Modelling for precision nutrition. Journal of Applied Poultry Research 6, 483–494. doi:10.1093/japr/6.4.483
- Pesti GM, Choct M, Chrystal PV, Bedford MR, Moss AF (2024). Teaching the principles of least-cost poultry feed formulation utilizing the Solver function within a computer software workbook. Poultry Science 103(6), 103636. doi:10.1016/j.psj.2024.103636
- Sakomura NK (2004). Modeling energy utilization in broiler breeders, laying hens and broilers. Revista Brasileira de Ciência Avícola 6, 1–11. doi:10.1590/S1516-635X2004000100001
- Severe JH (2022). A brief and comprehensive history of the development and use of feed analysis: a review. Open Agriculture 7(1), 837–846. doi:10.1515/opag-2022-0141
- Van Der Klis JD, Jansman AJM (2019). Net energy in poultry: its merits and limits. Journal of Applied Poultry Research 28(3), 499–505. doi:10.3382/japr/pfy005
- Van Der Klis JD, Kwakernaak C, Jansman AJM, Blok MC (2010). Energy in poultry diets: adjusted AME or net energy. Proceedings of the Australian Poultry Science Symposium 22, 127–134.
- Wardeh MF (1981). Models for estimating energy and protein utilization for feeds. PhD Thesis, Utah State University, Logan, UT, USA.
- WPSA (1989). European Table of Energy Values for Poultry Feedstuffs. 3rd ed. Subcommittee of Energy of the Working Group No. 2 Nutrition, European Federation of Branches of the World's Poultry Science Association. Spelderholt Centre for Poultry Research, Beekbergen, The Netherlands.
- Zuidhof MJ (2019). A review of dietary metabolizable and net energy: uncoupling heat production and retained energy. Journal of Applied Poultry Research 28(2), 231–241. doi:10.3382/japr/pfx062.
Related topics:
Authors:


Influencers who recommended :
Luis Fernando Vergamini LunaRecommend
Comment
Share

22 de septiembre de 2026
Have a look at Doucet et al., British Journal of Nutrition (2010), 103, 1309–1318,
Recommend
Reply


8 de septiembre de 2026
Dear Kees! I fell sorry. The academia keeps fighting on methodology and the industry keeps waiting for something that is feasible to be used.
Recommend
Reply
5 de septiembre de 2026
Good to hear from Mamduh, my old running buddy.
Paul Cotter
Paul Cotter
Recommend
Reply
3 de septiembre de 2026
Yes, Dear Sifri. Fantastic time in our professional lives.
Recommend
Reply

3 de septiembre de 2026
Dear Gene, Antonio and other colleagues,
Thank you for the session and excellent discussions.
Gene,
I wish many of the young scientists see these communications to develop new research projects.
I miss the old days where you and Dr. Britton used to take the prominent front seats in the Informal Nutrition Symposium ready to hep straighten the misconceptions.
Best wishes,
Mamduh
Thank you for the session and excellent discussions.
Gene,
I wish many of the young scientists see these communications to develop new research projects.
I miss the old days where you and Dr. Britton used to take the prominent front seats in the Informal Nutrition Symposium ready to hep straighten the misconceptions.
Best wishes,
Mamduh
Recommend
Reply

2 de septiembre de 2026
As mentioned before in the FORUM the microbioma of the digestive tract varies with age of the animal so the use of starch for microbial growth and then with less availability to the animal, but with a change of properties as microbial protein. If you follow this pathway the changes are enormous and endless changes.
Recommend
Reply
2 de septiembre de 2026
Dear Gene, the equations from the works of Dr. Sakomura and her coworkers are fantastic. We have been using them, very much. However, the discussion always come from the energy values that we stablish to different ingredient sources, mainly corn. When we follow theoretical weekly energy consumption and relate it to the weight of the hens we can see if we are under or overestimating their energy values. But I know, this subject can go on and on, for ever. This is the reason that I say that nutrient and energy requirements of breeders are based on science data with a good amount of "state of art", too. Closer we are on average breeders body weight and their weight variability more precise we will be with our nutrition proposals.
Recommend
Reply

1 de septiembre de 2026
Dear Gene! This is an important gap on our formulation side. One calorie in broiler diets can cost from 0,08 to 0,18 US$ (more or less, depending the year and the country). But, I know that this issue it is not fixed due to the complexity of the "simple" starch composition and the post harvesting consequences that can happen when it is bad treated. I would be happy enough if we can have at least amylose and amylopectin analysis. That will help a lot on the efficient use of amylase. Sometimes, we formulate diets to breeders, to achieve an specific energy consumption (feed restricted) and the hens get fat or below the weight. My general assumption is that the energy of the diet (corn, main energy source) does not match with the energy assumption. Broilers can eat more or less to overcome differences (ad libitum feeding). But, with breeders, no. This is the reason that I always recommend (on breeders) checking weekly breeders body weight and energy consumption (protein and lysine, too). If the breeders are not gaining weight, we overestimated the real corn energy. If the breeders are gaining weight, we underestimated the real corn energy. And in this discussion we are not bringing the non starch polysaccharides (hahahaha.)
Recommend
Reply
31 de agosto de 2026
Is corn main sow for industrial starch, food, feed or ethanol? Then its different properties and yields, so its marketing price.
A few will chosse non GMO varieties to feed animals, other white corn for tortillas, and country imports could go by lower price withour any qualityies.
A few will chosse non GMO varieties to feed animals, other white corn for tortillas, and country imports could go by lower price withour any qualityies.
Recommend
Reply


Guanidinoacetic Acid (GAA): Technical Role and Nutritional Impact
Suggested link
31 de agosto de 2026
Dear Gene! Still, this is something that bothers me. Starch is a such complex molecule, with so many variants, even made just by glucose, that is not easy to fully consider its energy value. We need to find better ways to express the energy that comes from it.
Recommend
Reply

Would you like to discuss another topic? Create a new post to engage with experts in the community.













Featured users in Poultry Industry

Dr. Algis Martínez Cargill
DVM, Diplomado ACPV - Poultry Veterinarian North America Cargill
United States
United States
Shivaram Rao
Pilgrim´s
PhD Director Principal de Nutrición y Servicios Técnicos de Pilgrim’s Pride Corporation
United States
United States