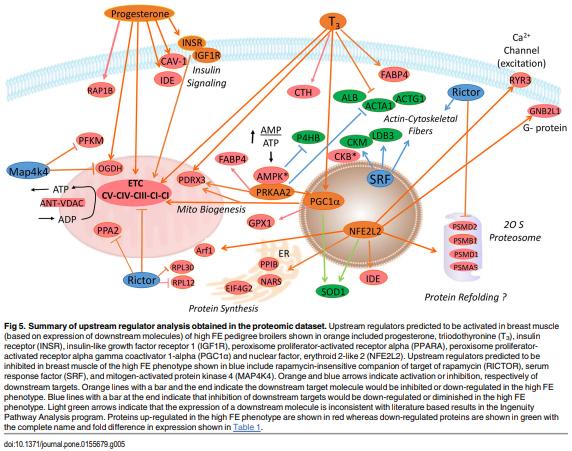
Proteomics of Breast Muscle Tissue Associated with the Phenotypic Expression of Feed Efficiency within a Pedigree Male Broiler Line: I. Highlight on Mitochondria
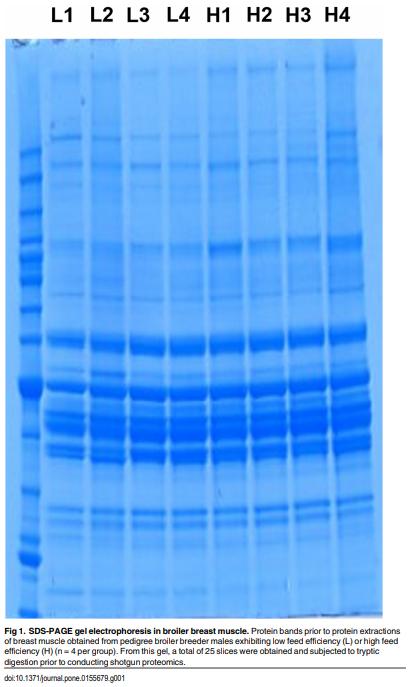
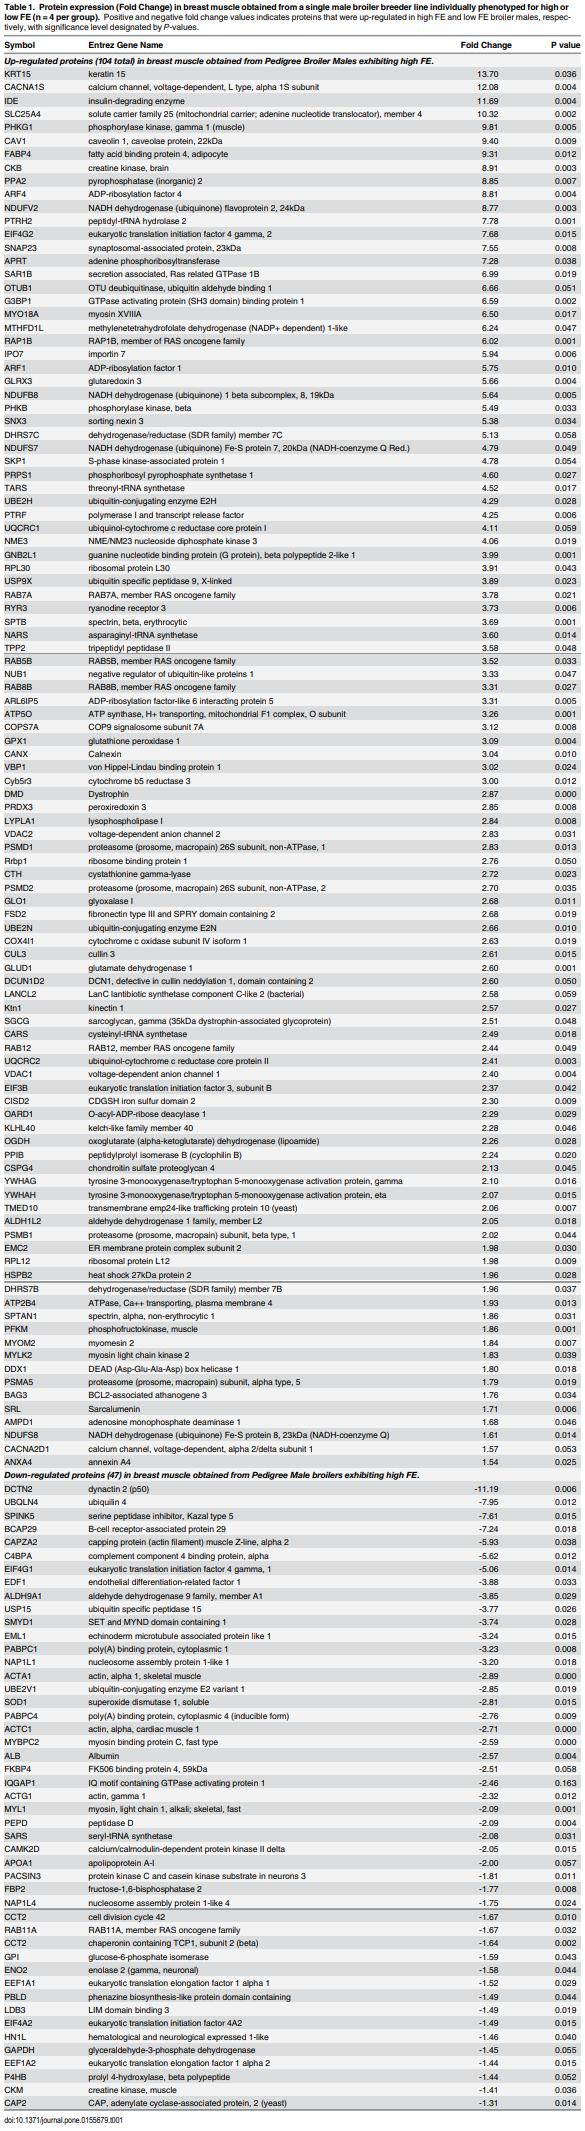
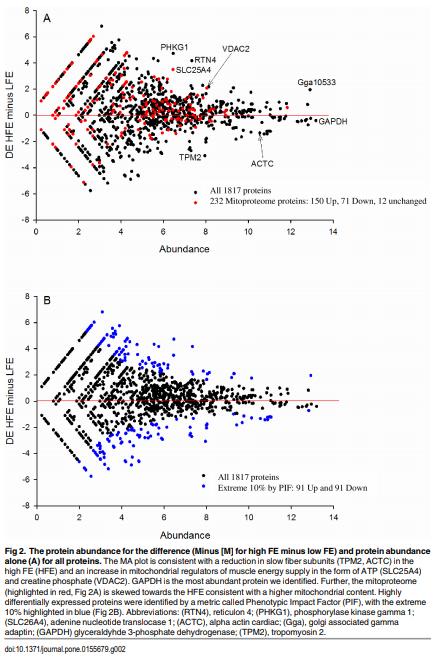
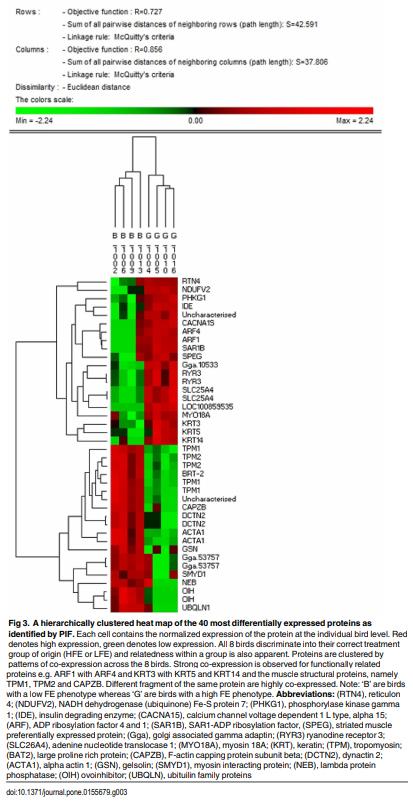
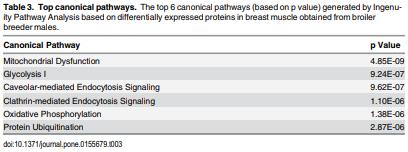
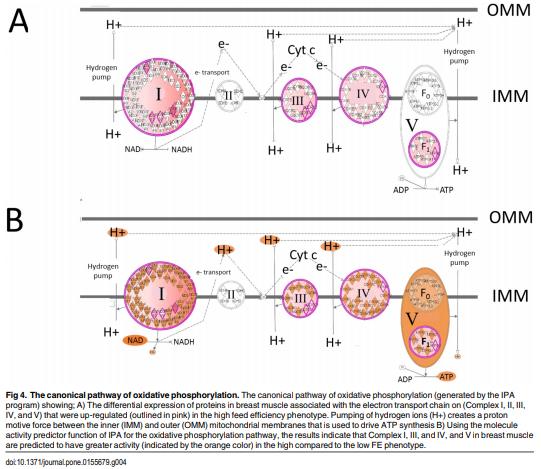
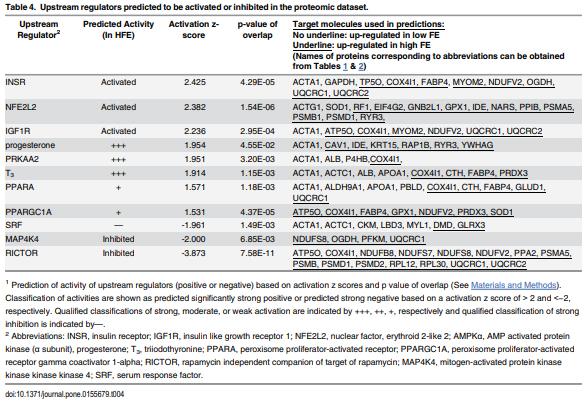
As feed represents 60 to 70% of the cost of raising an animal to market weight, feed efficiency (the amount of dry weight intake to amount of wet weight gain) remains an important genetic trait in animal agriculture. To gain greater understanding of cellular mechanisms of feed efficiency (FE), shotgun proteomics was conducted using in-gel trypsin digestion and tandem mass spectrometry on breast muscle samples obtained from pedigree male (PedM) broilers exhibiting high feed efficiency (FE) or low FE phenotypes (n = 4 per group). The high FE group had greater body weight gain (P = 0.004) but consumed the same amount of feed (P = 0.30) from 6 to 7 wk resulting in higher FE (P < 0.001). Over 1800 proteins were identified, of which 152 were different (P < 0.05) by at least 1.3 fold and ≤15 fold between the high and low FE phenotypes. Data were analyzed for a modified differential expression (DE) metric (Phenotypic Impact Factors or PIF) and interpretation of protein expression data facilitated using the Ingenuity Pathway Analysis (IPA) program. In the entire data set, 228 mitochondrial proteins were identified whose collective expression indicates a higher mitochondrial expression in the high FE phenotype (binomial probability P < 0.00001). Within the top up and down 5% PIF molecules in the dataset, there were 15 mitoproteome proteins up-regulated and only 5 down-regulated in the high FE phenotype. Pathway enrichment analysis also identified mitochondrial dysfunction and oxidative phosphorylation as the number 1 and 5 differentially expressed canonical pathways (upregulated in high FE) in the proteomic dataset. Upstream analysis (based on DE of downstream molecules) predicted that insulin receptor, insulin like growth receptor 1, nuclear factor, erythroid 2-like 2, AMP activated protein kinase (α subunit), progesterone and triiodothyronine would be activated in the high FE phenotype whereas rapamycin independent companion of target of rapamycin, mitogen activated protein kinase 4, and serum response factor would be inhibited in the high FE phenotype. The results provide additional insight into the fundamental molecular landscape of feed efficiency in breast muscle of broilers as well as further support for a role of mitochondria in the phenotypic expression of FE.
Funding provided by USDA-NIFA (#2013–01953), Arkansas Biosciences Institute (Little Rock, AR), McMaster Fellowship (AUS to WB) and the Agricultural Experiment Station (Univ. of Arkansas, Fayetteville).
1. Simmons J. (2010) Technology’s role in the 21st century—Elanco Animal Health. Why agriculture needs technology to help meet a growing demand for safe; nutritious and affordable food.
2. Nixon R, Lowry A. (2012) Drought forces reductions in U.S. crop forecasts. New York Times Business. Available: http://www.nytimes.com/2012/08/11/business/projections-for-corn-yield-falls-to-17-yearlow.html.
3. Lee J, Karnuah AB, Rekaya R, Anthony NA, Aggrey SE (2015) Transcriptomic analysis to elucidate the molecular mechanisms that underlie feed efficiency in meat-type chickens. Molecular Genetics and Genomics doi: 10.1007/s00438-015-1025-7
4. Zhou N, Lee WR, Abasht B (2015) Messenger RNA sequencing and pathway analysis provide novel insights into the biological basis of chickens' feed efficiency. BMC Genomics 16: 195–215. doi: 10. 1186/s12864-015-1364-0 PMID: 25886891
5. Kong B, Song J, Lee JY, Hargis BM, Wing T, Lassiter K et al. (2011) Gene expression in breast muscle associated feed efficiency in a single male broiler line using a chicken 44k microarray. I. top differentially expressed genes. Poultry Science 90: 2535–2547. doi: 10.3382/ps.2011-01435 PMID: 22010239
6. Bottje WG, Kong BW, Song JJ, Lee JY, Hargis BM, Lassiter K et al. (2012) Gene expression in breast muscle associated feed efficiency in a single male broiler line using a chicken 44k microarray II. Differentially expressed focus genes. Poultry Science 91: 2576–25887. PMID: 22991544
7. Bottje W, Kong BW (2013) Feed efficiency: Mitochondrial function to global gene expression. Journal of Animal Science 91: 1582–1593. doi: 10.2527/jas.2012-5787 PMID: 23148240
8. Bottje WG, Iqbal M, Tang Z, Cawthon DC, Okimoto R, Wing T, et al. (2002) Association of mitochondrial function with feed efficiency within a single genetic line of male broilers. Poultry Science 81: 546–555. PMID: 11989755
9. Ojano-Dirain C, Bottje W, Wing T, Cooper M (2005) Glutathione and respiratory chain complex activities in duodenal mitochondria from broilers with low and high feed efficiency. Poultry Science 84: 782–788. PMID: 15913191
10. Bottje W, Carstens GE (2009) Association of mitochondrial function and feed efficiency in poultry and livestock species. Journal of Animal Science 87: E48–E63. doi: 10.2527/jas.2008-1379 PMID: 19028862
11. Taniguchi Y, Choi PJ, Li GW, Chen H, Babu M, Hearm J, et al. (2010) Quantifying E. coli proteome and transcriptome with single-molecule sensitivity in single cells. Science 329: 533–538. doi: 10. 1126/science.1188308 PMID: 20671182
12. Greenbaum D, Colangelo C, Williams K, Gerstein M (2003) Comparing protein abundance and mRNA expression levels on a genomic scale. Genome Biology 4: 117. PMID: 12952525
13. Pascal LE, True LD, Campbell DS, Deutsch EW, Risk M, Colman IM, et al. (2008) Correlation of mRNA and protein levels: Cell type-specific gene expression of cluster designation antigens in the prostate. BMC Genomics 9: 246. doi: 10.1186/1471-2164-9-246 PMID: 18501003
14. Guo Y, Xiao P, Lei S, Deng F, Xiao GG, Liu Y, et al. (2008) How is mRNA expression predictive for protein expression? A correlation study on human circulating monocytes. Acta Biochimica Biophysica Sin (Shanghai) 40: 426–436.
15. Nie L, Wu G, Zhang W (2006) Correlation of mRNA expression and protein abundance affected by multiple sequence features related to translational efficiency in desulfovibrio vulgaris: A quantitative analysis. Genetics 174: 2229–2243. PMID: 17028312
16. Zanetti E, Molette C, Chambon C, Pinguet J, Remignon H, Cassandro M (2011) Using 2-DE for the differentiation of local chicken breeds. Proteomics 2613: 2613–2619.
17. Sokale A, Peebles ED, Zhai W, Pendarvis K, Burgess S, Perchan T (2011) Proteome profile of the pipping muscle in broiler embryos. Proteomics 11: 4262–4265. doi: 10.1002/pmic.201000795 PMID: 21834139
18. Kaweewong K, Garnjanagoonchorn W, Jirapakkul W, Roytrakul S (2013) Solubilization and identification of hen eggshell membrane proteins during different times of chicken embryo development using the proteomic approach. Protein Journal 32: 297–308. doi: 10.1007/s10930-013-9487-0 PMID: 23636516
19. Liu Y, Qiu N, Ma M (2013) Comparative proteomic analysis of hen egg white proteins during early phase of embryonic development by combinatorial peptide ligand library and matrix-assisted laser desorption ionization-time of flight. Poultry Science 92: 1897–1904. doi: 10.3382/ps.2012-02986 PMID: 23776278
20. Sun C, Xu G, Yang N (2013) Differential label-free quantitative proteomic analysis of avian eggshell matrix and uterine fluid proteins associated with eggshell mechanical property. Proteomics 13: 3523– 3536. doi: 10.1002/pmic.201300286 PMID: 24151251
21. Mu P, Xu M, Zhang L, Wu K, Wu J, Chen O (2013) Proteomic changes in chicken primary hepatocytes exposed to T-2 toxin are associated with oxidative stress and mitochondrial enhancement. Proteomics 13: 3175–3188. doi: 10.1002/pmic.201300015 PMID: 24030954
22. Chien KY, Blackburn K, Liu HC, Goshe MB (2012) Proteomic and phosphoproteomic analysis of chicken embryo fibroblasts infected with cell culture-attenuated and vaccine strains of Marek's disease virus. Journal of Proteome Research 11: 5663–5677. doi: 10.1021/pr300471y PMID: 23106611
23. Fan Z, Hu X, Zhang Y, Yu C, Qian K, et al. (2012) Proteomics of DF-1 cells infected with avian leukosis virus subgroup. Journal of Virus Research 167: 314–321. doi: 10.1016/j.virusres.2012.05.016 PMID: 22664373
24. Haq K, Brisbin JT, Thanthrige-Don N, Heidari M, Sharif S (2010) Transcriptome and proteome profiling of host responses to Marek's disease virus in chickens. Veterinary Immunology and Immunopathology 138: 292–302. doi: 10.1016/j.vetimm.2010.10.007 PMID: 21067815
25. Hu X, Qin A, Qian K, Shao H, Yu C, Mio J (2012) Analysis of protein expression profiles in the thymus of chickens infected with Marek's disease virus. Virology Journal 9: 256. doi: 10.1186/1743-422X-9- 256 PMID: 23116199
26. Wu Y, Peng C, Xu L, Zheng X, Liao M, Jin Y (2012) Proteome dynamics in primary target organ of infectious bursal disease virus. Proteomics 12: 1844–1859. doi: 10.1002/pmic.201100479 PMID: 22623289
27. Picard B, Berri C, Lefaucheur L, Molette C, Sayd T, Terlouw C (2010) Skeletal muscle proteomics in livestock production. Brief Functional Genomics 9: 259–278.
28. Rabilloud T, Chevallet M, Luche S, Lelong C. (2010) Two-dimensional gel electrophoresis in proteomics: Past, present and future. Journal of Proteomics 73: 2064–2077. doi: 10.1016/j.jprot.2010.05. 016 PMID: 20685252
29. Mann M, Kulak NA, Nagaraj N, Cox J. (2013) The coming age of complete, accurate, and ubiquitous proteomes. Molecular Cell 49: 583–590. doi: 10.1016/j.molcel.2013.01.029 PMID: 23438854
30. Altelaar AF, Munoz J, Heck AJ. (2013) Next-generation proteomics: Towards an integrative view of proteome dynamics. Nat Rev Genet 14: 35–48. doi: 10.1038/nrg3356 PMID: 23207911
31. Iqbal M, Pumford NR, Tang Z, Lassiter K, Wing T, Cooper M, et al. (2004) Low feed efficient broilers within a single genetic line exhibit higher oxidative stress and protein expression in breast muscle with lower mitochondrial complex activity. Poultry Science 83: 474–484. PMID: 15049502
32. Hudson NJ, Reverter A, Dalrymple BP (2009) A differential wiring analysis of expression data correctly identifies the gene containing the causal mutation. PLoS Computational Biology 5: 1–15.
33. Eden E, Navon R, Steinfeld I, Lipson D, Yakhini Z (2009) GOrilla: A tool for discovery and visualization of enriched GO terms in ranked gene lists. BMC Bioinformatics 10: 1471–2105.
34. Caraux G, Pinloche S (2005) PermutMatrix: A graphical environment to arrange gene expression profiles in optimal linear order. Bioinformatics 21: 1280–1281. PMID: 15546938
35. Smyth GK. (2004) Linear models and empirical Bayes methods for assessing differential expression in microarray experiments. Statistics of Applied Genetics and Molecular Biology 3: 1–24.
36. Vincent A, Louveau I, Gondret G, Trefeu C, Gilbert H, Lefaucheur L (2015) Divergent selection for residual feed intake affects the transcriptomic and proteomic profiles of pig skeletal muscle. Journal of Animal Science 93: 2745–2758. doi: 10.2527/jas.2015-8928 PMID: 26115262
37. Kiessling KH (1977) Muscle structure and function in the goose, quail, pheasant, guinea hen, and chicken. Comparative Biochemistry and Physiology B 57: 287–292.
38. Kim H, You S, Kim I-J, Farris J, Foster LK, Foster DN (2001) Increased mitochondrial gene transcription in immortal DF-1 cells. Experimental Cellular Research 265: 339–347.
39. Sharifabadi HR, Zamir MJ, Rowghani E, Bottje WG (2012) Relationship between the activity of mitochondrial respiratory chain complexes and feed efficiency in fat-tailed ghezel lambs. Journal of Animal Science 90: 1807–1815. doi: 10.2527/jas.2011-4791 PMID: 22147474
40. Lemasters JJ, Holmuhamedov E (2006) Voltage-dependent anion channel (VDAC) as mitochondrial governator—thinking outside the box. Biochemica Biophysica Acta 1762: 181–190.
41. Galganska J, Karachitos A, Wojtkowska M, Stoienia O, Budzinska M, Kimta H (2010) Communication between mitochondria and nucleus: Putative role for VDAC in reduction/oxidation mechanism. Biochemica Biophysica Acta 1797: 1276–1280.
42. Han D, Antunes F, Canali R, Retton D, Cadenas E (2003) Voltage-dependent anion channels control the release of the superoxide anion from mitochondria to cytosol. Journal of Biological Chemistry 278: 5557–5563. PMID: 12482755
43. Schlattner U, Tokarska-Schlattner M, Wallimann T (2006) Mitochondrial creatinine kinase in health and disease. Biochemica Biophysica Acta 1762: 164–180.
44. Walliman T, Wyss SM, Brdiczka D, Nicolay K, Eppenberger HM (1992) Intracellular compartmentation, structure and function of creatine kinase isoenzymes in tissues with high and fluctuating energy demands: The 'phosphocreatine circuit' for cellular energy homeostasis. Biochemistry Journal 281: 21–40.
45. Quest AFG, Eppenberger HM, Walliman T (1990) Volume 262, number 2, 299–304 FEBS 08264 march 1990 two different B-type creatine kinase subunits dimerize in a tissue-specific. FEBS Letters 262: 299–204.
46. Watabe S, Hiro T, Yamamoto Y, Fugioka Y, Hasegawa H, Yago N (1997) SP-22 is a thioredoxindependent peroxide reductase in mitochondria. European Journal of Biochemistry 249: 52–60. PMID: 9363753
47. Chang T, Cho C, Park C, Yu S, Kang SW, Rhee SG (2004) Peroxiredoxin III, a mitochondrion-specific peroxidase, regulates apoptotic signaling by mitochondria. Journal of Biological Chemistry 279: 41975–41984. PMID: 15280382
48. Noh YH, Baek JY, Jeong W, Rhee SG, Chang T (2009) Sulfiredoxin translocation into mitochondria plays a crucial role in reducing peroxidized peroxiredoxin III. Journal of Biological Chemistry 284: 8470–8477. doi: 10.1074/jbc.M808981200 PMID: 19176523
49. Wonsey DR, Zeller KI, Dang CV (2002) The c-myc target gene PRDX3 is required for mitochondrial homeostasis and neoplastic transformation. Proceedings of the National Academy of Science (USA) 99: 6649–6654.
50. Jing L, Hou Y, Miao Y, Li X, Cao J, Brameld JM et al. (2015) Transcriptome analysis of mRNA and miRNA in skeletal muscle indicates an important network for differential residual feed intake in pigs. Scientific Reports 5:11953: doi: 10.1038/srep11953 PMID: 26150313
51. Nisoli E, Clementi E, Paolucci C, Cozzi V, Tonello C, Sciorati C, et al. (2003) Mitochondrial biogenesis in mammals: The role of endogenous nitric oxide. Science 299: 896–899. PMID: 12574632
52. Nisoli E, Clementi E, Moncada S, Carruba MO (2004) Mitochondrial biogenesis as a cellular signaling framework. Biochemical Pharmacology 67: 1–15. PMID: 14667924
53. Irrcher I, Adhihetty PJ, Sheehan T, Joseph A, Hood DA (2003) PPARγ coactivator-1α expression during thyroid hormone- and contractile activity-induced mitochondrial adaptations. American Journal of Physiology Cell Physiology 284: C1669–C1677. PMID: 12734114
54. Zhou G, Myers R., Li Y., Chen Y., Shen X., Fenyk-Melody J, et al. (2001) Role of AMP-activated protein kinase in mechanism of metformin action. Journal of Clinical Investigation 108: 1167–1174. PMID: 11602624
55. Hardie DG, Scott JW, Pan DA, Hudson ER (2003) Management of cellular energy by the AMP-activated protein kinase system. FEBS Letters 546: 113–120. PMID: 12829246
56. Hardie DG (2005) New roles for the LKB1-AMPK pathway. Current Opinions in Cell Biology 17: 167– 173.
57. Carling D (2004) The AMP-activated protein kinase cascade—A unifying system for energy control. Trends in Biochemical Science 29: 18–24.
58. Psarra AG, Sekeris CE (2008) Steroid and thyroid hormone receptors in mitochondria. Life 60: 210– 223. doi: 10.1002/iub.37 PMID: 18344181
59. Dupont J, Rideau N, Simon J (2015) Endocrine pancreas. In: Scanes CG, editor. Sturkie's Avian Physiology ( 6 edition). New York: Elsevier. pp. 613–631.
60. Eldar-Finkelman H, Schreyer SA, Shinohara MM, Leboeuf RC, Krebs EG (1999) Increased glycogen synthase kinase-3 activity in diabetes- and obesity-prone C57BL/6J mice. Diabetes 48: 1662–1666. PMID: 10426388
61. White MF (2002) IRS proteins and the common path to diabetes. American Journal of Physiology Endocrinology and Metabolism 283: E413–E422. PMID: 12169433
62. Baumann CA, Brady MJ, Saltiel AR (2001) Activation of glycogen synthase by insulin in 3T3-L1 adipocytes involves c-cbl-associating protein (CAP)-dependent and CAP-independent signaling pathways. Journal of Biological Chemistry 276: 6065–6068. PMID: 11222622
63. Baumann CA, Ribon C, Kanzaki M, Thurmond DC, Mora S, Bickle PE, et al. (2000) CAP defines a second signaling pathway required for insulin-stimulated glucose transport. Nature 407: 202–207. PMID: 11001060
64. Khan AH, Pessin JE (2002) Insulin regulation of glucose uptake: A complex interplay of intracellular signaling pathways. Diabetologia 45: 1475–1483. PMID: 12436329
65. Cohen AW, Combs TP, Scherer PE, Lisanti MP (2003) Role of caveolin and caveolae in insulin signaling and diabetes. American Journal of Physiology Endocrinology and Metabolism 285: E1151– E1160. PMID: 14607781
66. Tokushima R, Takahaski K, Sato K, Akiba Y (2005) Glucose uptake in vivo in skeletal muscles of insulin-injected chicks. Comparative Biochemistry and Physiology B 141: 43–48.
67. Kono T, Nishida M, Nishiki Y, Seki Y, Sato K, Akiba Y (2005) Characterization of glucose transporter (GLUT) gene expression in broiler chickens. British Poultry Science 46: 510–516. PMID: 16268111
68. Zhao JP, Bao J, Wang XJ, Jiano HC, Song ZG, Lin J (2012) Altered gene and protein expression of glucose transporter 1 underlies dexamethazone inhibition of insulin-stimulated glucose uptake in chicken muscles. Journal of Animal Science 90: 4337–4345. doi: 10.2527/jas.2012-5100 PMID: 22859751
69. Schiaffino S, Mammucari C (2011) Regulation of skeletal muscle growth by the IGF1-Akt/PKB pathway: Insights from genetic models. Skeletal Muscle 1: 1–4.
70. Fuentes EN, Björnsson BT, Valdés JA, Einarsdottir IE, Lorca B, Alvarez M (2011) IGF-I/PI3K/Akt and IGF-I/MAPK/ERK pathways in vivo in skeletal muscle are regulated by nutrition and contribute to somatic growth in the fine flounder. (2011) American Journal of Physiology Regulation and Integration of Comparative Physiology 300: R1532–R1542.
71. Duclos MJ (2005) Insulin-like growth factor-I (IGF-1) mRNA levels and chicken muscle growth. J of Physiology and Pharmacology 56 (Suppl 3): 25–35.
72. Chen Y, Gondro C, Quinn K, Herd RM, Parnell PF, Vaneslow B (2011) Global gene expression profiling reveals genes expressed differentially in cattle with high and low residual feed intake. Animal Genetics 42: 475–490. doi: 10.1111/j.1365-2052.2011.02182.x PMID: 21906099
73. Bottje WG, Kong B, Lee JY, Washington T, Baum JI, Dridi S, et al. (2014) Potential roles of mTOR and protein degradation pathways in the phenotypic expression of feed efficiency in broilers. Journal of Biochemical Physiology 3: 1–8.
74. Davis ME, Wick MP, Maquivar MG (2012) Hormonal regulation of feed efficiency. In: Hill R, editor. Feed efficiency in the beef industry. Ames, Iowa: Wiley-Blackwell. pp. 175–198.
75. Krebs EG, Eggleston LV (1938) The effect of insulin on oxidations in isolated muscle tissue. Biochemical Journal 32: 913–925. PMID: 16746703
76. Shorr E, Barker SB (1939) In vitro action of insulin on minced avian and mammalian muscle. Biochemical Journal 33: 1798–1809. PMID: 16747098
77. Hall JC, Sordahl LA, Stepko PL (1960) The effect of insulin on oxidative phosphorylation in normal and diabetic mitochondria. Journal of Biological Chemistry 235: 1536–1539. PMID: 14399044
78. Cheng Z, Tseng Y, White MF (2010) Insulin signaling meets mitochondria in metabolism. Trends in Endocrinology Metabolism 21: 589–598. doi: 10.1016/j.tem.2010.06.005 PMID: 20638297
79. Piekarski A (2015) Autophagy and its potential role in stress and feed efficiency in avian tissues. Ph. D. Dissertation, University of Arkansas, Fayetteville.
80. Fawcett J (2014) Biologically active insulin-derived peptides. Protein and Peptide Letters 21: 584– 588. PMID: 24559166
81. Smith OL, Wong CY, Gelfand RA (1989) Skeletal muscle proteolysis in rats with acute streptozocininduced diabetes. Diabetes 38: 1117–1122. PMID: 2670642
82. Price SR, Bailey JL, Wang X, Jurkovitz C, England BK, Ding X, et al. (1996) Muscle wasting in insulinopenic rats results from activation of the ATP-dependent, ubiquitin-proteasome proteolytic pathway by a mechanism including gene transcription. Clin Invest 98: 1703–1708.
83. Merforth S, Osmers A, Dahlmann B (1999) Alterations of proteasome activities in skeletal muscle tissue of diabetic rats. Molecular Biology of Reproduction 26 83–87.
84. Galban VD, Evangelista EA, Migliorini RH, do Carmo Kettelhut I (2001) Role of ubiquitin–proteasomedependent proteolytic process in degradation of muscle protein from diabetic rabbits. Molecular and Cellular Biochemistry 225: 35–41. PMID: 11716362
85. Tundo GR, Sbardella D, Ciacio C, Bianculli A, Orlandi A, Desimio MG, et al. (2013) Insulin-degrading enzyme (IDE): A novel heat shock-like protein. Journal of Biological Chemistry 288: 2281–2289. doi: 10.1074/jbc.M112.393108 PMID: 23188819
86. Leissring MA, Farris W, Wu X, Christodoulou DC, Haigis MC, Guarente L, et al. (2004) Alternative translation initiation generates a novel isoform of insulin-degrading enzyme targeted to mitochondria. Biochemical Journal 383: 439–446. PMID: 15285718
87. Kobayashi A, Kang M, Okawa H, Ohtsuji M, Zenke Y, Chiba T, et al. (2004) Oxidative stress sensor Keap1 functions as an adaptor for Cul3-based E3 ligase to regulate proteosomal degradation of Nrf2. Molecular and Cellular Biology 24(16): 7130–7139. PMID: 15282312
88. Kobayashi A, Kang M, Watai Y, Tong KI, Shibata T, Koli U, et al. (2006) Oxidative and electrophilic stresses activate Nrf2 through inhibition of ubiquitination activity of Keap1. Molecular and Cellular Biology 26: 221–229. PMID: 16354693
89. Ackema KB, Hench J, Böckler S, Wang SC, Sauder S, Mergantaler H, et al. (2014) The small GTPase Arf1 modulates mitochondrial morphology and function. EMBO Journal 33: 2659–2675. doi: 10. 15252/embj.201489039 PMID: 25190516
90. Rabouille C (2014) Old dog, new tricks: Arf1 required for mitochondria homeostasis. EMBO Journal 33: 2604–2605. doi: 10.15252/embj.201489899 PMID: 25230932
91. Nakai W, Kondo Y, Saitoh A, Naito T, Nakayama K, Shin HW (2013) ARF1 and ARF4 regulate recycling endosomal morphology and retrograde transport from endosomes to the golgi apparatus. Molecular and Cellular Biology 16: 2570–2581.
92. Preston RL (1999) Hormone containing growth promoting implants in farmed livestock. Advances in Drug Delivery Review 38: 123–138.
93. Johnson BJ, Hathaway MR, Anderson PT, Meiske JC, Dayton WR (1996) Stimulation of circulating insulin-like growth of feedlot steers due to administration of a combined trenbolone acetate and estradiol implant in feedlot cattle. Journal of Animal Science 74: 372–379. PMID: 8690673
94. Johnson BJ, White ME, Hathaway MR, Christians CJ (1998) Effect of a combined trenbolone acetate and estradiol (E) and recombinant bovine somatotropin (bST) 2 estradiol implant on steady-state IGFI mRNA concerning the anabolic response of feedlot steers. Journal of Animal Science 76: 491–497. PMID: 9498357
95. Thompson SH, Boxhorn LK, Allen RE (1989) Trenbolone alters the responsiveness of skeletal muscle trenbolone acetate to fibroblast growth factor and insulin-like growth factor 1. Endocrinology 124: 2110–2117. PMID: 2707149
96. Clement K, Viguerie N, Diehn M, Alizadeh PB, Thalamas C, Storey JD, et al. (2002) In vivo regulation of human skeletal muscle gene expression by thyroid hormone. Genome Research 12: 281–291. PMID: 11827947
97. Enriquez JA, Fernandez P, Garrido-Perez N, Lopez-Perez MJ, Perez-Martos A, Montova J (1999) Direct regulation of mitochondrial RNA synthesis by thyroid hormone. Molecular and Cellular Biology 19: 657–670. PMID: 9858589
98. Stipanuk MH (2004) Sulphur amino acid metabolism: Pathways for production and removal of homocysteine and cysteine. Annual Review of Nutrition 24: 539–577. PMID: 15189131
99. Jacinto E, Loewith A, Schmidt A, Lin S, Ruegg MA, Hall A, et al. (2004) Mammalian TOR complex 2 controls the actin cytoskeleton and is rapamycin insensitive. Nature Cell Biology 6: 1122–1128. PMID: 15467718
100. Sarbassov DD, Ali SM, Kim DH, Guertin DA, Latek RR, Erdoiment-Bromage H, et al. (2004) Rictor, a novel binding partner of mTOR, defines a rapamycin-insensitive and raptor-independent pathway that regulates the cytoskeleton. Current Biology 14: 1296–1302. PMID: 15268862
101. Sen B, Xie Z, Case N, Thompson WR, Uzer G, Styner M, et al. (2014) mTORC2 regulates mechanically induced cytoskeletal reorganization and lineage selection in marrow derived mesenchymal stem cells. Journal of Bone and Mineral Research 29: 78–89. doi: 10.1002/jbmr.2031 PMID: 23821483
102. Bentzinger CF, Romanino K, Cloetta D, Lin S, Mascarenhjas JB, Oliveri F, et al. (2008) Skeletal muscle-specific ablation of raptor, but not rictor, causes metabolic changes and results in muscle dystrophy. Cell Metabolism 8: 411–424. doi: 10.1016/j.cmet.2008.10.002 PMID: 19046572
103. Kim YB, Peroni OD, Minokoshi Y, Aschenbach WG, Minokoshi Y, Kotani A, et al. (2005) Muscle-specific deletion of Glut4 glucose transporter alters multiple regulatory steps in glycogen metabolism. Molecular and Cellular Biology 25: 9713–9723. PMID: 16227617
104. Kumar A, Harris TE, Keller SR, Choi KM, Magnuson MA, Lawrence JC (2008) Muscle-specific deletion of rictor impairs insulin-stimulated glucose transport and enhances basal glycogen synthase activity. Molecular and Cellular Biology 28: 61–70. PMID: 17967879
105. Guntur KVP, Guilherme A, Chawla A, Czech MP (2010) Map4k4 negatively regulates peroxisome proliferator-activated receptor (PPAR) gamma protein translation by suppressing the mammalian target of rapamycin (mTOR) signaling pathway in cultured adipocytes. Journal of Biological Chemistry 285: 6595–6603. doi: 10.1074/jbc.M109.068502 PMID: 20038583
106. Wang M, Amano SU, Flach RJR, Chawla A, Aouadi M, Czech MP (2013) Identification of Map4K4 as a novel suppressor of skeletal muscle differentiation. Molecular and Cellular Biology 33: 678–687. doi: 10.1128/MCB.00618-12 PMID: 23207904
107. Gineitis D, Treisman R (2001) Differential usage of signal transduction pathways define two types of serum response factor target gene. Journal of Biological Chemistry 276: 24531–24539. PMID: 11342553
108. Boxer LM, Prywes R, Roeder RG, Kedes L (1989) The sarcomeric actin CArG-binding factor is indistinguishable from the c-fos serum response factor. Molecular and Cellular Biology 9: 515–522. PMID: 2710114
109. Lee TC, Chow KL, Fang P, Schwartz RJ (1991) Activation of skeletal actin gene transcription: The cooperative formation of serum response factor-binding complexes over positive cis-acting promoter serum response elements displaces a negative-acting nuclear factor enriched in replicating myoblasts and nonmyogenic cells. Molecular Biology of the Cell 11: 5090–5100.
110. Minty A, Kedes L (1986) Upstream regions of the human cardiac actin gene that modulate its transcription in muscle cells: Presence of an evolutionarily conserved repeated motif. Molecular and Cellular Biology 6: 2125–2136. PMID: 3785189
111. Miano JM, Long X, Fujiwara K (2007) Serum response factor: Master regulator of the actin cytoskeleton and contractile apparatus. American Journal of Physiology Cell Physiology 292: C70–C81. PMID: 16928770

")


E.S.E. & INTEC
")