Introduction
The poultry industry aims to optimize the breast weight of the broilers because of its relatively higher market value. Through the years, improvements in breast meat yield have not only led to myopathies (Caldas-Cueva et al., 2021) but also to increased heat production (Martinez et al., 2019) due to the higher body protein content and turnover rates (Maharjan et al., 2020a; 2021b) in modern broilers. These conditions influence the feeding cost and the development of nutritional and management interventions (Maharjan et al., 2021c).
The cost-effectiveness of strategies to optimize breast production and their optimum timing (Martinez and Uculmana, 2016; Quisirumbay-Gaibor et al., 2019; Maharjan et al., 2021a) rely on the relationship between feed efficiency, body composition, and processing weights, and their dynamics across the grow-out period. However, tracking the growth of the breast and cut-up pieces with precision is not a simple task. In addition, large enough samples are required to obtain reliable values (Wamsley and Moritz, 2014). In this context, predicting the carcass and cut-up weights of broilers would allow longitudinal non-destructive studies with high precision and fewer birds involved.
A companion paper (Martinez et al., 2022b) reported the development of models to predict the processing weights of broilers using Dual-Energy X-ray Absorptiometry (DEXA) and correction coefficients determined in the very first (Martinez et al., 2022a) of this set of articles. They were developed by DEXA-scanning non-fasted feathered birds to be used in longitudinal studies (Salas et al., 2012) and to track the dynamics of performance, body composition, and processing weights in the same bird. These models have been shown to predict the weights of unchilled and chilled carcasses and cut-up pieces with high precision (R2 > 0.99) and low error (RMSE).
A robust validation process ensures that predictive models are reliable (Harrell, 2015). A common approach is to perform an internal procedure, randomly splitting the data into two sets for development and validation. This approach allows verifying if a model is not overfitted (Martinez et al., 2022b), determining its predictive ability, and estimating its predictive error, validating it in the test dataset (Harrell, 2015). However, it reduces the sample size for both development and validation and the accuracy and precision of the model estimates (Martinez et al., 2022b). In contrast, testing a model externally by using data not available when the model was developed, not only is considered the most rigorous approach (Harrell, 2015) but also has shown to detect high prediction errors in models considered accurate at development (Inca et al., 2022), even though the predictor and response variables were correlated (Inca et al., 2020). Therefore, the objective of this study was to externally validate at a commercial age the models to predict the processing weights of broilers reported by Martinez et al. (2022b).
Material and methods
Predictive models
A set of 14 models previously developed (Table 1; Martinez et al., 2022b) to predict the unchilled and chilled weights of the carcass (CAR), breast fillet (BRE; Pectoralis major), tenders (TEN; P. minor), total white meat (TWM; BRE + TEN), leg quarters (LQU), wings (WIN), and ready-to-cook parts (RCPs; RCP = TWM + LQU + WIN; Maharjan et al., 2021b) were tested.
Bird husbandry and selection
One thousand eight hundred forty Cobb 500 male day-old chicks were randomly distributed to 80 floor pens with reused non-treated wood shavings litter, 23 birds per pen. The pens were assigned to one of five dietary treatments consisting of increasing dietary inclusion rates of a feed additive (blind-coded as in Martinez et al., 2020c) added on top and continuously fed ad libitum standard corn-soybean meal mash diets under a three-phase feeding program (Starter, 1–14 d; Grower, 15–28 d; Finisher, 29–41 d). The diets were formulated following the genetic line guidelines (Cobb-Vantress, 2018) as follows: Starter, 12.64 MJ/kg (metabolizable energy), 22.2 % CP, 1.23 % lysine (digestible), 0.91 % Ca, 0.45 % P (non-phytate); Grower, 13.00 MJ/kg, 20.2 % CP, 1.16 % lysine, 0.81 % Ca, 0.41 % P; and Finisher, 13.38 MJ/kg, 18.8 % CP, 1.03 % lysine, 0.77 % Ca, 0.38 % P. The birds received two hours of light during the first three days and then six hours of dark until the end of the grow-out period, with light intensity between 28 and 45 lux. Ventilation and temperature were automatically controlled (Cobb-Vantress, 2018).
The data for the validation process were obtained following the procedure described in Fig. 1. On day 41, all the birds were groupweighed pen-wise to determine the mean BW of the pens at selection. Seven birds were randomly selected from each pen, wingtagged, and their BW recorded (non-fasted BW). Ad libitum feeding continued for half a day before a 12-hour feed withdrawal period.
Processing birds
On day 42, after an overnight 12-h fast, five of the selected birds were transported to the processing plant, weighed (fasted BW), electrically stunned, bled for 90 s (Caldas-Cueva et al., 2021), scalded, defeathered, eviscerated, and the feet and head cut off. The unchilled carcass was weighed, chilled for one hour on ice water, and the chilled weight was recorded. The wings were extracted, and the carcass deboned by pulling the breast fillet firmly downward and cutting and pulling both tenders off the keel. The leg quarters (drumstick and thigh) were obtained by severing the hip joints keeping the oyster muscle with the thigh. The chilled weights of the cut-up pieces (BRE, TEN, WIN, LQU) were recorded, and those of the TWM and RCP were calculated. The corresponding unchilled weights were back-calculated considering the bird-wise change in weight through the chilling process and a uniform increase (Hudspeth et al., 1973) among the cut-up pieces, as follows:
PWb = PWc x (CARb/CARc)
where PWB = unchilled cut-up piece weight (g), PWC = chilled cutup piece weight (g), CARB = unchilled carcass weight (g), and CARC = chilled carcass weight (g).
Table 1
Models predicting processing weights of broilers using Dual-Energy X-ray Absorptiometry.
1 Ln, natural logarithm; CAR, carcass; RCP, ready-to-cook parts; TWM, total white meat; BRE, breast fillet; TEN, tenders; LQU, leg quarters; WIN, wings.
2 Source: Martinez et al. (2022b). IN, intercept; BWNF, non-fasted BW (g); LEAND, lean tissue weight (g); FATPD, percent body fat (%); AREAD, body area (cm2 ); FATGD, fat tissue weight (g); RATED, lean-to-fat ratio (=LEAND / FATGD). All predictors but BWNF, as provided by DEXA, correspond to approximated indexes, not actual wet chemistry values.
3 Alternative intercepts (IN) are presented for models predicting unchilled or chilled weights. Both models predicting unchilled or chilled weights presented the same adjusted R2 . NA, does not apply.
4 Number (Q) shown in scientific notation (QE–X) should be divided by 10 to the power of X.
Scans
After removing the birds for processing at 42 days, those remaining in the pens were fed again. On day 43 or 44, the two other birds selected per pen were euthanized by CO2 inhalation without fasting, weighed (non-fasted BW; g), and DEXA-scanned following Martinez et al. (2022b). A DEXA equipment (Lunar Prodigy; GE Healthcare, General Electric Co., Madison, WI) with a small animal body software (enCORE version 12.30; GE Healthcare, General Electric Co., Madison, WI) was used. The following DEXAreported indexes were recorded: percent body fat (%), fat tissue weight (g), lean tissue weight (g), lean-to-fat ratio (lean tissue weight / fat tissue weight), and body area (cm2).
Fasted BW and predicted processing weights
The 12-hour fasted BW of the DEXA-scanned birds was determined according to Martinez et al. (2022a), as BWF ¼ BWNF ð Þ 100 � DCL =100, where BWF = fasted BW (g), BWNF = non-fasted BW (g), and DCL = digestive tract content loss correction factor (%) (DCL = 3:1810942 + 3:0099386 x e (-0.001134 x BWNF))
Predicted values were obtained by entering the DEXA-reported values into the models presented earlier (Table 1).
Data adjustment
All measured and predicted weights were pen-wise adjusted (Martinez, 2021) to the same basis (Fig. 1) to remove the biases in processing weights due to selection (Wamsley and Moritz, 2014) in both the processed and scanned birds and due to the differences in age (Zuidhof, 2005) between scanning and processing. The following criterion was considered: (1) The values measured at the processing plant were adjusted for the mean BW of the birds selected per pen to match the mean BW of the whole pen. (2) The DEXA-predicted values were adjusted for their corresponding calculated fasted BW at scanning to match the adjusted fasted BW of the processed birds. The calculations applied were as follows:
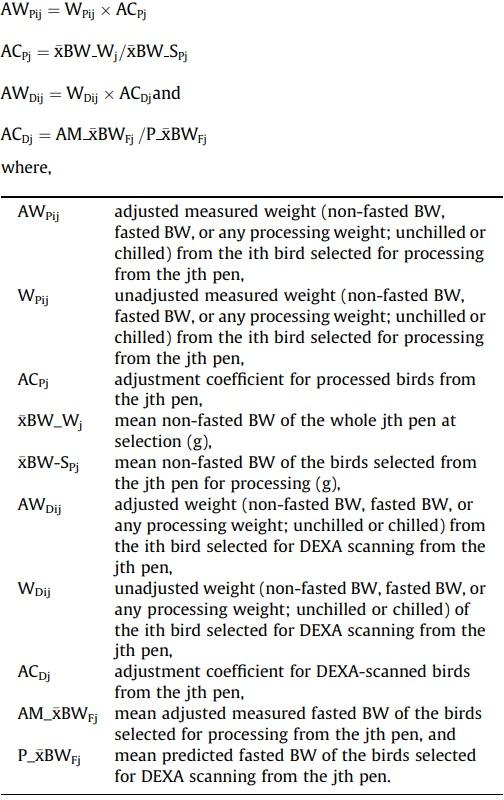
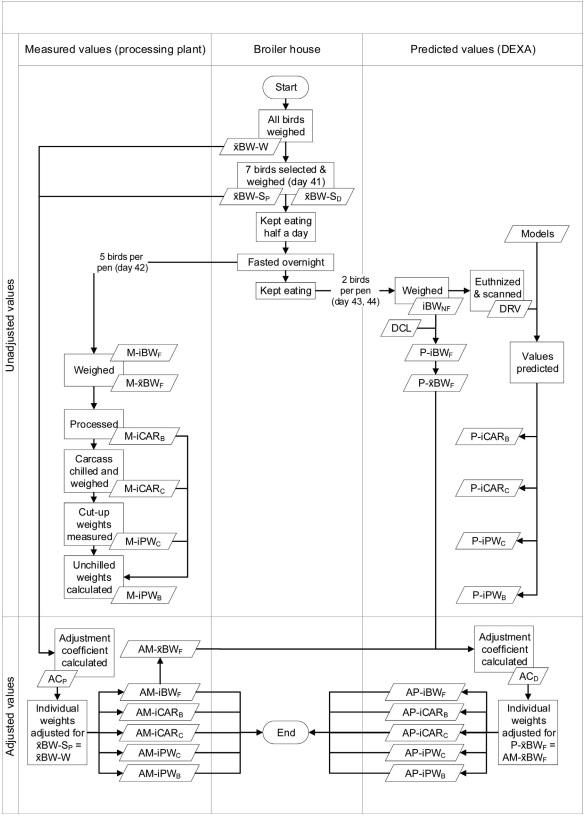
Fig. 1. Collection and adjustment of data from broilers to validate the models. xBW-W, mean non-fasted BW of the whole pen (g); xBW-SP, mean non-fasted BW of the birds selected per pen for processing (g); xBW-SD, mean non-fasted BW of the birds selected per pen for scanning (g); ACP, adjustment coefficient for processed birds; ACD, adjustment coefficient for scanned birds; M-i, measured (observed) value from an individual bird (g); M-x, mean measured value; P-i, predicted value of an individual bird (g); P-x, mean predicted value; AM-i, adjusted measured value of an individual bird (g); AP-i, adjusted predicted value of an individual bird; BWNF, non-fasted BW (g); BWF, fasted BW (g); DRV, DEXA-reported values; DCL, digestive content loss (%) correction factor; CARB, unchilled carcass; CARC, chilled carcass; PWC, chilled pieces weights (g); PWB, unchilled pieces weights (g).
For every calculation, AWPij and WPij corresponded to the same structure (non-fasted BW, fasted BW, or a processing weight) and the same category (unchilled or chilled; if they pertained to processing weights). The same criterion was applied to AWDij and WDij.
Model validation process
The data used to validate the models were: 1) The pen mean observed (measured) processing weights (16 pens per treatment; 5 birds per pen), and 2) the corresponding predicted values applying the models in Table 1 to the DEXA-reported indexes from the same pens (16 pens per treatment; 2 birds per pen); all adjusted to remove the biases mentioned above.
The linear regression between predicted and observed mean values per treatment was calculated for each cut-up piece after restoring each dependent variable to its non-transformed measurement scale by using the EXP function in Excel (which removes the natural log; Microsoft Excel 2019; Microsoft Co., Redmond, WA). The corresponding R2 was used to measure the precision (Tedeschi, 2006). Then, the equivalence of model-predicted and observed values was explored through a parallelism test, which was conducted to determine if the predicted and observed datasets provided or not parallel response curves among treatments. Following the guidelines of the European Pharmacopeia (Chapter 5.3) on the statistical analysis of biological assays (EDQM (European Directorate for the Quality of Medicines HealthCare of the Council of Europe), 2019), the response curves were considered parallel if no effect of the interaction between the dataset (observed or predicted) and the treatment was detected (P > 0.05). A standard least-squares multiple linear regression model was used for the specific purpose of examining the interaction factor (null hypothesis: the slope of the interaction term = 0). Finally, the model prediction accuracy (%) complemented the model prediction error (%; percent deviation from the observed values). The latter was calculated from the deviations between the mean observed and model-predicted values per experimental validation unit (pen) as the root square of the Mean Square Error of Prediction (Inca et al., 2022). Both the model prediction error and accuracy were expressed as a percentage of the overall mean observed value, as follows:
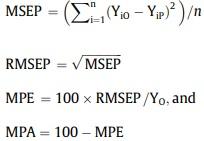
where MSEP = mean square error of prediction, n = number of validation units (pens), YiO = mean observed value (g) in the ith validation unit, YiP = mean model-predicted value (g) in the ith validation unit, RMSEP = root mean square error of prediction (g), MPE = model prediction error (%), YO = overall mean observed value, and MPA = model prediction accuracy (%).
The model was considered validated if the following joint acceptance criteria were met: (1) the validation R2 was high enough, (2) the change in precision from development to validation (R2 change) was ≤ 25 %, (3) the model-predicted and observed response curves were considered parallel, and (4) the model prediction accuracy was ≥ 90 % (model prediction error < 10 %) in the validation phase. The following calculation was applied:
where ΔR2 = percent (%) change in precision from the development to the validation phase (R2 change), R2D = adjusted R2 obtained in the development phase, and R2V = R2 obtained in the validation phase. For each model, the adjusted R2 from the development phase was reported by Martinez et al. (2022b) and presented in Table 1. The validation phase R2 corresponded to that determined in the current study.
All statistical procedures were performed using JMP (JMP Pro 16 software; SAS Institute Inc., Cary, NC).
Results
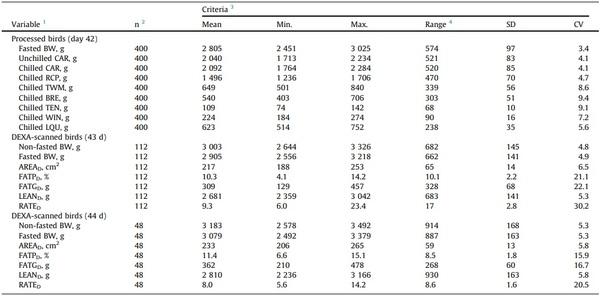
The birds used to validate the models showed low BW variability (CV = 3.4 %; Table 2; Supplementary Tables S1 and S2), and the CV of their processing weights varied from 4.1 % (CAR) to 9.4 % (BRE). The DEXA-reported indexes presented variable dispersion among birds (CV: 5.3 to 6.5 % for lean tissue weight and body area, 16 to 22 % for percent body fat and fat tissue weight, and 21 to 30 % for the lean-to-fat ratio). In addition, large percent (%) differences between the highest and lowest values (range / lowest x 100) were observed in the fasted BW (23, 26, and 36 % at 42, 43, and 44 days, respectively), the carcass and cut-up chilled weights (29–92 %), and the DEXA-reported lean tissue weight and body area (29– 42 %), percent body fat, fat tissue weight, and lean-to-fat ratio (128–289 %). The CV of fasted BW likely increased linearly from 42 to 44 days, but that of DEXA-reported percent body fat, fat tissue weight, and lean-to-fat ratio decreased from 43 to 44 days. The mean fasted BW of the selected birds increased linearly > 100 g/d from 42 to 44 days, and the weight of the CAR increased 2.7 % through chilling.
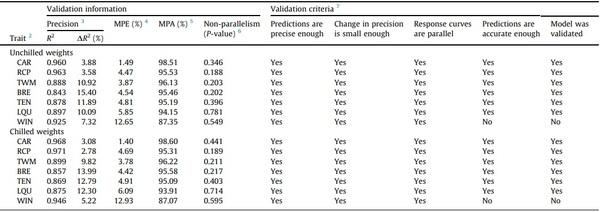
The validation process results are presented in Table 3 (Supplementary Tables S3 and S4). The tested models showed high validation precision (R2 > 0.84; script embedded in Supplementary Table S5). The models presented changes in precision from development to validation (R2 change) varying from 2.78 % (chilled RCP) to 15.4 % (unchilled BRE), and all R2 changes were < 25 %, so all models satisfied this validation criterion (Supplementary Table S4). In addition, both the validation precision (R2) and the R2 change of the models predicting the weight of the same unchilled and chilled part showed similar values. The ratio of R2 of models predicting chilled to unchilled weights of the same cut-up piece (chilled weight R2/unchilled weight R2) showed values that ranged from 0.975 (chilled/unchilled LQU) to 1.023 (chilled/unchilled WIN), and the corresponding ratio of R2 change ranged from 0.713 (chilled/unchilled WIN) to 1.219 (chilled/unchilled LQU).
Except for the models predicting unchilled and chilled WIN, other models showed errors varying from 1.40 (chilled CAR) to 6.09 % (chilled LQU). Model prediction accuracies ranged accordingly (Supplementary Table S4). Therefore, all models, but those predicting WIN, showed prediction error and accuracy values satisfying the corresponding validation criteria.
Finally, the parallelism test showed no non-parallelism (P ≥ 0.188) on the treatment response curves when measured with the actual and the model-predicted values (script embedded in Supplementary Table S6).
Author’s point of view
Predicting the processing weights of the carcass and cut-up pieces may enable the industry to track their growth dynamics across the grow-out period and better design optimization interventions. Our study sought to externally validate prediction models developed by Martinez et al. (2022b) using DEXA at a commercial age.
Table 2
Characteristics of the broilers used to validate the models.
1 CAR, carcass; RCP, ready-to-cook parts; TWM, total white meat; BRE, breast fillet; TEN, tenders; LQU, leg quarters; WIN, wings; FATPD, percent body fat; FATGD, fat tissue weight; LEAND, lean tissue weight; RATED, lean-to-fat tissue ratio (=LEAND / FATGD); AREAD, body area.
2 n = number of birds. 400 birds were processed (5 treatments; 16 pens per treatment; 5 birds per pen). A total of 160 birds were DEXA-scanned (5 treatments; 16 pens per treatment; 2 birds per pen).
3 All the criteria, but the CV, are expressed in the units of the corresponding variable.
4 Range = highest – lowest value.
Table 3
External validation of models to predict the processing weights of broilers using Dual-Energy X-ray Absorptiometry.1
1 The validation process was conducted on the variables restored to their original, non-transformed measurement scale.
2 CAR, carcass; RCP, ready-to-cook parts; TWM, total white meat; BRE, breast fillet; TEN, tenders; LQU, leg quarters; WIN, wings.
3 R2 = coefficient of determination (mean observed versus model-predicted values per treatment). DR2 = change (%) in precision (R2 change; development adjusted R2 to validation R2). Development adjusted R2, as presented in Table 1.
4 MPE = model prediction error, defined as the mean deviation (%) of the model-predicted values from the observed ones.
5 MPA = model prediction accuracy, defined as the mean closeness (%) of the model-predicted values to the observed ones.
6 Non-parallelism of response curves across treatments. Non-parallelism test null hypothesis: interaction of treatment (dose) and dataset (observed or predicted) = 0. Response curves were not parallel if P < 0.05.
7 Joint acceptance criteria: validation R2 was high enough, R2 change ≤ 25 %, prediction accuracy ≥ 90 %, and non-parallelism test P-value > 0.05.
The models tested in this study reported high precision and accuracy values when developed (Martinez et al., 2022b). However, splitting the data into training and validation subsets may have limitations, such as overestimating the efficiency of the models on new data (Harrell, 2015). Therefore, in our study, we have conducted an external validation to determine the precision and accuracy of these models rigorously.
DEXA-scanned euthanized birds cannot follow the standard procedure at a processing plant as only live birds are supposed to enter the processing line and would not bleed. For this reason, the experimental validation unit in this study was not the bird but the floor pen. Indeed, working with mean values has been emphasized as a remedial (Tedeschi, 2006) and follows the fundamentals of inferential statistics to build a conclusion about the population based on a sample, which is commonly applied to validate predictive models.
Even though random selection should prevent bias, it does not guarantee that the mean BW of selected birds equals the overall pen mean weight. Therefore, differences (P < 0.05) among treatments on birds selected for processing may also reflect unintentional bias (Wamsley and Moritz, 2014). Our study used data from birds processed or scanned at three different ages. The models predicted the weight of each processing trait, so it was reasonable to adjust the data to control any selection bias. In addition, a proportional increase in the cut-up pieces was expected as the BW increased with age (Zuidhof, 2005), so adjusting the data also reduced the impact of up to two days of difference between scanning and processing in our study.
The R2 is considered a good measurement of the model’s predictive ability, particularly to quantify the reduction in predictive ability when the model is applied to new data (Harrell, 2015). In this study, a change in precision ≤ 25 % was considered a validation criterion, as it was a conservative change for external validation if the validation R2 was still high enough. Indeed, the precision changes for carcass and cut-up weights found in their validation (1.49– 15.4 %) were around those derived from Salas et al. (2012) for models to DEXA-predict body composition that were developed on broilers and validated in breeders (0.9, 5.9, and 12.5 % R2 change for body mass, lean mass, and body fat, respectively). Even though the unchilled breast weight showed a 15 % reduction in precision for unchilled breast yield, its R2 of 0.843 in the external validation was high enough to be considered precise for validation.
In our study, the floor pen was the experimental validation unit. The predicted and observed values were corrected by body weight to control biases and obtain a proper accuracy diagnosis. However, the breast yield (%) rises as the bird increases its BW through the days (Zuidhof, 2005). Therefore, the variability introduced by scanning and processing on different days may explain some of the reduction in the R2 observed from development to validation.
The validation prediction errors for carcass and cut-up weights in our study (1.40–12.65 %) agree with those reported by Suster et al. (2003) for models predicting the body composition of pigs using DEXA (2, 5, 5, 10, 10, and 15 % for body mass, lean tissue, water, protein, fat, and mineral, respectively).
Except for the models predicting WIN, the range of prediction errors of other models (1.40–6.09 %) is within those values considered low by Owens et al. (2009) when calibrating NIRS to analyze wheat samples and predict its nutrient content (2.78, 2.90, and 4.66 % for CP, dry matter, and starch digestibilities, respectively) and nutritional value (3.74, 4.60, 5.47, and 7.20 % for the ME:gain ratio, FCR, feed intake, and BW gain, respectively). Except for the models predicting WIN, the errors of all other tested models were < 10 %, which was the validation criterion chosen in agreement with Frankenfield et al. (2005) and Inca et al. (2022).
The models predicting unchilled and chilled WIN weights showed errors higher than the validation threshold (12.65 and 12.93 %, respectively). In this regard, the relatively higher bone-to-meat ratio in the wings (Evans et al., 1976) may have influenced the validation accuracy of these models. Indeed, the best model predicting the weight of the feet (including the shank; Martinez et al., 2022b; the part with the highest bone-to-meat ratio) included the DEXA-determined bone mineral content (g) in an interaction factor as a predictor. Therefore, different model structures to predict WIN may be explored. Nevertheless, other models validated herein may be used to obtain the weight of the wings by difference (WIN = RCP – BRE – TEN – LQU). Indeed, the error of the model predicting RCP (4.47 %) is within the range of other validated models (< 5.85 %) and lower than the mean error of the models predicting BRE, TEN, and LQU (5.07 %); therefore, it is not carrying over the lower accuracy of the model predicting WIN.
Testing the interaction factor on multiple linear models to determine the parallelism of responses is a standard method usually applied to validate laboratory assays and procedures (EDQM, 2019). However, as can be ascertained from the existing literature, parallelism tests have never before been used to validate prediction equations in animal and poultry sciences.
In the current study, only male broilers were used. However, the models obtained may be confidently used for female birds as no trait associated with the sex, other than the body chemical composition and those mentioned above, influences the DEXA-reported values. Previous reports showed no influence of the sex of the broilers on the relationship between the actual wet chemistry determined values and their equivalent DEXA measurements. In this regard, Goncalves et al. (2019) found no influence of sex on the relationship between DEXA-reported lean tissue weight (g) and the actual body protein content (g) (P > 0.05). This finding implies that the sex does not predict something that the other predictor (DEXA lean tissue weight) cannot. These authors used half the broilers of each sex, induced differences in body composition, and reported a high R2 (0.986); so it is unlikely that the nonsignificance (P > 0.05) of sex (its slope) in the multiple regression model was a consequence of lack of statistical power. These authors also found no coefficient different than cero (P > 0.05) for sex when predicting the analyzed value of body fat content using the DEXA-reported lean and fat tissue weights as predictors. Suster et al. (2003) also reported negligible effects of sex on models predicting five body composition variables using the DEXA-reported values.
The parallelism test and accuracy calculation used in our study may be further applied as follows: (1) Test if different genetics produce equivalent relationships between protein turnover and processing weights in broilers fed varying dietary amino acid levels, by using Maharjan et al.’s (2020b) data. (2) Determine if table egg quality and bone mineralization show equivalent response curves as dietary Ca and non-phytic P contents change under different environment temperatures, and the most sensitive egg quality trait based on a non-parallelism determination using Zhang et al.’s (2020) data. (3) Determine the equivalency and percent discrepancy of three energy systems as their dietary content increases, by using Suesuttajit et al.’s (in press) performance data. (4) Determine the most sensitive predictor of skeletal integrity (walking ability) of broilers by screening the non-parallelism of bone morphometric traits and their relationship with the walking ability of broilers as the dietary mineral profile changes, using Uculmana et al.’s (2018) and Martinez (2012) bone morphometry data. In addition, the raw data obtained in this study may be used to conduct Monte Carlo simulation studies based on the actual distribution of the data of each variable measured.
Conclusion
This study indicates that the models developed by Martinez et al. (2022b) to predict the processing weights of broilers are validated at a commercial age, except those predicting the unchilled and chilled weights of the wings. The validated models produced precise and accurate values even when tested on a different population of birds. The models validated in this study may be exclusive to the specific equipment, software, and procedure applied, as reported before (Suster et al., 2003). However, the same equation structures may be fitted to new data using a different DEXA-scanning system following the same development and validation processes to obtain new customized prediction models.
This article was originally published in Animal - Open Space 1 (2022) 100022. https://doi.org/10.1016/j.anopes.2022.100022. This is an Open Access article under the CC BY license (http://creativecommons.org/licenses/by/4.0/). 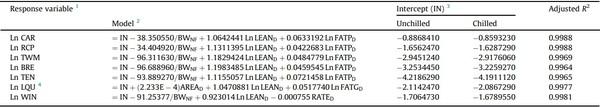

")


