Originally published on KSU Swine Day, Volume 1, Issue 7
Introduction
The proper vitamin and trace mineral supplementation required to optimize performance, but also minimize unnecessary cost, is an area of limited knowledge for production nutritionists. Most commercial diets are formulated well above NRC requirement estimates to maintain a margin of safety needed with potential ingredient concentration variation and bioavailability, fluctuations in daily feed intake, or degradation of vitamins resulting from unfavorable storage conditions.
A notable survey conducted by Coelho and Cousins (19972) examined vitamin supplementation rates from 23 swine entities. From the survey, researchers found that all entities supplied vitamins at levels higher than NRC (1988) recommendations. Also, entities in the highest quartile supplied vitamins at rates of 2 to 10 times that of the lowest quartile. This survey showed that a wide range of supplementation rates were used across commercial systems. Using the results of the survey, the authors conducted an experiment examining the influence of vitamin supplementation rates at different stress levels. They found that with increasing stress, performance was improved with increased vitamin supplementation. However, at low stress levels, increasing vitamin supplementation did not affect growth performance. Ultimately, since the publication of this survey, two NRC publications have illustrated the long lapse in time since a survey was conducted to examine industry vitamin supplementation rates. To our knowledge, there has never been a survey of the supplementation rates of trace minerals in commercial diet formulation.
With this information, future research examining various vitamin and trace mineral concentrations of commercially raised pigs could be conducted. Potential for future research, based on findings of the survey, will better help determine vitamin and trace mineral requirements.
Procedures
The procedures for this survey were approved by the Kansas State University Committee for Research Involving Human Subjects. The survey was an electronically based spreadsheet in Excel® (Microsoft, Redmond, Washington).
The subjects of this survey were swine producers within the United States. Nutritionists for the swine producers were contacted via email or phone from March to August of 2014 and asked if they were willing to participate. Those willing to participate were provided the survey spreadsheet, or a phone interview was conducted to collect their information.
The goal of the survey was to determine and identify industry levels of added vitamins and trace minerals in complete diets for different phases of production. The phases of production in focus were: nursery (weaning to 50 lb), finishing (50 lb to market), gilt development (pre-breeding), and breeding herd diet formulations. Producers provided approximate weight breaks for feeding phases within each stage of production along with the premix specifications, inclusion rates, and inclusion rates of any other added vitamin, or vitamin-like nutrients and trace minerals.
Results were compiled and pooled to determine descriptive statistics on the supplementation rates. Descriptive statistics used included: average, weighted average (determined by the total number of sows), median, minimum, maximum, 25th percentile (lowest quartile), and 75th percentile (highest quartile). Sow inventories were obtained from the Successful Farmer 2013 Pork Powerhouses list3, and producers who were not on the top 25 producer list were asked to provide current sow inventory. All values were determined using Excel formula functions including average, standard deviation (STDEV.S), median, minimum (MIN), maximum (MAX), 25th and 75th percentiles (QUARTILE.EXC). Weighted averages were calculated using the sumproduct function of Excel in which producer supplementation rate was multiplied by the size of the producer (sow herd size) then divided by the total number of sows for all participating producers.
Feeding phases and approximate dietary weight breaks varied from producer to producer; however, results are reported in broad weight ranges that were relatively consistent across all participating producers. Feeding phases for this summary were divided as follows: nursery diets — Phase 1 (weaning to 15 lb), Phase 2 (15 to 25 lb), and Phase 3 (25 to 50 lb);finishing diets — early finishing (50 to 120 lb), mid-finishing (120 to 220 lb), late finishing (220 lb to market), and late finishing with ractopamine HCl (220 to market); and breeding herd diets — gilt development (45 lb to breeding), gestation, lactation, and boar.
Within each dietary phase, the vitamins and trace minerals of interest were: vitamins A, D, E, and K (menadione); thiamin; riboflavin; niacin; pantothenic acid; pyridoxine; biotin; folic acid; vitamin B12; choline; betaine; vitamin C (ascorbic acid); carnitine; copper (Cu); iodine (I); iron (Fe); manganese (Mn); selenium (Se); zinc (Zn); cobalt (Co); and chromium (Cr).
Average supplementation rates for vitamins and trace minerals within each phase of production were compared to NRC total dietary requirements to quantify supplementation rates of the industry compared to published requirement estimates.
Results and Discussion
In total, 18 U.S. swine production systems participated in the survey, totaling approximately 2,268,900 sows. Using the 2013 U.S. Department of Agriculture sow inventory estimate of 5,760,000 (USDA, 20134), this survey sampled approximately 40% of the U.S. sow herd.
Nursery
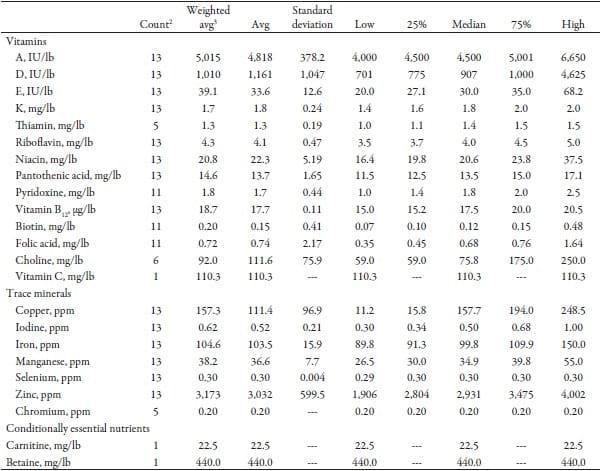
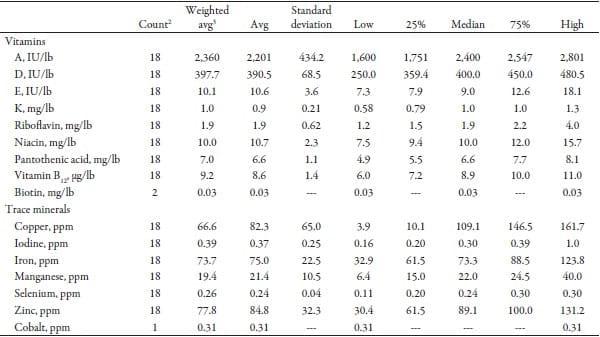
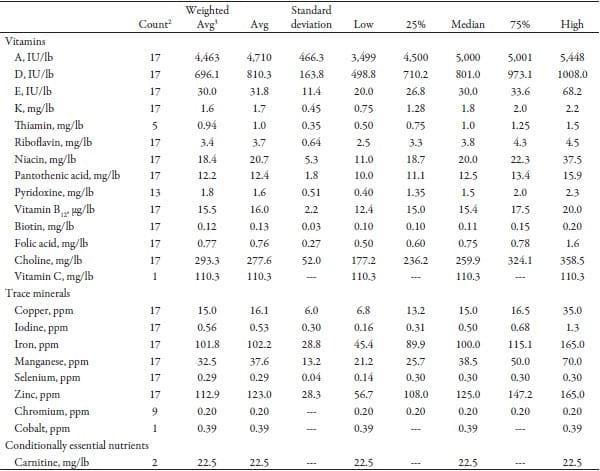
Phase 1 (weaning to 15 lb) nursery diet supplementation rates (Table 1) were provided by 13 producers, which represents approximately 19.4% of the U.S. sow herd inventory. Fat-soluble vitamins were supplemented (average of each nutrient) at rates of 4.6 to 11.6 times that of their NRC (2012) requirement estimate (Table 12). Vitamin D3 was supplemented at 11.6 times the NRC requirement, and a high amount of variation (SD; 1,047 IU/lb) occurred in vitamin D3 supplementation across producers. Watersoluble vitamins were supplemented from 0.4 to 5.5 times their NRC requirement estimate. Both pyridoxine and choline were supplemented below their requirement, presumably because other ingredients in the diet provide adequate concentrations of the nutrients. One producer supplied betaine as a methyl donor rather than choline, and one producer added vitamin C to the weaning-to-15-lb diet.
Table 1. Added vitamin and trace mineral concentrations in Phase 1 nursery diets (weaning to 15 lb)1
 1
1 Thirteen producers provided information for Phase 1 nursery diets, totaling approximately 1,115,400 sows (19.4% of the U.S. sow herd). All reported values are on a complete feed basis.
2 Count shows the number of producers who added levels of a nutrient.
3 Weighted averages were calculated using the sumproduct function of Excel in which the producer supplementation rate was multiplied by the size of the producer (sow herd size), and after summing those products they were divided by the total number of sows for all participating producers.
Trace minerals were supplemented from 1.0 to 30.3 times their requirement. Iron and Se were those supplemented at their requirement, and Cu and Zn were supplemented well above their requirement, at 18.6 and 30.3 times, respectively. Presumably, the high inclusion rate is used for growth promotion. Carnitine was supplemented by one producer. Five producers supplemented Cr to the weaned pig during this phase.
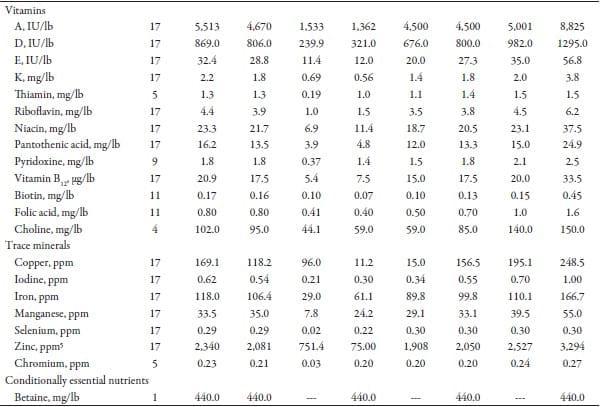
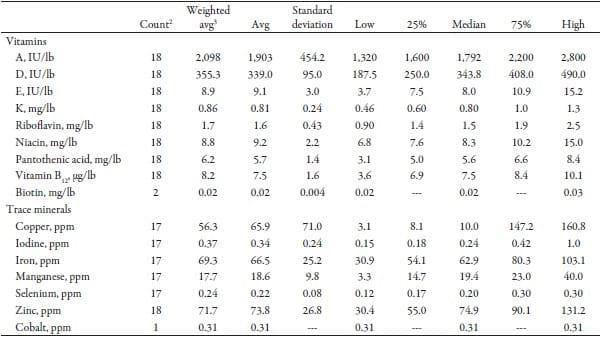
Phase 2 (15 to 25 lb) nursery diet supplementation rates (Table 2) were provided from 17 participants, representing 39.0% of the U.S. sow herd. Fat-soluble vitamins were supplemented at rates ranging from 4.0 to 8.1 times their NRC requirement estimate.
Water-soluble vitamins were supplemented at rates from 0.4 to 7.1 times their respective NRC requirement estimate. Similar to Phase 1 diets, added choline and pyridoxine were supplemented below NRC requirement, presumably because other ingredients provide these nutrients. Trace minerals were supplemented at rates of 1.0 (Se) to 9.1 times their NRC requirement, except for Zn (20.8) and Cu (19.7), which are likely supplemented at high concentrations for growth promotion purposes. One producer supplemented betaine rather than choline as a methyl donor, and 5 producers supplemented Cr in Phase 2 nursery diets.
Table 2. Added vitamin and trace mineral concentrations in Phase 2 nursery diets (15 to 25 lb)1
 1
1 Seventeen producers provided information for Phase 2 nursery diets, totaling approximately 2,243,900 sows (39.0% of the U.S. sow herd). All reported values are on a complete feed basis.
2 Count shows the number of producers who added levels of a nutrient.
3 Weighted averages were calculated using the sumproduct function of Excel in which the producer supplementation rate was multiplied by the size of the producer (sow herd size), and after summing those products they were divided by the total number of sows for all participating producers.
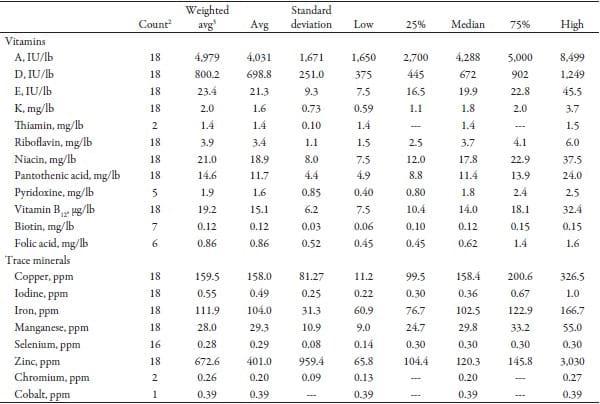
Phase 3 (25 to 50 lb) nursery diet supplementation rates (Table 3) were provided by all 18 producers who participated in the survey. Fat-soluble vitamins were supplemented at 4.3 to 7.7 times their respective NRC requirements. Water-soluble vitamins were supplemented at 1.2 to 6.3 times their respective NRC requirements. No producers who participated in the survey supplemented choline in Phase 3 nursery diets. Trace minerals were supplemented at rates of 1.0 to 9.8 times their NRC requirement, except for Cu, which was supplemented at a rate of 31.6 times the pig’s requirement — probably due to its growth-promotion influences. One producer supplemented Co in Phase 3 nursery diets.
Table 3. Added vitamin and trace mineral concentrations in Phase 3 nursery diets (25 to 50 lb)1
 1
1 Eighteen producers provided information for Phase 3 nursery diets, totaling approximately 2,268,900 sows (39.4% of the U.S. sow herd). All reported values are on a complete feed basis.
2 Count shows the number of producers who added levels of a nutrient.
3 Weighted averages were calculated using the sumproduct function of Excel in which the producer supplementation rate was multiplied by the size of the producer (sow herd size), and after summing those products they were divided by the total number of sows for all participating producers.
Finishing
Early finishing diet (50 to 120 lb) supplementation rates (Table 4) were provided by all 18 producers who participated in the survey. Fat-soluble vitamins were supplemented at 2.5 to 6.7 times their respective NRC requirements. Water-soluble vitamins were supplemented from 0.9 to 2.2 times their respective NRC requirements. On average, niacin was supplemented below the estimated requirement. It is speculated this may be due to the increase (4.6 to 13.6 mg/lb) in niacin requirement from the 1998 to 2012 NRC publication. Biotin was supplemented in early finishing diets by two producers. Trace minerals were supplemented at rates of 28.1 times Cu, 3.0 times Fe, 1.4 times I, 12.6 times Mn, 1.4 times Se, and 1.6 times Zn requirements. Again, presumably, the high inclusion of added copper is used for growth promotion. One producer supplemented Co at 0.39 ppm.
Table 4. Added vitamin and trace mineral concentrations in early finishing diets (50 to 120 lb)1
 1
1 Eighteen producers provided information for early finishing diets, totaling approximately 2,268,900 sows (39.4% of the U.S. sow herd). All reported values are on a complete feed basis.
2 Count shows the number of producers who added levels of a nutrient.
3 Weighted averages were calculated using the sumproduct function of Excel in which the producer supplementation rate was multiplied by the size of the producer (sow herd size), and after summing those products they were divided by the total number of sows for all participating producers.
Midfinishing (120 to 220 lb) supplementation rates (Table 5) were reported by all 18 producers participating in the survey. Fat-soluble vitamins were supplemented at rates 2.1 to 5.7 times their respective NRC requirement estimates. Water-soluble vitamins were supplemented from 0.8 to 3.8 times their respective NRC requirement estimates. Similar to the previous phase, average niacin supplementation was below the current NRC suggested requirement. Two producers provided added biotin in their midfinishing diets. Trace minerals were supplemented at rates of 1.6 to 2.7 times the requirement for I, Fe, Se, and Zn. Average supplementation rates of Cu and Mn were 27.4 and 10.7 times their requirements, respectively.
Table 5. Added vitamin and trace mineral concentrations in midfinishing diets (120 to 220 lb)1
 1
1 Eighteen producers provided information for mid-finishing diets, approximately 2,268,900 sows (39.4% of the U.S. sow herd). All reported values are on a complete feed basis.
2 Count shows the number of producers who added levels of a nutrient.
3 Weighted averages were calculated using the sumproduct function of Excel in which the producer supplementation rate was multiplied by the size of the producer (sow herd size), and after summing those products they were divided by the total number of sows for all participating producers.
Late finishing (220 lb to market) vitamin and trace mineral supplementation rates (Table 6) were provided by all 18 producers who participated in the survey. Fat-soluble vitamins were supplemented at rates of 3.2 times vitamin A, 5.0 times vitamin D, 1.8 times vitamin E, and 3.6 times vitamin K requirements. Water-soluble vitamins were supplemented at rates from 0.7 to 3.3 times their NRC requirements. Niacin, on average, was supplemented at rates below the current NRC requirement. Two producers supplemented biotin in late finishing diets. Trace minerals were supplemented at rates of 1.5 to 2.4 times the requirement for I, Fe, Se, and Zn. Average supplementation rates of Cu and Mn were 22.0 and 9.3 times their requirements, respectively. One producer did not supply added trace minerals in late finishing diets except for added Zn.
Table 6. Added vitamin and trace mineral concentrations in late finishing diets (220 lb to market)1
 1
1 Eighteen producers provided information for late finishing, totaling approximately 2,268,900 sows (39.4% of the U.S. sow herd). All reported values are on a complete feed basis.
2 Count shows the number of producers who added levels of a nutrient.
3 Weighted averages were calculated using the sumproduct function of Excel in which the producer supplementation rate was multiplied by the size of the producer (sow herd size), and after summing those products they were divided by the total number of sows for all participating producers.
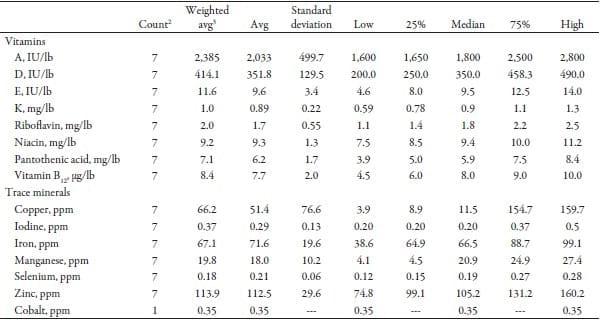
Supplementation rates of vitamins and trace minerals in late finishing diets with ractopamine HCl (Table 7) were reported by 7 of the 18 producers. Fat-soluble vitamin supplementation rates were 3.4 times vitamin A, 5.2 times vitamin D, 1.9 times vitamin E, and 3.9 times vitamin K requirements. Water-soluble vitamins were supplemented at rates from 0.7 to 3.4 times their NRC requirements. Niacin, on average, was supplemented at rates below the current NRC requirement. Trace minerals were supplemented at rates of 1.4 to 2.3 times the requirement for I, Fe, Se, and Zn. Average supplementation rates of Cu and Mn were 17.1 and 9.0 times their requirements, respectively. Overall, producers who responded with information on both late finishing and late finishing diets with ractopamine HCl, supplemented 10% more vitamins, 8.5% more trace minerals (Cu, I, Fe, Mn, Se), and 33% more Zn in those diets with ractopamine HCl.
Table 7. Added vitamin and trace mineral concentrations in late finishing diets with ractopamine HCl (220 lb to market)1
 1
1 Seven producers provided information for late finishing diets with ractopamine, totaling approximately 556,000 sows (9.7% of the U.S. sow herd). All reported values are on a complete feed basis.
2 Count shows the number of producers who added levels of a nutrient.
3 Weighted averages were calculated using the sumproduct function of Excel in which the producer supplementation rate was multiplied by the size of the producer (sow herd size), and after summing those products they were divided by the total number of sows for all participating producers.
Breeding herd diets
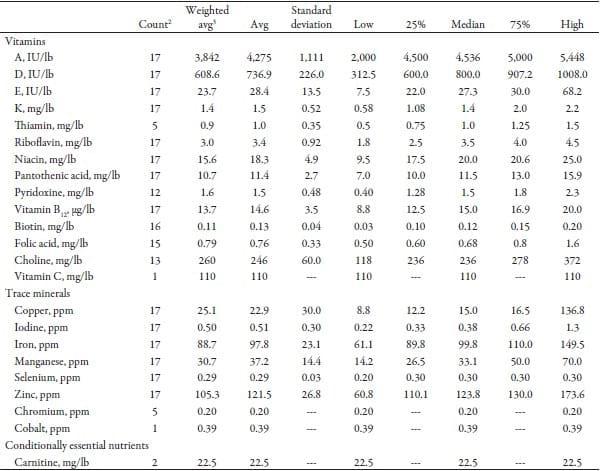
Large differences in weight categories were associated with gilt development diets (Table 8) across the participating production systems. To collate the information, the last diet fed before gilts entered the breeding herd was used (45 lb to breeding). Seventeen producers participated. Gilt development diets were compared to NRC growing pig (55-110 lb) and gestation requirements because most strategies were associated with feeding growing pigs of similar size or to gestation diet supplementation rates. When evaluating the gilt developer diets compared to the suggested growing pig requirements, average supplementation rates of fat-soluble vitamins were 3.3 times the vitamin A, 4.9 times vitamin D, 2.6 times vitamin E, and 3.0 times vitamin K requirements. Compared to gestation requirements, average supplementation rates were 1.1 times vitamin A, 0.9 times vitamin D, 0.6 times vitamin E, and 3.0 times vitamin K requirements. Water-soluble vitamins were supplemented at average rates of 1.0 times thiamin, 1.3 times riboflavin, 0.6 times niacin, 1.4 times pantothenic acid, 1.5 times pyridoxine, 1.5 times vitamin B12, 2.5 times biotin, 2.5 times folic acid, and 0.8 times choline requirements for growing pigs. When evaluating the gilt developer diets compared to the suggested gestation requirements, water-soluble vitamins were supplemented at an average of 1.0 times thiamin, 0.9 times riboflavin, 1.8 times niacin, 0.9 times pantothenic acid, 1.5 times pyridoxine, 1.0 times vitamin B12, 0.6 times biotin, 0.6 times folic acid, and 0.2 times choline requirements. One producer supplemented vitamin C at 110 mg/ lb. Trace minerals were supplemented at average rates of 5.7 times Cu, 3.7 times I, 1.6 times Fe, 18.6 times Mn, 1.4 times Se, and 2.0 times Zn growing pig requirements. Compared to gestation requirements, developing gilts were supplemented 2.3 times Cu, 3.7 times I, 1.2 times Fe, 1.5 times Mn, 1.9 times Se, and 1.2 times Zn requirements. Five producers supplemented Cr at 0.2 ppm, and one producer supplemented Co at 0.39 ppm. Two producers supplemented carnitine at a rate of 22.5 mg/lb of diet.
Table 8. Added vitamin and trace mineral concentrations in gilt development diets (45 lb to breeding)1
 1
1 Seventeen producers provided information for gilt development diets, totaling approximately 2,223,600 sows (38.6% of the U.S. sow herd). All reported values are on a complete feed basis.
2 Count shows the number of producers who added levels of a nutrient.
3 Weighted averages were calculated using the sumproduct function of Excel in which the producer supplementation rate was multiplied by the size of the producer (sow herd size), and after summing those products they were divided by the total number of sows for all participating producers.
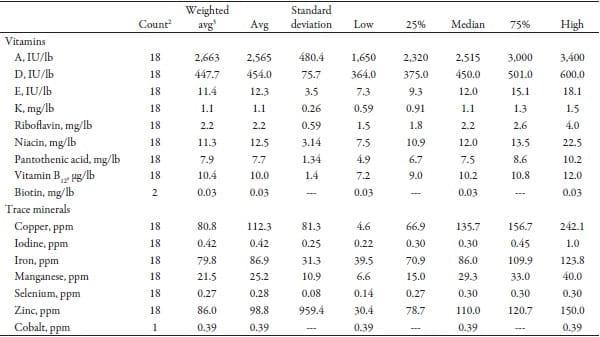
Gestation diets (Table 9) were provided by 17 of the producers. Fat-soluble vitamins were supplemented at rates of 2.6 times vitamin A, 2.2 times vitamin D, 1.6 times vitamin E, and 7.3 times vitamin K requirements. Water-soluble vitamins were supplemented at rates of 2.2 times thiamin, 2.2 times riboflavin, 4.6 times niacin, 2.3 times pantothenic acid, 3.4 times pyridoxine, 2.4 times vitamin B12, 1.4 times biotin, and 1.3 times folic acid the requirements. Choline was supplemented at 0.5 times its requirement due to partial reliance of choline from other ingredients to meet the animal’s requirement. One producer supplemented vitamin C in gestation diets at a rate of 110 mg/lb. Trace mineral supplementation rates were 1.6 times Cu, 3.8 times I, 1.3 times Fe, 1.5 times Mn, 1.9 times Se, and 1.2 times Zn requirements. Nine producers supplemented Cr, and 1 producer supplemented added Co at 0.39 ppm. Two producers supplemented carnitine at a rate of 22.5 mg/lb.
Table 9. Added vitamin and trace mineral concentrations in gestation diets1
 1
1 Seventeen producers provided information for gestation diets, totaling approximately 2,223,600 sows (38.6% of the U.S. sow herd). All reported values are on a complete feed basis.
2 Count shows the number of producers who added levels of a nutrient.
3 Weighted averages were calculated using the sumproduct function of Excel in which the producer supplementation rate was multiplied by the size of the producer (sow herd size), and after summing those products they were divided by the total number of sows for all participating producers.
Lactation diets (Table 10) were provided by 17 of the producers. Fat-soluble vitamins were supplemented at rates of 5.2 times vitamin A, 2.2 times vitamin D, 1.6 times vitamin E, and 7.3 times vitamin K requirements. Water-soluble vitamins were supplemented at rates of 2.2 times thiamin, 2.2 times riboflavin, 4.6 times niacin, 2.3 times pantothenic acid, 3.4 times pyridoxine, 2.4 times vitamin B12, 1.4 times biotin, 1.3 times folic acid, and 0.5 times choline requirements. One producer supplemented vitamin C in lactation diets at a rate of 110 mg/lb of diet. Trace mineral supplementation rates were 0.8 times Cu, 3.8 times I, 1.3 times Fe, 1.5 times Mn, 1.9 times Se, and 1.2 times Zn requirements. Nine producers supplemented Cr at a rate of 0.20 ppm, and 1 producer supplemented added Co at a rate of 0.39 ppm. Two producers supplemented carnitine at a rate of 22.5 mg/lb of diet.
Table 10. Added vitamin and trace mineral concentrations in lactation diets1
 1
1 Seventeen producers provided information for lactation diets, totaling approximately 2,223,600 sows (38.6% of the U.S. sow herd). All reported values are on a complete feed basis.
2 Count shows the number of producers who added levels of a nutrient.
3 Weighted averages were calculated using the sumproduct function of Excel in which the producer supplementation rate was multiplied by the size of the producer (sow herd size), and after summing those products they were divided by the total number of sows for all participating producers.
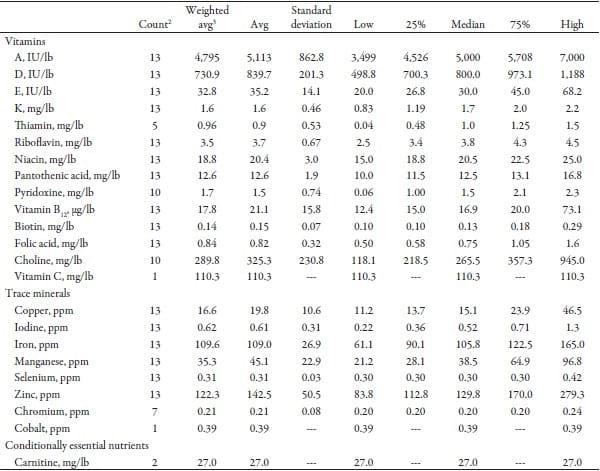
Boar diets (Table 11) were provided by 13 of the producers. Fat-soluble vitamins were supplemented at rates of 2.8 times vitamin A, 9.3 times vitamin D, 1.8 times vitamin E, and 7.0 times vitamin K requirements. Water-soluble vitamins were supplemented at rates of 2.0 times thiamin, 2.2 times riboflavin, 4.5 times niacin, 2.3 times pantothenic acid, 3.2 times pyridoxine, 3.1 times vitamin B12, 1.6 times biotin, 1.4 times folic acid, and 0.6 times choline requirements. One producer supplemented vitamin C in boar diets at a rate of 110 mg/lb of diet. Trace mineral supplementation rates were 4.0 times Cu, 4.4 times I, 1.4 times Fe, 2.3 times Mn, 1.0 times Se, and 2.8 times Zn requirements. One producer supplemented added Se at levels (0.42 ppm) above the maximum concentration of 0.30 ppm, which was due to an increased inclusion rate of a premix that was also used in other diets. Seven producers supplemented Cr at a rate of 0.21 ppm and 1 producer supplemented added Co at a rate of 0.39 ppm. Two producers supplemented carnitine at a rate of 27.0 mg/lb of diet.
Table 11. Added vitamin and trace mineral concentrations in boar diets1
 1
1 Thirteen producers provided information for boar diets, totaling approximately 1,921,100 sows (33.4% of the U.S. sow herd). All reported values are on a complete feed basis.
2 Count shows the number of producers who added levels of a nutrient.
3 Weighted averages were calculated using the sumproduct function of Excel in which the producer supplementation rate was multiplied by the size of the producer (sow herd size), and after summing those products they were divided by the total number of sows for all participating producers.
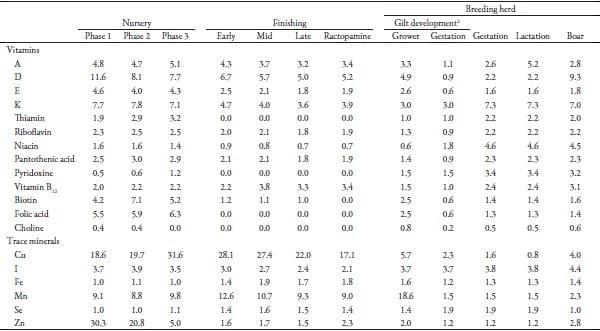
Table 12. Comparing average industry supplementation rates to NRC requirements1
 1
1 Table values represent average supplementation rates as a proportion to total dietary vitamin and trace mineral requirements from the NRC 2012.
2 Gilt development supplementation rates were compared to the NRC requirements of growing pigs from 55 to 100 lb and also to gestation requirements since most strategies for feeding the developing gilt were related to those two diet types.
Nutrient Sources
Along with understanding supplementation rates of vitamins and trace minerals, researchers also questioned participants on the sources of specific nutrients (Table 13) used within the diets. The most distinguishable differences among sources within this survey were associated with the supplementation of vitamin D3 from a cross-linked vitamin A/D3 beadlet, potential use of natural (d-alpha-tocopherol) vitamin E as a source of vitamin E, and the use of organic trace minerals (Cu, Mn, Se, and Zn). For vitamin D3, more than 50% of participants supplemented at least 25% of vitamin D3 from a vitamin A/D3 cross-linked beadlet across all surveyed diet types. The use of natural (d-alpha-tocopherol) vitamin E as a potential source of vitamin E ranged from 29% to 62% across all surveyed diet types. It is important to note that this question only addresses producers that specifically note natural vitamin E as a possible source when ordering premix from premix blenders. It does not distinguish whether natural vitamin E was used within their premixes or complete diets. Use of organic sources for partial or complete supplementation of Cu, Mn, or Zn ranged from 0 to 46% across surveyed diet types. Organic Se for partial or total Se supplementation ranged from 0 to 77% of respondents across the survey diet types. Most organic trace mineral supplementation occurred in breeding herd and early nursery diets.
Table 13. Percentage of participating producers using alternative vitamin and trace mineral sources
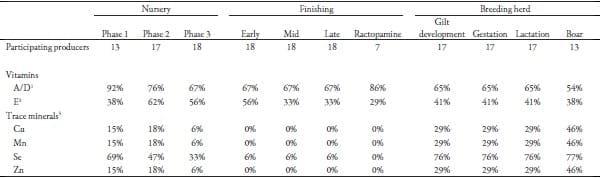
1 Values represent the percentage of participating producers that provide at least 25% of vitamin D3 from a vitamin A/D3 cross-linked beadlet.
2 Values represent the percentage of participating producers that specify natural (d-alpha-tocopherol) vitamin E as a potential source of vitamin E.
3 Values represent the percentage of participating producers that supplement partial or complete trace mineral concentrations from organic sources.
Conclusion
Overall, the collected information covered approximately 40% of the U.S. swine sow herd. Clearly, there is variation in vitamin and trace mineral supplementation rates across the population of respondents within this survey. A wide range of trace mineral supplementation practices was used in early nursery and breeding herd diets, along with wide variations in fat-soluble vitamin supplementation rates. Different sources of some vitamins and trace minerals are also used, which may explain some of the variation in supplementation rates of these nutrients. In the future, this survey will be useful in developing experimental designs testing vitamin or trace mineral supplementation rates in various phases of production.