I. INTRODUCTION
Nutrient requirements are established by means of dose-response studies. Data is subjected to appropriate regression analysis and the level needed to maximise a given response (body weight gain, feed efficiency, carcass yield, etc.,) is defined as ‘requirement’. The estimates are compiled as ‘tables of nutrient requirement’ e.g., NRC, CVB, Brazilian Tables, nutrition guides by the genetic suppliers, and are used by field nutritionists as reference. The classical estimates of nutrient requirement are established based on maximum growth performance and may not necessarily reflect the levels needed for maximum economic returns.
Growth is the function of nutrient intake. This implies that, given a nutritional balance, increasing nutrient density would improve feed efficiency (FE), more accurately feed efficiency corrected for body weight (BWFE), in a linear fashion, theoretically, to unity. This hypothetical maximum is constrained by the highest nutrient density achievable in a practical type diet. Likewise, reducing nutrient density would precipitate proportionate reduction in BWFE, at least to the point where bulk-density of diet begins to limit daily nutrient intake. The economic optimum nutrient density – the one resulting in lowest feed cost per unit live or product gain - is a moving target between these two extremes and is dictated by the price, availability, and choice of feed ingredients. This schematic, however, contrasts with reality in that most feed markets, especially those functioning as stand-alone-, non-integrated-models, are driven by a targeted certain fixed level of technical performance e.g., xyz BWFE or production index, rather than the optimum feed cost per gain. Consequently, diet composition hardly sees an ‘adjustment’ for changes in the price of major feed ingredients. It seems logical to argue that increasing prices of energy and protein, as for example experienced by the industry in recent times, will shift the economic equation in favor of lower nutrient density diets. The focal point of this communication is the idea that there could have been situations where a few points reduction in BWFE, carefully imposed through reduced nutrient density, may increase net monetary returns.
II. METHOD
a. Performance trials
Growth performance studies were conducted to establish the relationship between diet nutrient density and technical performance of broiler chickens. The studies were conducted at the R&D facility of Jadeed Feed and Farms Pvt Ltd. Pakistan during May-August 2020. Commercial type broiler diets based on maize-soybean meal (Trial 1) and maize-soybean meal-canola meal (Trial 2) were formulated to supply energy and nutrients as per industry practice (100% nutrient density). A series of test diets representing 90, 95, 100, and 105% nutrient density (Trial 1) and 90, 100, and 110% nutrient density (Trial 2) were assigned to 10 replicated pens of 20 straightrun, Ross 308 broilers from 1 to 35 days. A constant SID lysine to ME ratio was maintained across diets. A two-phase feeding program was employed in these trials with feed offered as crumbles (1 to 14 and 1 to 18 days post-hatch, respectively for trials 1 and 2) and pellets (15 to 35 and 19 to 35 days post-hatch, respectively for trials 1 and 2). The research facility was based on an environmentally-controlled house fitted with adjustable floor pens. Each floor pen was equipped with a feeder and a drinker, rice husk was used as bedding and space was adjusted to provide 0.75 square feet floor area per bird. Feed samples were analysed for proximate, total P, Ca, and Na by Association of Official Agricultural Chemists (AOAC, 2015) methods. Pen feed intake (FI) and body weight (BW) were recorded at the end of every feeding phase, and feed efficiency (FE) corrected for mortality was calculated. BW, FI, FE, and mortality was subjected to analysis of variance as a randomized complete block design using SPSS. Means were compared using Tukey’s test using P < 0.05 as conventional minimum level of significance.
b. Economic analysis
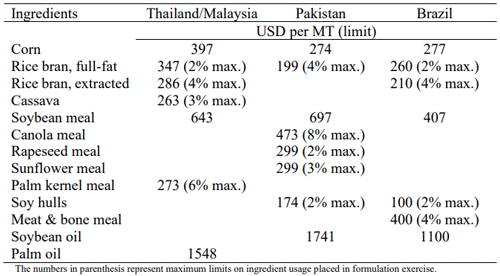
The economic model was based on the premise that BWFE was a linear function of nutrient density. With a single change that the energy (AME) was reduced by 100 kcal (0.418 MJ) in each phase, nutrient recommendations for mixed-sex Ross 308 (Aviagen, 2019) were set as 100% nutrient density (the ‘input’) while FE at 35 d of age was selected as the corresponding benchmark for performance (the ‘output’; Aviagen, 2021). Reduction of 100 kcal from Ross 308 AME in the control (100% nutrient density treatments) was employed to reflect more closely the commercial practice. A series of example diets ranging from 94 to 102% nutrient densities were formulated using the list of ingredients and prices described for three selected markets (Table 1). Prices of minor ingredients i.e., crystalline amino acids, salt, inorganic phosphate, phytase, vitamin and mineral premixes, were assumed constant across regions.
Table 1 - Feed ingredients, prices, and limits used in formulation exercise.
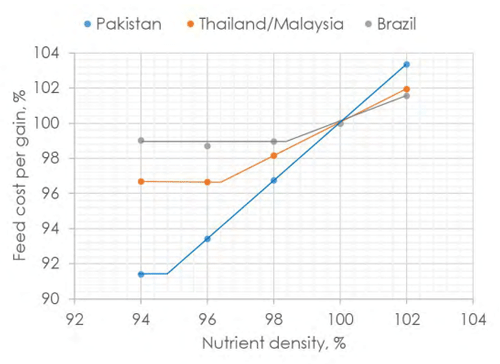
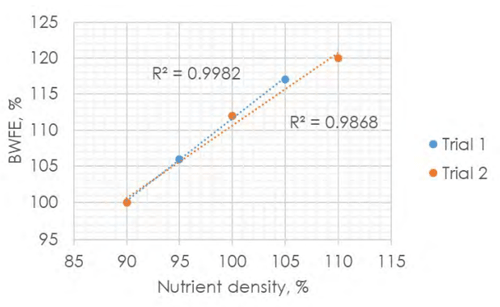
The corresponding BWFE (out-put term) for unit change in nutrient density was calculated following the trend in Figure 1. Cost per unit of live gain was calculated by dividing the cost of each diet with corresponding BWFE (Figure 2). Following the recommended phasefeeding plan, each treatment group was composed of three diets i.e., starter (1-10 d), grower (11-24 d) and finisher (25-35 d). Translating to performance objectives outlined by Ross 308, the economic calculations assumed feed intake distribution in the order of 10, 45, and 45%, respectively for starter, grower, and finisher diets.
III. RESULTS
With average BW of 2250 g per bird and FCR of 1.42 (Trial 1) and BW of 2260 g per bird and FCR of 1.44 (Trial 2), the growth performance corresponding to 100% nutrient density treatments in these studies was comparable to the published performance objectives of straightrun Ross 308 (Aviagen, 2021). Liveability was > 97% in both studies. Figure 1 summarizes the results of these studies which confirmed the hypothesis that BWFE was a linear function of diet nutrient density. In trial 1, increasing nutrient density by 17% (105 vs. 90%) resulted in a 17% improvement in BWFE (R2 = 0.998), while in trial 2, an increase in nutrient density by 22% (110 vs. 90%) resulted in 20% improvement in BWFE (R2 = 0.987). At or above 95% nutrient density, the diet had no effect on BW (P > 0.05).
Figure 1 - BW-corrected FCR as a function of diet nutrient density
IV. DISCUSSION
Broiler chickens adjusted their FI to maintain constant BW to 95% nutrient density. This adjustment however was not precise beyond this point and the final BW (35 d) differed by ~100 g across lowest (90% nutrient density) vs. highest (105 and 110% nutrient density treatments, respectively, in trials 1 and 2). This means the lowest nutrient density groups (90%) would require an additional ~1 to 1.5 days to reach target slaughter weight. This observation was contrary to Leeson’s work in 1990’s in which they observed no differences in BW-for-age of broiler chickens even when nutrient density of the diets was reduced to 50% (Leeson et al. 1996). The results of these studies confirmed that BWFE was a sensitive predictor of nutrient density of diets and could be used to model economic optimum nutrient density under a varying set of ingredient prices and choices.
Nutrient requirement and performance objectives of Ross 308 (Aviagen, 2019, 2021) were used to calculate optimum nutrient density under current prices (May 2022) of feed ingredients in three markets: Thailand/Malaysia, Pakistan, and Brazil. Thailand and Malaysia had a comparable set of prices for key feed ingredients and hence were combined as one market. The selection of these markets provides a good description of the range of available feed ingredients and variability in relative prices of energy (cereals and vegetable oils) vs. protein meals vs. cereal and other by-products which potentially exist in different regions (Table 1). The economic analysis suggested the optimum nutrient density was 98.8, 96.4, and 94.8%, respectively for Brazil, Thailand/Malaysia, and Pakistan markets (Figure 2).
Figure 2 - Summary economic analysis

As expected, the extent and the benefit of lowering nutrient density was dictated by the price of the major ingredients i.e., corn, soybean meal, and added oil, as well as on the choice of the alternative feed ingredients. Therefore, Pakistan, which has a relatively high price of vegetable oil and soybean meal, benefitted most (i.e., 9% reduction in feed cost per unit live gain) from lowering nutrient density down to 94.8% which was made possible by the range of alternative ingredients available at hand. On the other hand, Brazil, with the lowest prices of corn, soybean meal, and soy oil did not see the benefit of lowering nutrient density below ~99%. Thailand/Malaysia, despite having high prices of energy and protein, only saw a modest benefit i.e., 3% reduction in feed cost per gain, maximized at 96.4% nutrient density, likely due to a rather narrow choice of alternative ingredients. In all selected example markets, reducing nutrient density offered commercial benefit with the magnitude varying from 1 to 9% reduction in feed cost per unit live gain.
Presented at the 34th Annual Australian Poultry Science Symposium 2023. For information on the next edition, click here. 


