1. Introduction
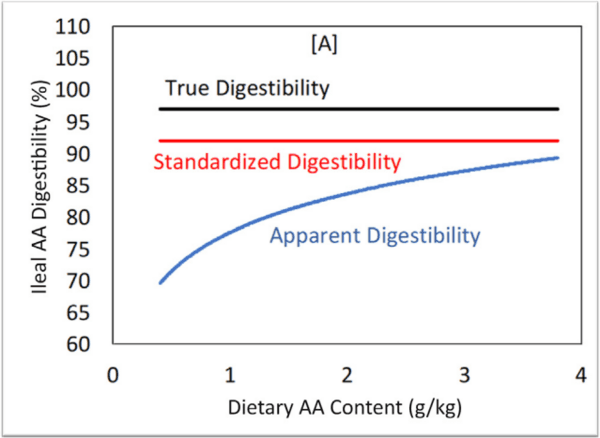
Standardized ileal digestibility (SID) has become the accepted standard to measure amino acid (AA) digestibility (Stein et al., 2007a; Levesque et al., 2010). In nutrition, apparent ileal digestibility (AID) increases with dietary AA concentration while true ileal digestibility (TID) and SID are assumed to be independent of AA concentration (Stein et al., 2007a). The digestibility of SID AA in feed ingredients is important to the swine industry, and many peer-reviewed studies were conducted to find the SID of various feed ingredients (Jacela et al., 2010; Li et al., 2015). The results from these studies have been compiled into databases for nutritionists to use when formulating diets on a digestible basis (Stein et al., 2007a; NRC, 2012). Swine diets that are formulated on a digestible basis are expected to increase nitrogen (N) absorption, thus decreasing pollution and dietary costs (Lee et al., 2017). Standardized ileal digestibility should be an indicator of what the animal can use for maintenance and growth, so having reliable digestibility values for feed ingredients is necessary to formulate cost-effective diets, and maximize growth performance (Stein et al., 2007b).
True ileal digestibility (TID) reflects total AA disappearance from the digestive tract to the distal ileum. True ileal digestibility corrects for endogenous losses due to specific feed ingredient differences, as well as basal losses from the digestive tract. Specific endogenous losses can increase due to fiber or other anti-nutritional factors. This can increase AA digestibility estimates of proline and glycine disproportionately high (> 100%) compared to other AA (Nyachot et al., 1997). Since SID and TID are assumed to be parallel, and SID is easier to measure, it is the preferred measure of AA availability (Stein et al., 2007a; Urbaityte et al., 2009). The use of SID is based on the assumption that AA digestibility is independent of the concentration of AA in the finished feed (Stein et al., 2005).
To be additive, results from the SID technique should account for basal endogenous losses that are not influenced by the type of test material, but the SID assay is not designed to measure such losses (Saucer and Ozimek, 1986; Stein et al., 2007b). The fiber content of oilseed meals affects the SID of AA in swine assays (Messad et al., 2016). Zeng et al. (2017) demonstrated that the AA concentration of individual AA affects SID measurements in some distillers' grains products. Therefore, there is evidence that SID values may be affected by other constituents in the test materials.
If the fiber in oilseed meals affect SID values for the oilseed meals, they may be expected to affect the AA absorption from other components when the oilseed meals are part of a mixed feed. Similarly, the AA concentration in a mixed feed may affect AA absorption in a mixed feed. From databases of SID values for poultry (called true amino acid availability [TAAA]), positive relationships between SID and AA concentration have been found for both broiler chick assay and caecectomized rooster assay databases (Tahir and Pesti, 2012). True digestibility measurements may be a property of the assay as well as the feed ingredient (Sibbald, 1987; Tahir and Pesti, 2012).
The primary objective of this study was to test the hypothesis that there is relationship between an ingredient's AA concentration (or level) and SID values in databases for formulating swine feeds. This was done by testing 3 databases, 2 compiled from various studies (National Research Council [NRC], 2012; Evonik Industries, 2015), and 1 research report (Urbaityte et al., 2009). When a significant effect of dietary AA concentration on SID values was observed, the secondary objective became to explore reasons for SID =f(concentration) relationship. Next, equations to calculate SID from experimental data were compared.
2. Materials and methods
The databases examined were: The Nutrient Requirements of Swine, 12th edition (NRC, 2012); and Evonik Industries' AMINODat 5.0 (Evonik Industries, 2015). Twenty common feed ingredients were chosen based on corresponding ingredients from both databases (Table 1). Data were analyzed using PROC GLM of SAS (9.4) (SAS Institute, 2008). The effects of database, ingredient, total AA concentration in the ingredient (AA level) and their second and third order interactions on SID values were tested. Only significant terms at P < 0.05 were included in the final model. The data from Urbaityte et al. (2009) were analyzed using PROC GLM of SAS (9.4) (SAS Institute, 2008). The effects of ingredient, AA, and AA level and their second and third order interactions on SID values were tested. Only significant terms at P < 0.05 were included in the final model. Simple linear regressions were calculated by ingredient and AA for SID = f(AA level) for the NRC (2012) and Evonik Industries (2015) databases using PROC GLM of SAS (9.4) (SAS Institute, Inc., 2008). Linear and cubic regressions were calculated to determine the influence of dietary AA level on the distal ileal AA from the data of Fan et al. (1995) using PROC GLM of SAS (9.4) (SAS Institute, 2008). Average and least-squares means of AA contents were computed for the data in Urbaityte et al. (2009) using PROC MEANS AND PROC GLM of SAS (9.4) (SAS Institute, Inc., Cary, NC) using the model: data a; input AA$ Ingred$ SID AALevel; cards; Proc glm; class AA Ingred; Model SID = AA Ingred AALevel AALevel*AALevel Ingred*AALevel; lsmeans AA. The model was run a second time with AALevel*AALevel eliminated, and a third time with 7 non-essential AA eliminated.
The normal quantile (QQ) plot analysis was performed on the data to test for normality. BreuschePagan Tests (Breusch and Pagan, 1979) were performed on the SID =f(Level) data for each AA to check for heteroskedasticity of variances.
3. Results
The normal quantile (QQ) plot analysis determined the R2 of the data was 0.983, confirming the normality of the data. The BreuschePagan Tests for SID = f(Level) for each AA had probabilities between 0.2494 (Gly) and 0.9741 (Arg), confirming the null hypothesis that the regressions do not exhibit heteroskedasticity.
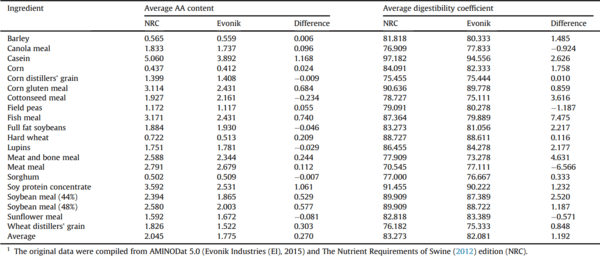
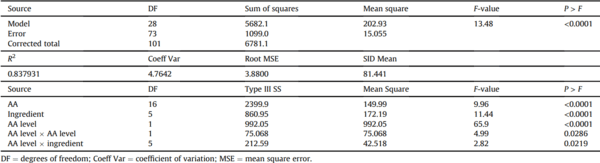
Table 1
A comparison of the arithmetic mean amino acid (AA) contents and digestibility coefficients of feedstuffs for swine in 2 commonly used databases (%).
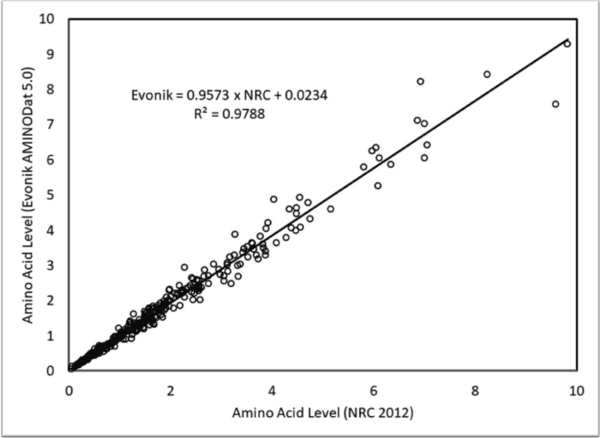
Fig. 1. Relationship between amino acid levels in National Research Council (2012) and Evonik AMINODat 5.0 (2015) databases.
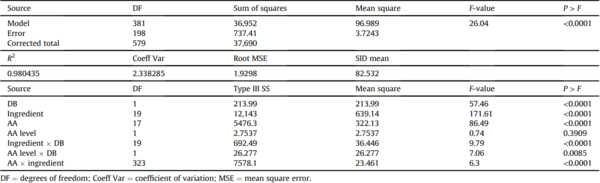
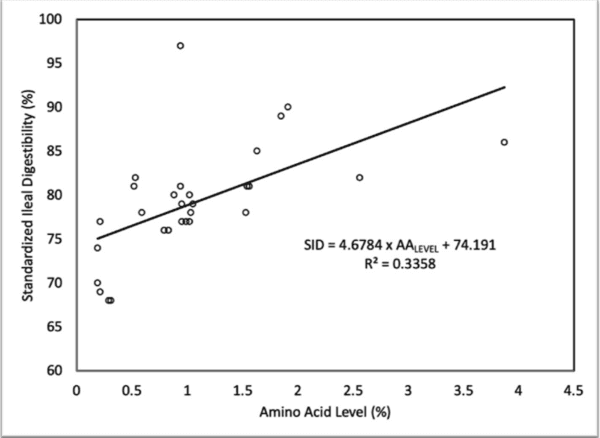
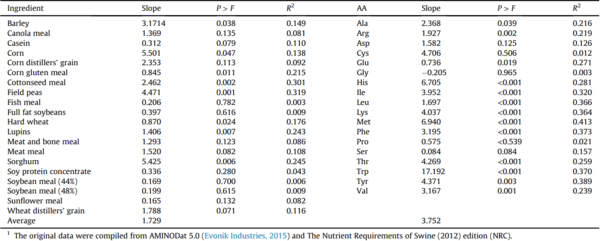
The average AA concentration in the NRC (2012) and Evonik Industries (2015) databases differed by 0.27% and the average SID values differed by 1.19% (Table 1, Figs. 1 and 2). Significant contributors to variation in AA SID values were database, ingredient, AA, and AA concentration (as indicated by the significant AA concentration by database interaction; Table 2, Figs. 3 and 4). Other interactions were between ingredient and database and AA and concentration. Significant contributors to the variation in SID in the data of Urbaityte (2009) were the AA, ingredient and AA concentration (Table 3); There was also a significant (P < 0.05) second order effect of AA concentration on AA SID, and an ingredient by AA concentration interaction. The slopes relating SID values to total AA in the feed ingredients were all positive with 8 of 20 so at P < 0.05. The probability of all 20 slopes being positive if there were no effect (half positive and half negative) of AA concentration on SID is (0.5)20, or 9.54 x 10⁻⁶. Seventeen of the 18 AA had positive slopes, with 13 of 18 being significant at P < 0.05 (Table 4, examples in Figs. 3 and 4).
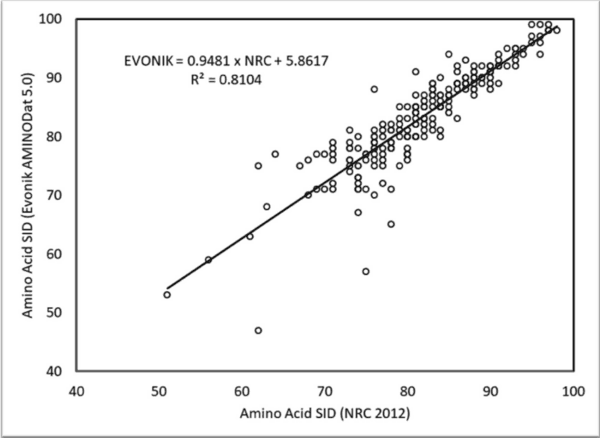
Fig. 2. Relationship between amino acid standardized ileal digestibilities (SID) in the National Research Council (2012) and Evonik AMINODat 5.0 (2015) databases.
Table 2
Analysis of variance for the effects of database (NRC, 2012) versus Evonik AMINODat 5.0, ingredient, amino acid (AA) and AA level (g/kg) on the standardized ileal digestibility (SID) by piglets.
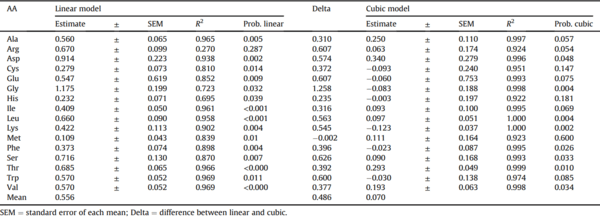
Of the 16 AA concentrations studied by Fan et al. (1995), 15 had positive linear slopes. Only 3 of 16 cubic coefficients had probabilities greater than P = 0.10, demonstrating that the linear coefficients are overestimating endogenous losses by 0.486% (Table 5, Fig. 5).
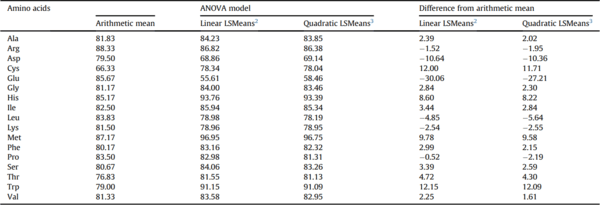
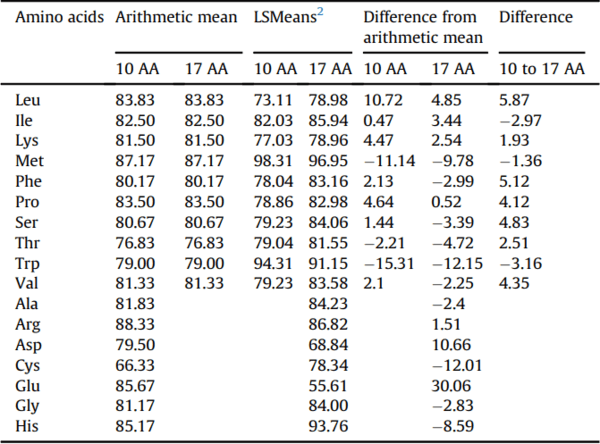
The method of mean calculation (arithmetic versus leastsquares) and model for least-squares means calculation (liner versus quadratic) changed the results (Table 6). Differences between arithmetic and least-squares means ranged from 30.06 for glutamic acid to +12.15 for tryptophan (Table 6). When 8 AA were removed from the model, the least-squares means for the remainder were different from when all the AA were included (from +5.87% for leucine to -3.16% for tryptophan, Table 7).
4. Discussion
4.1. Demonstration that SID = f(AA concentration)
The databases studied are ideal for testing the hypothesis that SID values are influenced by the AA concentration in the test feed. They represent both a compilation of SID values from various peerreviewed studies, chosen by an expert committee (NRC, 2012), and SID values based on internal research by a commercial company supplemented with values from peer-reviewed literature (Evonik Industries, 2015). The nutrient values used in both databases are a compilation of feed ingredients from various sources around North America and the world, respectively. The databases studied do represent very similar ingredients and the overall AA composition and SID values are very similar (Table 1 and Figs. 1 and 2). By comparing results of the database compilations to individual research studies, the possibility of observed effects being an artifact of compilation was eliminated.
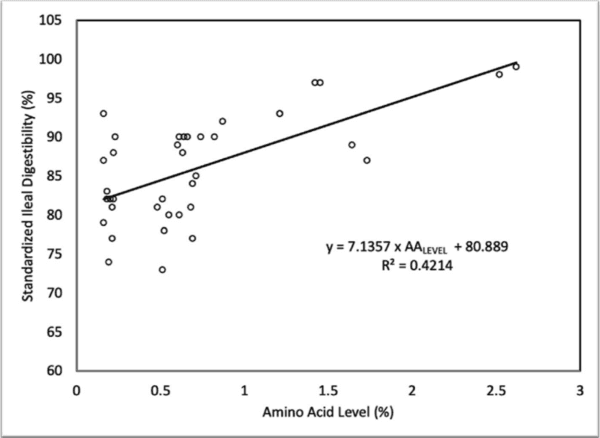
Fig. 3. Relationship between methionine standard ileal digestibilities (SID) and methionine level in 20 common feed ingredients in the National Research Council (2012) and Evonik AMINODat 5.0 (2015) databases. The probability that the slope is different from zero by chance is less than 0.001.
Fig. 4. Relationship between amino acid standard ileal digestibilities (SID) and their levels in field peas in the National Research Council (2012) and Evonik AMINODat 5.0 (2015) databases. The probability that the slope is different from zero by chance is less than 0.001.
The probabilities for the effects of AA concentration on AA SID values leave little doubt that SID values are partially dependent on AA concentration between ingredients (Tables 2 and 3) and the null hypothesis: that there is no relationship between AA concentration on SID with increasing AA concentration should be rejected (P < 0.001). The effects of ingredients are quantitatively different between the 2 databases (Ingredient DB, P < 0.001, Table 2), and responses to AA are quantitatively different for various ingredients (AA Ingredient, P < 0.001, Table 2). And the effects of AA concentration are quantitatively different for the 2 databases (AA Ingredient, P < 0.001, Table 2). The quantitative effects of AA concentration are different for the 2 databases (AA Concentration DB, P < 0.001, Table 2) but still highly significant. The results of the individual research trial confirm SID = f(AA Concentration) although in that trial the linear (P < 0.001) and quadratic (P < 0.03) coefficients were both significant (Table 3). The assumption that SID is independent of level is ruled out by the probabilities for the effects of Level x Database in Table 2 (P < 0.01) and the probabilities for AA level (P < 0.001) in Table 3. Since these probabilities are from different sources, they may be multiplied to show that the overall probability of finding the observed effects 3 times is P < 0.001.
Standard ileal digestibility and AA concentration are highly related. That there is a relationship does not prove causation, yet relationship is the first step to identify potential issues that need to be investigated and studied further. The relationship is persistent and cannot yet be corrected for by considering protein source, feed ingredient, or database. A meta-analysis by Zeng et al. (2017) showed that there was a relationship between AA content and SID; This study was limited to various kinds of distillers dried grains (DDGS). Zeng et al. (2017) showed a negative relationship between NDF and AA digestibility. A similar meta-analysis by Messad et al. (2016) showed a similar relationship between NDF and AA SID in oilseed meals.
Table 3
Analysis of variance for the data of Urbaityte et al. (2009) for the amino acid (AA) standardized ileal digestibility (SID) of feed samples.
Table 4
Estimates of the slopes of digestible amino acids (AA) as functions of the concertation of AA in feed ingredients common to 2 data sets.
4.2. Potential reasons for SID = f(AA concentration)
4.2.1. Kinetics of digestion and absorption
This study shows that the AA SID assay results with swine are similar to those results with poultry (Tahir and Pesti, 2012). Is this relationship then a natural phenomenon or an artifact of the assays? Due to the complex nature of “digestibility”, there may be no one simple answer. Indeed, “digestibility” as commonly used in “digestibility” assays is really the product of digestion and absorption. Thus, anything that has an effect on either will impact results of SID assays. Digestion, in its classical definition, refers to an enzyme catalyzed process subject to MichaeliseMenten kinetics (Michaelis and Menten, 1913). The velocity of digestion reactions is expected to be low at low substrate concentrations and increase to a plateau. This has been demonstrated for methionine in chickens (Knight and Dibner, 1984). Thus the kinetics of digestion appear similar to the kinetics of AID = f(AA intake), but they are a totally different phenomenon and unrelated to any assay method: They are not subject to endogenous losses in any way, for example. For proteins not completely digested or at low concentrations, the reactions may simply be incomplete by the time they reach the distal ileum, accounting for low SID values. Amino acid absorption in the ileum is also subject to MichaeliseMenten kinetics, with low rates at low concentrations and rates reaching a plateau (Fig. 6).
4.2.2. Overestimation of endogenous losses
There are different ways to directly measure endogenous losses. The most common are feeding reference pigs a protein-free diet, feeding a highly digestible, perhaps enzyme hydrolyzed, protein source that is assumed to be 100% digested and feeding several protein/amino levels and extrapolating to zero. Protein-free diets are fed for a period of time, usually between 3 and 6 days, and any AA that are collected are thought to be from the gut and not the diet since there is no protein added to the diet (Gowalock et al., 2016; Kong and Adeola, 2014). Protein-free diets are not ideal for measuring endogenous losses: Reference animals are in a protein-deficient state compared to test animals eating a diet adequate in protein (Low, 1980). When endogenous losses are found using a protein-free diet, animals are in negative protein balance and may not secrete the same digestive juices as those fed protein (Urbaityte et al., 2009; Maughan and Rutherfurd, 2012). Alternatively, reference animals are sometimes fed an enzyme hydrolyzed diet based on a highly digestible feed ingredient like casein. When comparing these 2 methods, enzyme hydrolyzed reference diets have consistently led to higher digestibility coefficients than a protein free reference diet (Yin et al., 2008). The protein-free diet method is the most widely accepted method for determining SID, for swine, despite the well-known shortcomings (Kong and Adeola, 2014). Also, the protein-free method may overestimate Pro and Gly and underestimate all other AA (Urbaityte et al., 2009). Feeding a diet with highly digestible nitrogen sources, like casein, wheat gluten, and crystalline AA may alter the endogenous losses to better mimic the effect of a typical diet (Jansman et al., 2002; Pedersen and Boisen, 2002). The ingredients in this type diet may not be as highly digestible as assumed. Therefore, this would overestimate endogenous losses (Nyachot et al., 1997). It has been suggested that endogenous losses determined by a protein-free diet or regression method can underestimate endogenous losses (Sauer and Ozimek, 1986).
Table 5
Comparison of intercepts from linear and cubic models of ileal amino acids (AA) from Fan et al. (1995).
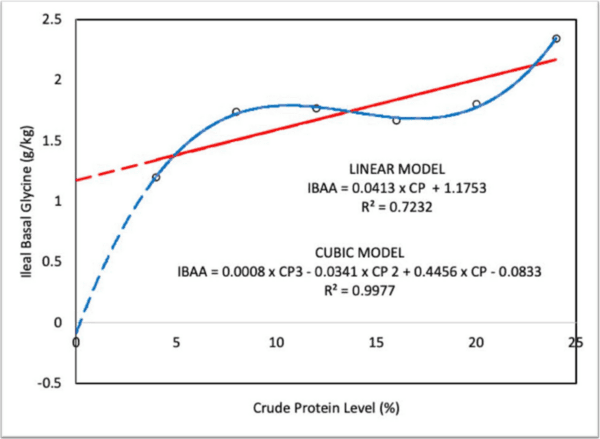
Fig. 5. Example relationship between ileal basal amino acids (IBAA) and crude protein level of the diet, from the data of Fan et al. (1995). The red line represents the best fit linear response model, and the blue line represents the best fit cubic response model.
Table 6
Comparison of arithmetic and least-squares means of standardized ileal digestibility (SID) data of Urbaityte et al. (2009).
1 Means are of each of 17 AA across 6 ingredients that were tested.
2 Model SID = AA, ingredient, AA level, AA level AA level, AA level ingredient.
3 Model SID = AA, ingredient, AA level, AA level ingredient.
Table 7
Comparison of arithmetic and least-squares means (LSMeans) of standardized ileal digestibility (SID) data of Urbaityte et al. (2009).
1 Means are from including either 9 or all 17 AA across 6 ingredients that were tested.
2 Model SID = AA, ingredient, AA level, AA level ingredient.
Three papers are commonly cited for demonstrating the relationship (or lack thereof) between dietary protein concentration and endogenous AA losses, Fan et al. (1995), Eklund et al. (2008a) and Eklund et al. (2008b). Fan et al. (1995) estimated the concentrations of endogenous AA: “Intercepts of the linear regression equations provide the estimated levels of amino acids of endogenous origin. The principle for estimating these levels is illustrated in Figure 1.” The y axis in Fig. 1 of Fan et al. (1995) contains data for the apparent ileal digestible Met, not the ileal AA. It is the ileal AA that should be regressed on dietary AA concentrations to estimate endogenous AA losses (the intercept). Similarly, the x axis in their Figure 2 is mislabeled. Their further calculations that they claim to justify Fig. 7 (Fig. 3 of Fan et al., 1995) are therefore not justified. If the reported data of dietary AA concentrations and apparent ileal digestibility in Tables 1 and 2 of Fan et al. (1995) are used to find ileal AA by difference, then the relationship between ileal AA and dietary AA are found to have cubic, not linear, relationships for all the AA except Met, Cys and His (P < 0.10) (Table 5, Fig. 5). Since the ileal AA = f(dietary AA) is not linear, using the intercepts to estimate endogenous AA is not justified (Table 5).
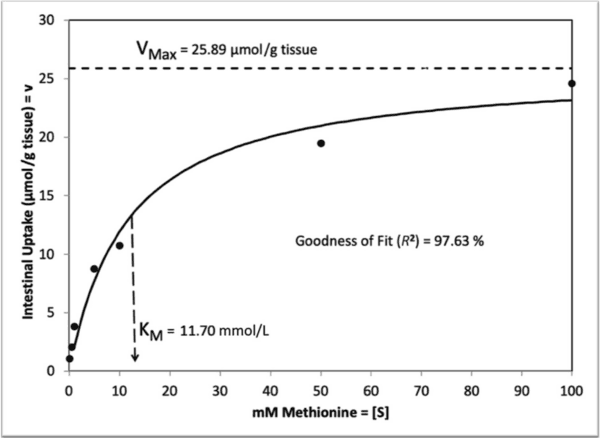
Fig. 6. Relationship between the velocity of intestinal methionine uptake and methionine concentration. Redrawn from Knight and Dibner's Figure 3 (1984). VMax is the maximum velocity of intestinal uptake (v), KM is the Michaelis constant, and [S] is the concentration of the substrate methionine.
Fig. 7. Relationships of true, standardized, apparent amino acid (AA) digestibilities and dietary intake after Stein et al. (2005). The red line represents the best fit standardized digestibility response model, and the blue line represents the best fit apparent digestibility response model.
4.2.3. Statistical misinterpretation of raw data
Although commonly cited for demonstrating the relationship (or lack thereof) between dietary protein concentration and endogenous AA losses, the results of the studies of Eklund et al., 2008a,b are impossible to interpret. The data on responses from different concentrations of AA is presented as least-squares means. Least-squares means are never appropriate for regression data. The presented “means” are already adjusted for some model and readers neither know what that model might be nor any justification to apply least-square means to “continuous”, that is not classification, regression data.
The effects of using least-squares in lieu of arithmetic means can be illustrated using the data of Urbaityte et al. (2009). The seemingly simple question, “What is the average AA SID for the ingredients assayed?” has quite different answers depending on whether arithmetic means or least-squares means are calculated (Table 6) and how many AA are included in the model (Table 7). When only half of the AA were included in the analysis, the least-squares means of AA remaining in the analysis were changed! Least-squares means can clearly be misleading, especially when the reader does not appreciate all influences on their values (Fig. 8). Depending on the model used, there can be no obvious relationship between arithmetic and least-squares means. Least-squares means use should clearly be limited to classification data, never for regressions, and then the model used to weight the least-squares means should be clearly stated. When regression data is calculated using least-squares means the reader can have no idea what the summary data really represents. Least-squares means should only be included in formulation models when the implications of how they were calculated is understood and accounted for.
4.2.4. Misinterpretation of raw data
The purpose of determining SID values is to improve the efficiency of blending ingredients for feed formulation. When SID values are consistently found to be nonsensical, it raises the question of the validity of using SID values at all.
The NRC (2012) report lists SID of 113%, 102%, and 105% for proline in 48% CP SBM, soy protein concentrate and hard wheat, respectively. Standardized ileal digestibility estimates above 100% can only result if the AA in the distal ileum of test pigs (IAAend) are lower than those in the reference pigs (Table 7; basal IAAend, used to determine basal endogenous losses).
SID = [AAintake -- (IAAend -- basal IAAend)]/ AAintake
Therefore, it is clear that whatever physiological activities ingredients might have to increase SID values above 100%. They may only be due to the ability to slow gut passage rates in test pigs versus reference pigs, not their proline or glycine compositions; and not for any excretions that the ingredient stimulates that would be expected to lower AA levels in the test pigs.
Speculation of how assays could result in SID values above 100% have centered around the physiological activities of the feed ingredients (de Lange et al., 1989; Low, 1982; NRC, 2012; Nyachot et al., 1997; Stein et al., 2007b). Feed ingredients that increase mucin production can increase the amount of proline and glycine in the gut (Nyachot et al., 1997). Increasing mucin production would increase the specific endogenous contributions, which is not taken into account when calculating SID (Fig. 9, Stein et al., 2007b). A contributor to proline and glycine digestibility exceeding 100% (NRC, 2012) could also be binding in the gut, taking the AA past the distal ileum without absorption. Pectin (or other gel-forming compounds) present in feed ingredients may bind with bile constituents and not allow for AA reabsorption (de Lange et al., 1989). Bile is high in Pro and Gly (Low, 1982). If that were the case, they would also be expected to increase the error in SID of all other AA in bile.
It is impossible for there to be less than zero concentrations of AA in the digesta of pigs, or perhaps it would be easier to understand that it is impossible for more AA to disappear than were fed. Therefore, the estimates of the basal AA used were not appropriate. Any AA SID values for an ingredient with any SID values greater than 100% are excessive and simply not valid by definition. Standard ileal digestibility values are determined as a component of a single ingredient by definition. If values in excess of 100% are observed because of synergism between ingredients, then the definition does not apply to the results. If the SID value of proline in SBM really is 113%, then the assay itself provides evidence that all estimates of AA digestibility may be high by as much as 13% and there is no way to know which other ones are, or are not, off by 13%.
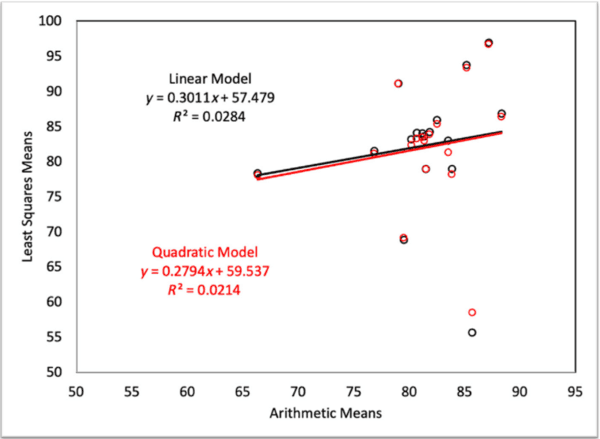
Fig. 8. The (lack of) relationship between arithmetic and least-squares means for average amino acid standardized ileal digestibility values in the study of Urbaityte et al. (2009). The terms Linear and Quadratic in this figure refer to the regression models used to determine the least-squares means in Table 6. The black line represents the best fit linear response model, and the blue line represents the best fit quadratic response model.
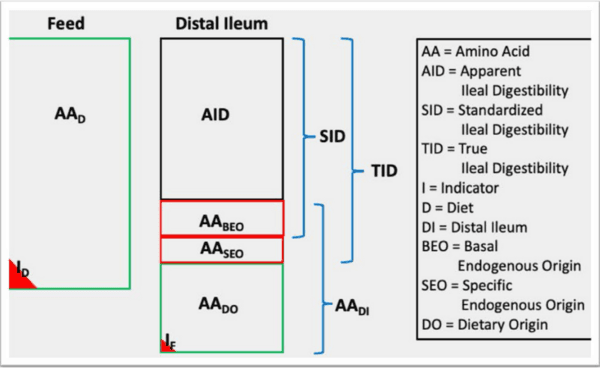
Fig. 9. Graphic depiction of feed ileal digestibility measurements using the nomenclature proposed in Table 7.
4.3. Experimental design and purpose
It should also be noted that the purpose and design of many studies like the one of Urbaityte et al. (2009) were not to determine SID values for application to practical feed formulation. Such experiments were only designed to compare feed ingredients and find differences at some specified level of probability. Least squares means are reported indicating that adjustments have been made for individual pigs and time period, as whenever Latin Square Designs are used. For feed formulation it would be more interesting to know the actual means and confidence intervals for the various AA or crude protein SID. The various measurements in such studies are taken over time and with a few pigs each subjected to the same treatments. It is usually reported that there is variation in the results that may have resulted in differences over time and between pigs, but the actual variation is rarely reported. The least-squares means reported do not reflect the mean with variation from different pigs and time. For feed formulation it would be very helpful to know the magnitude of genetic (pig) variation and how much variation can be expected to have resulted from time (environmental) changes that the pigs were subjected to. Further, knowing the average SID without expected variation is not helpful for formulation since only 50% of diets formulated based on averages would contain the minimal requirement as specified in industry standard linear-programming least-cost feed formulation models.
Table 8
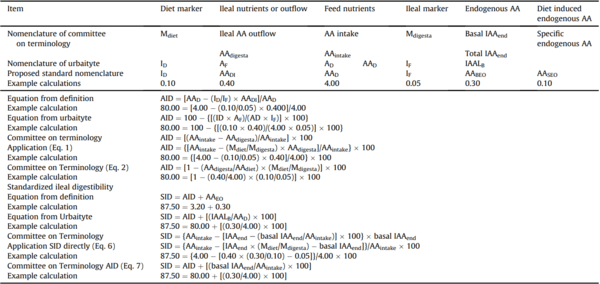
Comparison of terminology used by the Committee on Terminology (Stein et al., 2007), Urbaityte et al. (2009) and definitions of apparent ileal digestibility (AID) and standardized ileal digestibility (SID) for amino acids (AA).
I = indicator, D = diet; DI = distal ileum; EO = endogenous origin; BEO = basal endogenous origin; SEO = specific endogenouse origin; IAAend = the amino acids in the distal ileum.
Rows 2 to 5 contain the abbreviations used by the original authors, e.g. the Committee on Terminology used Mdiet to stand for the diet marker, etc.
4.4. Further research
Taken together, the results presented here and those of Messad et al. (2016) and Zeng et al. (2017) raise serious questions about the additivity of digestible AA values. Messad et al. (2016) demonstrated that the fiber in oilseed meals affects the digestibility of AA in the oilseed meals. Zeng et al. (2017) showed that fiber affects AA digestibility in DDGS as well. Should the fiber in soybean meal, for instance, not then also affect the AA digestibility of AA in the maize in a mixed soy-maize diet? Should not then the fiber and AA concentration in the mixed diet be the critical variables that need to be studied? Further studies, with improved designs and appropriate mathematical and statistical interpretations, could develop the expected AA SID from constituents of the ingredients and concentration fed in mixed diets.
Because of inconsistencies we have observed in the scientific literature, even within the same papers, we suggest the future use of the terminology proposed in Table 8 and illustrated in Fig. 9. It could facilitate understanding between readers and writers.
5. Conclusions
Feed ingredients with higher AA contents have higher SID. The reasons SID = f(AA concentration) are complex since SID measures the product of protein digestion and AA absorption. Protein digestion is subject to MichaeliseMenten enzyme kinetics so SID = f(AA concentration) may be expected, especially for proteins not completely digested at the distal ileum. Other factors influencing SID measurement techniques include the following: 1) difficulties of measuring endogenous losses, especially overestimation; 2) presenting least-squares means that are subject to the statistical model chosen in lieu of arithmetic means; 3) defining basal endogenous losses as unrelated to feed AA concentrations, but then mathematically adjusting basal endogenous losses for feed intake. There are good reasons to standardize assays for comparing bioavailability, that does not eliminate drawbacks from the method decided on. One aspect of current SID AA assays that needs further development is how to apply results determined with different AA concentrations to the concentrations found in practical feeds.


.jpg&w=3840&q=75)