Phytic Phosphorus in Feedstuff
Predict Total and Phytic Phosphorus in Feedstuff by NIRS
Published: September 13, 2011
By: Y. G. Liu, Z. Y. Zhu (Adisseo Asia Pacific Pte Ltd), Cécile Gady and P. A. Geraert (Adisseo France)
ABSTRACT
The primary objectives of this research were to measure total and phytic phosphorus (P) in a range of ingredients and to establish prediction model using near infrared spectroscopy (NIRS). A total of 227 ingredient samples was collected worldwide during one year and most of the sampled ingredients were cereals, cereal byproducts, oilseeds and oilseed meals. All of the samples were analyzed for their total and phytic P contents using mineralization and enzymatic methods, respectively, and their absorbance from 1,100 to 2,500 nm using NIRS. Prediction models were then calculated to determine the correlation of absorbance to both total and phytic P using mPLS regression. The results showed that phytic P ranged from 18% (cassava) to 83% (rice bran) of total P content, with large variations within ingredients in the ratio of phytic P to total P, ranging from 64% to 87% (0.14-0.30) in corn samples, from 64% to 80% (0.16-0.27) in wheat samples, from 66% to 95% (0.54-0.98) in rapeseed meals and from 59% to 69% (0.36-0.57) in soybean meals. NIRS model explained 93% and 92% of the variation measured in total P and phytic P with standard errors of 0.05% and 0.04%, respectively.
Keywords: Phytic phosphorus, NIRS, Feedstuff
INTRODUCTION
It is known that the contents of both total phosphorus (P) and phytic P carry substantial degrees of variation within the same ingredients as well as among different feedstuff (Tran and Skiba, 2005). The feed industry often over-formulates inorganic source of P in animal diets due to lack of reliable assessment on phytic P contents. For instance, for laying hens, research published during the last decade estimated that the true requirements of available P (av.P) or non-phytic P (NPP) appear to be adequate between 150 and 200 mg/hen/day, which is substantially lower than the actual dietary supplies in the industry from 350 mg to 500 mg/hen/day (Keshavarz, 2000). The over-supply of NPP in the layer diets is estimated as much as 40-50% or even higher, which is neither economical nor environmentally correct. The main reason for the over-formulation is due mainly to inability to determine actual phytic P contents in the feed ingredients. Thus, there is a considerable interest in obtaining accurate data of phytic and non-phytic P in major feedstuff. On the other hand, reliable and rapid assessment on phytate P contents in feed ingredients remains a real challenge.
The main objectives of this study were to measure phytic P ratio to the total P in a range of ingredients and to investigate feasibility to predict P variations by Near Infrared Reflectance Spectroscopy (NIRS).
MATERIALS & METHODS
We collected 227 samples from world-wide mainly representing cereals, cereals byproducts, oilseeds and oilseed meals. All samples were analysed for their concentrations of total P (pR NF EN 15510) by mineralization and detection with Inductively Coupled Plasma (ICP)- Optical Emission Spectrometry (OES), and phytic P was analysed using an enzymatic methods which involves extraction of inositol phosphates followed by treatment with a 6-phytase that is specific for phytic acid (IP6) and the lower myoinositol forms. Subsequent treatment with alkaline phosphatase ensures the release of the final phosphate myo-inositol phosphate (IP1) which is relatively resistant to the action of phytase. These samples were further also analysed for their NIRS absorbance from 1100 to 2500 nm, to determine correlation between absorbance to both total and phytic P. NIRS calibrations were then developed with mPLS regression.
RESULTS AND DISCUSSION
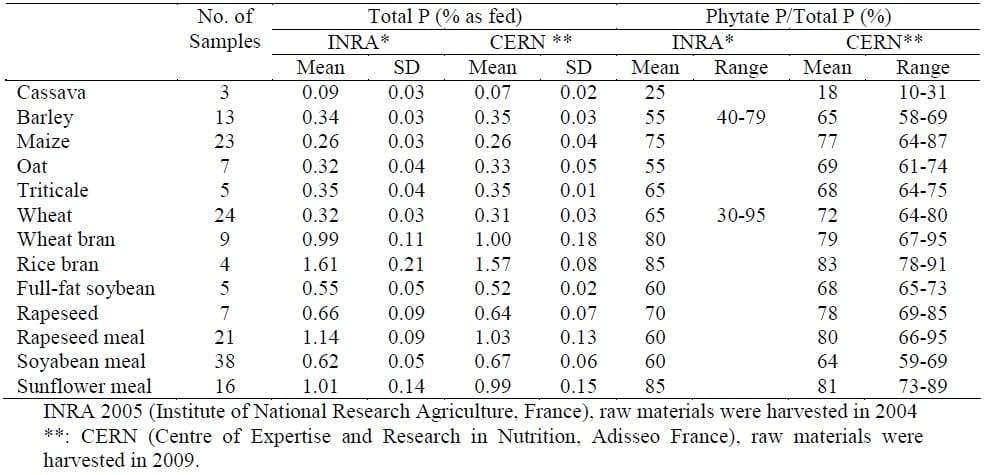
Results in Table 1 showed that phytic P contents ranged from 18% (cassava) to 83% (rice bran) of the total P content, with large variations intra-species in the ratio phytic P/total P ranging from 64 to 87% (0.14-0.30) in corn, from 64 to 80% (0.16-0.27) in wheat, from 66 to 95% (0.54-0.98) in rapeseed meals and from 59 to 69% (0.36-0.57%) in soybean meal. These results are well in line with data published by Tran and Skiba (2005).
Table 1: Variability of total P and phytic P contents in raw materials (CERN) comparing with INRA data.
RESULTS AND DISCUSSION
Results in Table 1 showed that phytic P contents ranged from 18% (cassava) to 83% (rice bran) of the total P content, with large variations intra-species in the ratio phytic P/total P ranging from 64 to 87% (0.14-0.30) in corn, from 64 to 80% (0.16-0.27) in wheat, from 66 to 95% (0.54-0.98) in rapeseed meals and from 59 to 69% (0.36-0.57%) in soybean meal. These results are well in line with data published by Tran and Skiba (2005).
Table 1: Variability of total P and phytic P contents in raw materials (CERN) comparing with INRA data.
NIRS calibrations explained 93 and 92% of the variations measured in total and phytic P with standard error of 0.05 and 0.04%. When comparing non-phytic phosphorus calculated from chemistry vs. NIRS of samples external to database, we confirmed differences by 0.01, 0.02, 0.07 and 0.02%, respectively for corn, wheat, rapeseed meals and soybean meals, respectively.
Fig. 1 shows correlation between NIRS prediction and lab analytical values. These preliminary results suggest that NIRS prediction models able to explain 93 and 92% of the variations measured in total P and phytate P with standard errors 0.05% and 0.04%, respectively.
We ran independent validation with 8 external samples of soybean meal (SBM). The lab analyses showed the average contents of total P 6.2 g/kg and phytic P 3.7 g/kt as 60% of total P, with variations found for both total and phytic P contents among these SBM samples. Comparing with calculation based on book values, the NIRS prediction results are closer to the lab analytical values (SEP 0.07 vs. 0.04).
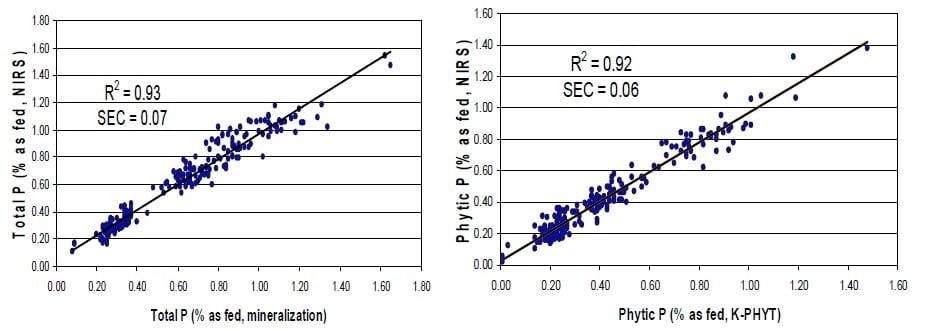
Figure 1a. NIRS calibration of total P, and 1b. phytate P (%, as fed)
This study confirmed the need for better assessment on major ingredients for their nonphytic phosphorus contribution to feed formulation. With respect to the range measured among ingredients, this preliminary study suggests that the NIRS may contribute to better measuring the true contents of total and phytic P in major feed ingredients.
REFERENCES
Keshavarz K. 2000. Nonphytate phosphorus requirement of laying hens with and without phytase on a phase feeding program. Poult. Sci. 79:748-763.
Tran G. and F. Skiba, 2005. Variabilité inter et intra matière première de la teneur en phosphore total et phytique et de l´activité phytasique. INRA Prod. Anim. 18 (3), 159-168.
Related topics:
Authors:

Adisseo

Adisseo

Adisseo

Adisseo
Show more
Recommend
Comment
Share

10 de marzo de 2012
This article will help to achieve better results.
Recommend
Reply

14 de septiembre de 2011
Good article and it will certainly help nutritionist to optimize feed formulation for best results and economy.
Recommend
Reply

Would you like to discuss another topic? Create a new post to engage with experts in the community.


You may be interested in
.jpg&w=3840&q=75)
Evonik Animal Nutrition