Description of problem
Feed ingredients and feed manufacturing account for 60 to 70% of production costs in an integrated poultry operation. Modern commercial broilers are fed predominately pelleted diets, and researchers have demonstrated how improving pellet quality (PQ), by increasing the percentage of pellets in the diet, further enhances bird performance (Proudfoot and Sefton, 1978; Dozier et al., 2010; Corzo et al., 2011; Lilly et al., 2011; Glover et al., 2016; Lemons and Moritz, 2016). Improving PQ can be achieved using numerous documented manufacturing techniques (Skoch et al., 1981; Behnke, 1994; Angulo et al., 1996; Behnke, 1996; Buchanan and Moritz, 2009); however, there is reluctance to adopt feed manufacturing practices that improve PQ due to lack of association between PQ, bird performance, and overall economics. In addition, the complexity of feed manufacturing coupled with throughput demands often supersedes the use of manufacturing strategies known to enhance PQ. Therefore, new perspectives and additional data supporting an investment in PQ are required.
Diet uniformity is an important aspect of feed production (
Wilcox and Balding, 1986;
Beumer, 1991) and must be managed at the feed mill.
Stark et al. (1991) studied mixer CV using salt as a tracer and reported that 58% of the farm mixers surveyed in 1991 did not meet the industry standard CV of less than 10%. On-farm nutrient segregation may be exacerbated with elevated mixer CV.
McCoy et al. (1994) conducted 2 broiler experiments and reported that FI, BW, and feed efficiency were affected by diet uniformity. These data support improved mixer CV but do not provide insight to how nutrients segregate from the feed mill to the feed pan. Therefore, understanding on-farm nutrient segregation is important.
It has been suggested that improving PQ may reduce nutrient segregation (
Scheideler, 1991;
Behnke, 1996;
Moritz, 2013;
Wamsley, 2014;
Sellers et al., 2020), but more research is warranted. Feed, made up of pellets and fines, may segregate in the feed truck during transportation, within feed bins, and within feed lines during feed augering (
Moritz, 2013). The result is variability in pellet-to-fine ratios (P:F) in feed pans.
Lilly et al. (2011) reported that increasing the percentage of pellets in the diet from 30 to 60 and 90% increased FI and BWG. Similarly,
McKinney and Teeter (2004) reported that broilers exhibited greater weight gain and improved feed conversion when fed 100% pellets compared with those fed 20% pellets. However, FI was not affected.
The segregation of feed particles may contribute to uneven distribution of nutrients in commercial feed delivery systems.
Tang et al. (2006) observed that smaller particles
Walk et al., 2013 (< 1,180 μm) in
mash feed were more nutrient dense than larger particles and percolated to the bottom of the
feed trough in commercial layer houses. Feed augering led to forced selection of certain mash particles and nutrients, consequently affecting layer performance. More recently,
Sellers et al. (2020) investigated the effects of feed augering on nutrient segregation using feeds differing in P:F and liquid application method of oil and
phytase. These authors observed increased phytase activity in feed pans with greater amounts of fines when augering treatments with postpellet applied phytase. Results from this study suggest that phytase availability may be dependent on feed pan location and that phytase may serve as a suitable nutrient segregation marker. However, the effects of feed augering were only considered in 58-m feed lines. Perhaps, the magnitude of feed particle and nutrient segregation differs when feed is augered different lengths, such as feed lines extending the length of the house compared with split (middle house fed) lines that extend from the center of the house to either end.
Sellers et al. (2020) also suggested that other nutrients may segregate. Considering the importance of amino acid nutrition in modern broiler production, it may be reasonable to study amino acids segregation in commercial feed lines.
Therefore, 4 experiments were conducted to study nutrient segregation using feeds differing in pellet quality (poor pellet quality (PPQ) vs. improved pellet quality (IPQ)) when augered through commercial broiler houses differing in feed line length (152-m vs. 76-m). The objectives of this study were to determine how pellets and fines travel throughout commercial broiler houses, and if feed line length and PQ affected the degree of phytase and amino acid segregation within various regions of the feed line.
Materials and methods
Experimental Design
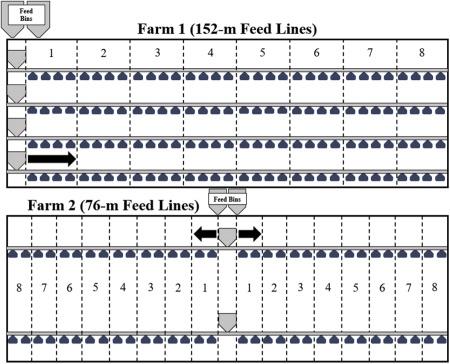
The present study consisted of 4 experiments (Exp). Experiment 1 (Exp1) considered how PPQ feed contributed to nutrient segregation throughout a 152-m feed line using 8 predetermined regions, defined by the number of feed pans (Figure 1). A given region in Exp1 consisted of 24 feed pans. Experiment 2 (Exp2) mimicked Exp1 but considered how IPQ feed contributed to nutrient segregation in a 152-m feed line. Experiment 3 (Exp3) measured how PPQ feed contributed to nutrient segregation in a 76-m feed line using 8 regions with 12 feed pans per region (Figure 1). Experiment 4 (Exp4) mimicked Exp3 but considered how IPQ feed influenced nutrient segregation in a 76-m feed line. Herein, experiments will be labeled as follows:
Exp1 (PPQ -- 152m)
Exp2 (IPQ -- 152m)
Exp3 (PPQ -- 76m)
Exp4 (IPQ -- 76m)
Figure 1. Diagram of replicate feed line regions at each farm. Commercial houses at farm 1 consisted of 4 152-m-long feed lines equipped with 192 feed pans per line. Eight regions were created to define nutrient segregation. Each region consisted of 24 feed pans, with region 1 starting at the feed hopper and region 8 ending at the feed line motor. In the diagram, a single feed pan represents 6 feed pans. The 152-m-long commercial house at farm 2 consisted of 2 rows of split (middle house fed) feed lines, creating 4 76-m-long feed lines with 95 feed pans per line. Feed was augered into centrally located feed hoppers and pulled to either end of the house. Each region consisted of 12 feed pans, once again with region 1 starting at the feed hopper and region 8 ending at the feed line motor. Arrows indicate feed flow direction at each farm.
The experimental unit was defined as the pans of feed in a region. Each Exp included 4 replicate feed lines broken into the 8 aforementioned regions, creating 32 systematic experimental units.
Phytase activity, pellet survivability, and percentage of pellets were analyzed from 4 replicate feed lines per Exp. Amino acid concentration was analyzed from 3 replicate feed lines due to cost and time associated with laboratory analysis.
Experimental Diet Preparations
Two nutritionally identical commercial broiler finisher diets were manufactured at a commercial feed mill (Wenger Feeds, Spring Glen, PA). Each diet was manufactured using techniques known to produce pellets of poor or improved quality. Ingredients were mixed in a Hayes and Stolz twin shaft, single ribbon mixer with a 3.175-tonne capacity and CV of 5% at mixing. Dry ingredients were mixed for 15 s followed by liquid ingredient addition and mixing for 75 s. Steam conditioning was applied for 30 s in a 609.6 × 2,438.4 mm conditioning barrel powered by a 20-HP motor before passing through a 200-HP Sprout 615 pellet mill equipped with a 4.37 × 50.80 mm effective die. Pellets were dried and cooled in a counterflow cooler (California Pellet Mills Inc., Crawfordsville, IN). To create feed varying in PQ, steam conditioning temperature and motor amperage were manipulated. A steam conditioning temperature of 65.5°C and motor amperage of 200 Amps were used to create the PPQ feed. Average production rate of PPQ feed was 11.430 tonne/h. To create the IPQ feed, steam conditioning temperature and motor amperage were 81.1°C and 160 Amps, respectively. Average production rate of IPQ feed was 11.884 tonne/h. Soybean oil and 400 FTU/kg phytase (Quantum Blue, AB Vista, Marlborough, Wiltshire, UK) were applied postpelleting for both PPQ and IPQ feeds.
Diets were transported to Penn State's Poultry Education and Research Center and augered into separate bulk bins. Both the PPQ and IPQ feeds were systematically augered out of the feed bins, into 22.68 kg bags, and split into uniform allotments varying in size based on feed line length and capacity at each farm. For instance, allotments destined for a farm with 152-m feed lines consisted of 453.6 kg of feed and allotments destined for a farm with 76-m feed lines consisted of 226.8 kg of feed. Systematic feed augering accounted for feed segregation in feed bins. In total, 4 allotments of PPQ feed and 4 allotments of IPQ feed were transferred to each cooperator farm. An additional 453.6 kg allotment of PPQ and IPQ feeds were sifted using a modified particle size separator (Modified Penn State Particle Separator, Agricultural and Biological Engineering Department, University Park, PA) fitted with a No. 5 American Society for Testing and Materials screen to determine P:F of each PQ. Pellets from the PPQ and IPQ allotments were used to determine descriptive pellet durability metrics. These data confirmed that differences in manufacturing technique resulted in diets differing in PQ (
Table 1).
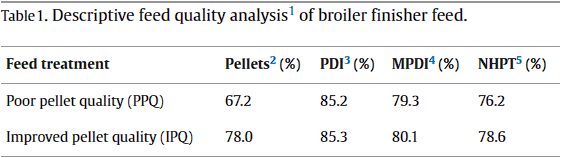
1 Descriptive feed quality analyses were conducted at Penn State Poultry Education and Research Center following feed manufacturing and before feed transport to cooperator farms.
2 Percentage of pellets was determined using a modified particle size separator (Modified Penn State Particle Separator, Agricultural and Biological Engineering Department, University Park, PA) fitted with a No. 5 American Society for Testing and Materials screen.
3 PDI = pellet durability index; percentage was determined by inserting 500-g samples of sifted pellets into a P:Fost tumbler (Seedburo Equipment Co., Des Plaines, IL). Samples tumbled for 10 min at 50 rpm. After tumbling, the sample was sifted and weighed.
4 MPDI = modified pellet durability index; percentage was determined similar to PDI but was modified by adding 5 hexagonal nuts to the 500-g samples before tumbling.
5 NHPT = Pellet survivability was determined by placing 100-g samples of sifted pellets into the New Holmen Pellet Tester (NHPT100; TekPro Ltd., North Walsham, Norfolk, UK). The pellets were subjected to air flow for 30 s within the test chamber. The surviving pellets were then removed and weighed.
Farm 1: 152-m Feed Lines
Feed Sampling Procedure
The first cooperator farm consisted of 2 commercial broiler houses, built at the same time with identical floor plans. Each house was equipped with 4 152-m-long feed lines and 192 Cumberland Hi-Lo Classic (Cumberland, AGCO Corporation, Duluth, GA) feed pans per line. It should be noted that feed lines were empty, and no birds were in either house during feed sample collection. A commercial feed truck was used to vacuum feed from bulk bags and blow feed into the onsite feed bins. Logistics demanded the PPQ feed be blown into the feed bins of house 1 for Exp1 (PPQ-152m), whereas the IPQ feed be blown into feed bins of house 2 for Exp2 (IPQ-152m). One 453.6 kg allotment of feed was blown into the feed bin and then augered through a single feed line to fill respective feed pans. This was repeated until all 4 replicate feed lines and feed pans were filled. The same methods were used in each house for each Exp, regardless of PQ. Feed samples were collected from each feed pan, for each of the 4 replicate feed lines per Exp. In total, 768 feed samples were taken from each Exp (Exp1(PPQ-152m) and Exp2 (IPQ-152m)).
Farm 2: 76-m Feed Lines
Feed Sampling Procedure
The second cooperator farm consisted of a single broiler house equipped with 2 rows of split (middle house fed) feed lines, where feed was augered into centrally located feed hoppers and pulled to either end of the barn. This created 4 76-m-long feed lines with 95 Cumberland Hi-Lo Classic (Cumberland, AGCO Corporation, Duluth, GA) feed pans per line. Once again, feed lines were empty and there were no birds in the house. The same commercial feed truck was used to vacuum feed from bulk bags and blow feed into the onsite feed bin. Considering this farm had only one house, Exp3 (PPQ-76m) was conducted and then followed by Exp4 (IPQ-76m). One 226.8 kg allotment of feed was used to fill a single feed line and feed pans. This was repeated until all 4 replicate feed lines and feed pans were filled. Feed samples were taken from every feed pan for each of the 4 replicate feed lines. In total, 380 feed samples were taken from each Exp (Exp3 (PPQ-76m) and Exp4 (IPQ-76m)).
Feed Sample Analysis
A total of 1,536 feed samples from Exp1 (PPQ-152m) and Exp2 (IPQ-152m), and 760 feed samples from Exp3 (PPQ-76m) and Exp4 (IPQ-76m) were transported to Penn State's Poultry Education and Research Center for nutrient segregation analysis. Although feed samples were collected at each feed pan for each Exp, the 8 regions per feed line were used to quantify nutrient segregation throughout feed lines. All feed samples were randomly passed through a modified particle size separator to determine P:F. Sifted pellet samples were collected from every 10th feed pan to be analyzed for pellet survivability using the New Holmen Pellet Tester (New Holmen's Pellet Tester, TekPro Ltd., Norfolk, UK). Descriptive data for percentage of pellets in each Exp are presented in Figures 2 and 3. Resulting pellets and fines were collected separately from feed pans located in 8 predetermined regions of each feed line. Pellets and fines from these regions were analyzed separately for amino acid concentration (AOAC, 2005) and phytase activity (AOAC, 2000) at commercial laboratories (Eurofins Scientific, Des Moines, IA and Agricultural Experiment Station Chemical Laboratories, Columbia, MO). Amino acid concentration and phytase activity results from respective pellets and fines analyses were applied to the percentage of pellets and fines results within a region. Applying amino acid and phytase activity results to actual pellet and fine percentages allowed the authors to quantify nutrients present in feed pans in a given region.
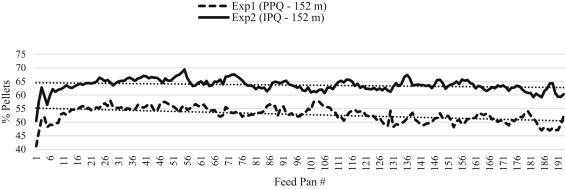
Figure 2. Descriptive depiction of percentage of pellets in feed pans across 152-m feed lines. Percentage of pellets was determined using a modified particle size separator (Modified Penn State Particle Separator, Agricultural and Biological Engineering Department, University Park, PA) fitted with a No. 5 American Society for Testing and Materials screen. For each experiment, the percentage of pellets in feed pans across the 152-m feed line have been fitted with trendlines to describe general feed flow trends.
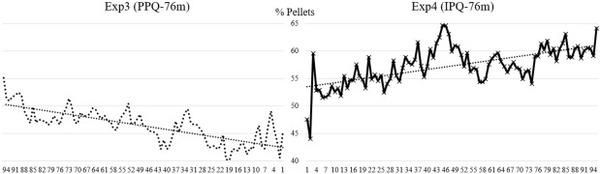
Figure 3. Descriptive depiction of percentage of pellets in feed pans across 76-m feed lines. Percentage of pellets was determined using a modified particle size separator (Modified Penn State Particle Separator, Agricultural and Biological Engineering Department, University Park, PA) fitted with a No. 5 American Society for Testing and Materials screen. For each experiment, the percentage of pellets in feed pans across the 76-m feed line have been fitted with trendlines to describe general feed flow trends.
Statistical Analysis
Each Exp (Exp1 – Exp4) was analyzed using the GLM procedure of SAS version 9.4 (SAS Inst. Inc., Cary, NC). Phytase activity, percentage of pellets, and pellet survivability were analyzed from 4 replicate feed lines per Exp while amino acid concentrations were analyzed from 3 replicate feed lines per Exp. One-way ANOVA tests were performed for each Exp, and Fisher's least significant difference test was used to separate means when P < 0.05. Separate analyses were conducted using Student t-tests (α = 0.05) to determine how PQ and feed line length contributed to nutrient segregation. Here, means were expected to be similar because identical diets were used across all Exp. Therefore, SD were included and used to discuss nutrient variability in the scenarios below:
152 -- m : PPQ vs. IPQ
76 -- m : PPQ vs.IPQ
PPQ : 152 -- m vs. 76 -- m
IPQ : 152 -- m vs.76 -- m
Results and discussion
Experiment 1 (PPQ-152m)
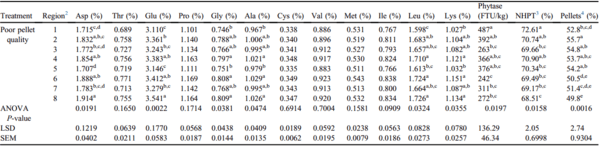
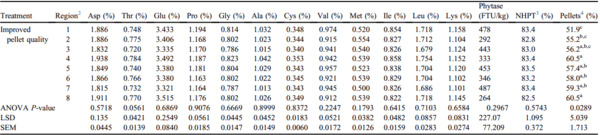
Nutrient segregation was apparent when PPQ feed was augered through 152-m feed lines (Table 2). Amino acid segregation was demonstrated by the varying concentrations of 6 individual amino acids measured throughout the 8 regions of the feed line. Aspartate concentrations varied by 10.8% (P = 0.0191), glutamate by 12.8% (P = 0.0022), glycine by 7.8% (P = 0.0381), leucine by 7.4% (P = 0.0324), alanine by 6% (P = 0.0474), and lysine by 9.4% (P = 0.0355) across the 8 regions of the feed line (Table 2). Phytase segregation was also apparent when PPQ feed was augered through 152-m feed lines (Table 2). Phytase activity varied by 50.3% across the 8 regions of the house (P = 0.0197). In addition, pellet survivability varied across regions of the feed line, described by a 5.6% difference between regions 1 and 8 (P = 0.0158; Table 2). Percentage of pellets differed throughout the house, decreasing as the feed traveled from region 1 to region 8 (P = 0.0016; Table 2). Descriptive data on the percentage of pellets throughout 152-m feed lines are plotted in Figure 2. This decrease in pellet survivability is likely attributed to mechanical forces acting on the pellets as feed travels through the feed line. These data are supported by previous findings in field studies that demonstrated a decrease in pellet survivability was followed by a decrease in percentage of pellets (Scheideler, 1991; Moritz, 2013; Wamsley, 2014).
Table 2. Effects of PPQ feed on nutrient
1 segregation across 8 regions of a 152-m feed line (Exp1 PPQ-152m).
a-eMeans within a column with no common superscripts differ significantly (P < 0.05).
Abbreviation: PPQ, poor pellet quality.
1 Nutrients were analyzed at the University of Missouri Agricultural Experiment Station Chemical Laboratory. Amino acid concentrations were analyzed using AOAC 994.12. Phytase activity was analyzed using AOAC 2000.12.
2 Each region of the feed line was composed of 24 feed pans with region 1 starting at the feed hopper and region 8 ending at the feed line motor.
3 NHPT = Pellet survivability was determined by placing 100-g samples of sifted pellets into the New Holmen Pellet Tester (NHPT100; TekPro Ltd., North Walsham, Norfolk, UK). The pellets were subjected to air flow for 30 s within the test chamber. The surviving pellets were then removed and weighed.
4 Pellets = Percentage of pellets determined using a modified particle size separator (Modified Penn State Particle Separator, Agricultural and Biological Engineering Department, University Park, PA) fitted with a No. 5 American Society for Testing and Materials screen.
An uneven distribution of pellets may affect bird growth and flock uniformity. Sellers and cohorts (2020) investigated nutrient segregation in a commercial broiler house and its impact on broiler performance. These researchers found that percentage of pellets decreased as feed traveled down the feed line, and birds fed diets that were augered from 0 to 30 m of the feed line exhibited a 3 g increase in BW at 42 d compared with birds fed diets augered from 32 to 58 m. This increase in BW was likely due to higher proportions of pellets in the diet augered from 0 to 30 m compared with the diet augered from 32 to 58 m. Data from the present study indicate that augering PPQ feed through a 152-m-long feed line contributes to an uneven distribution of pellets, amino acids (aspartate, glutamate, glycine, alanine, leucine, and lysine), and phytase activity throughout the house.
Experiment 2 (IPQ-152m)
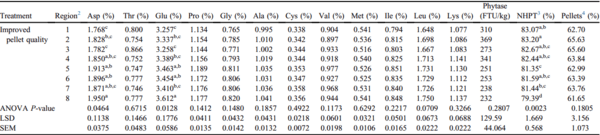
When IPQ feed was augered through 152-m feed lines, only aspartate and glutamate concentrations varied (P = 0.0464 and P = 0.0128, respectively; Table 3). Variation in surviving pellets was evident throughout the house, explained by a 4.6% difference across the 8 regions of the feed line (P = 0.0023; Table 3). Phytase activity and percentage of pellets were not different across the 8 regions of the 152-m feed line (P > 0.05; Table 3). Improved pellet quality feed minimized amino acid segregation and eliminated phytase activity segregation when feed was augered long distances.
Table 3. Effects of IPQ feed on nutrient
1 segregation across eight regions of a 152-m feed line (Exp2 IPQ-152m).
a-dMeans within a column with no common superscripts differ significantly (P < 0.05).
Abbreviations: IPQ, improved pellet quality.
1 Nutrients were analyzed at the University of Missouri Agricultural Experiment Station Chemical Laboratory. Amino acid concentrations were analyzed using AOAC 994.12. Phytase activity was analyzed using AOAC 2000.12.
2 Each region of the feed line was composed of 24 feed pans with region 1 starting at the feed hopper and region 8 ending at the feed line motor.
3 NHPT = Pellet survivability was determined by placing 100-g samples of sifted pellets into the New Holmen Pellet Tester (NHPT100; TekPro Ltd., North Walsham, Norfolk, UK). The pellets were subjected to air flow for 30 s within the test chamber. The surviving pellets were then removed and weighed.
4 Pellets = Percentage of pellets determined using a modified particle size separator (Modified Penn State Particle Separator, Agricultural and Biological Engineering Department, University Park, PA) fitted with a No. 5 American Society for Testing and Materials screen.
Nutrient density has a substantial impact on the growth and development of broilers, which may affect broiler production economics (
Mabray and Waldroup, 1981;
Reece and McNaughten, 1982;
Campbell et al., 1988). Manipulating nutrient density has also been shown to affect growth performance and meat yield (
Jones and Wiseman, 1985). It is well documented that feeding diets variable in amino acid density contributes to differences in bird performance (
Kidd et al., 1998;
Kidd et al., 2004;
Corzo et al., 2005;
Dozier et al., 2008).
Kidd et al. (1998) reported increased carcass and breast yield in broilers fed starter and
grower diets that were formulated to 115 and 125% of the NRC lysine recommendations, respectively, compared with birds fed the same
starter diet but were fed a grower diet that was formulated to 85% of the NRC lysine recommendations.
Corzo et al. (2005) fed broilers varying levels of amino acids and reported increased BW and decreased FCR in birds fed the high amino acid dense diets compared with those fed the low amino acid dense diets. Based on previous research and data from the present study, minimizing nutrient segregation across the feed line may lead to more precise amino acid concentrations, thereby optimizing bird performance.
Experiment 3 (PPQ-76m)
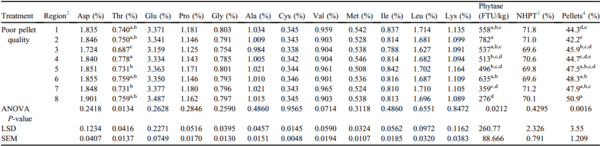
Threonine was the only amino acid whose concentration varied across the 8 regions of the 76-m feed line when using PPQ feed (P = 0.0134; Table 4). Phytase segregation was evident in this Exp, varying by 64.7% between regions 2 and 8 of the 76-m feed line (P = 0.0212; Table 4). These data suggest that the amount of phytase birds receive may be dependent on feed line region. Feeding diets with higher phytase levels to broilers has been shown to improve broiler performance (Pirgozlev et al., 2011), which may be due to the reduction of the antinutritive effect of phytate. Super dosing of phytase is thought to not only increase bound phosphorus utilization, but utilization of all dietary nutrients, which can improve overall performance (Shirley and Edwards, 2003). Pieniazek et al. (2017) found that birds fed diets with a phytase inclusion of 2,000 U/kg had significantly higher day 42 BW compared with birds fed diets with a phytase inclusion of 500 U/kg. In addition, it was observed that feed consumption increased linearly as phytase inclusion increased. It has also been reported that standard doses of phytase improve BWG, feed efficiency, nutrient utilization, and bone mineralization in broilers fed diets containing reduced available P (Leske and Coon, 1999; Selle et al., 2012). Walters et al. (2019) evaluated the extra phosphoric effects of a novel phytase and observed that broilers fed negative control (NC) diets, deficient in calcium and available phosphorus, had decreased BWG and tibia ash compared with birds fed the same NC diet supplemented with phytase. The phytase activity variability in PPQ feed across the 76-m feed line may contribute to insufficient mineral digestion and absorption, ultimately affecting performance.
Table 4. Effects of PPQ feed on nutrient
1 segregation across 8 regions of a 76-m feed line (Exp3 PPQ-76m).
a-eMeans within a column with no common superscripts differ significantly (P < 0.05).
Abbreviation: PPQ, poor pellet quality.
1 Nutrients were analyzed at the University of Missouri Agricultural Experiment Station Chemical Laboratory. Amino acid concentrations were analyzed using AOAC 994.12. Phytase activity was analyzed using AOAC 2000.12.
2 Each region of the feed line was composed of 12 feed pans with region 1 starting at the feed hopper and region 8 ending at the feed line motor.
3 NHPT = Pellet survivability was determined by placing 100-g samples of sifted pellets into the New Holmen Pellet Tester (NHPT100; TekPro Ltd., North Walsham, Norfolk, UK). The pellets were subjected to air flow for 30 s within the test chamber. The surviving pellets were then removed and weighed.
4 Pellets = Percentage of pellets determined using a modified particle size separator (Modified Penn State Particle Separator, Agricultural and Biological Engineering Department, University Park, PA) fitted with a No. 5 American Society for Testing and Materials screen.
Percentage of pellets also varied by 17.1% throughout the feed line and tended to increase as feed traveled from region 1 to region 8 (
P = 0.0016;
Table 4). This is depicted in
Figure 3 which includes descriptive data on percentage of pellets throughout 76-m feed lines. Augering PPQ feed through a shorter feed line may contribute to a greater degree of fines segregation, resulting in a greater proportion of intact pellets at the end of the feed line. However, these data only represent a snapshot in time. Additional research studying nutrient composition in feed pans throughout the grow-out period is necessary.
Experiment 4 (IPQ-76m)
Amino acid and phytase segregation were not apparent when augering the IPQ feed through 76-m-long feed lines (P > 0.05; Table 5). Percentage of pellets was the only measured variable that differed across the 8 regions of the feed line (P = 0.0289; Table 5). As discussed previously, variation in P:F contributes to differences in bird performance and subsequent flock uniformity. However, improving PQ on farms with split (middle house fed) feed lines may eliminate the differences in bird performance associated with varying amino acid densities (Kidd et al., 2004; Corzo et al., 2005; Dozier et al., 2008) and phytase activities (Cowieson et al., 2011; Karimi et al., 2013; Pieniazek et al., 2017; Walters et al., 2019; Smith et al., 2019). Moreover, these data suggest that broiler performance field trials evaluating PQ improvements should be conducted in barns with split (middle house fed) feed lines to eliminate confounding effects such as amino acid and phytase activity segregation.
Table 5. Effects of IPQ feed on nutrient
1 segregation across 8 regions of a 76-m feed line (Exp4 IPQ-76m).
a-cMeans within a column with no common superscripts differ significantly (P < 0.05).
Abbreviation: IPQ, improved pellet quality.
1 Nutrients were analyzed at the University of Missouri Agricultural Experiment Station Chemical Laboratory. Amino acid concentrations were analyzed using AOAC 994.12. Phytase activity was analyzed using AOAC 2000.12.
2 Each region of the feed line was composed of 12 feed pans with region 1 starting at the feed hopper and region 8 ending at the feed line motor.
3 NHPT = Pellet survivability was determined by placing 100-g samples of sifted pellets into the New Holmen Pellet Tester (NHPT100; TekPro Ltd., North Walsham, Norfolk, UK). The pellets were subjected to air flow for 30 s within the test chamber. The surviving pellets were then removed and weighed.
4 Pellets = Percentage of pellets determined using a modified particle size separator (Modified Penn State Particle Separator, Agricultural and Biological Engineering Department, University Park, PA) fitted with a No. 5 American Society for Testing and Materials screen.
Pellet Quality and Feed Line Length Means
Additional analyses, Student t-tests, were performed and provided nutrient means for feed line length and PQ. As previously mentioned, identical diets were used in all 4 Exp. Therefore, differences in amino acids were not expected or prevalent. There were a few instances where amino acid means differed; however, these differences were inconsistent. The SD were provided to show nutrient variability in feed lines of different lengths and feeds differing in PQ.
PQ Means in 152-m Feed Lines
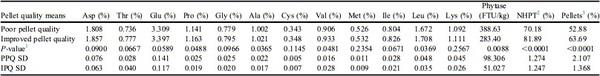
Poor pellet quality feed contributed to higher SD in aspartate, glutamate, proline, glycine, alanine, methionine, isoleucine, leucine, and lysine concentrations compared with that of IPQ feed when augered through 152-m feed lines (Table 6). The SD was also higher for phytase activity, pellet survivability, and percentage of pellets throughout the feed line when using PPQ feed compared with using IPQ feed (Table 6). These data further support the use of manufacturing techniques that improve PQ to reduce the variability of nutrients throughout the house.
Table 6. Pellet quality means after augering feed through a 152-m feed line.
Abbreviations: IPQ, improved pellet quality; PPQ, poor pellet quality.
1 Student t-tests P-value.
2 NHPT = Pellet survivability was determined by placing 100-g samples of sifted pellets into the New Holmen Pellet Tester (NHPT100; TekPro Ltd., North Walsham, Norfolk, UK). The pellets were subjected to air flow for 30 s within the test chamber. The surviving pellets were then removed and weighed.
3 Pellets = Percentage of pellets determined using a modified particle size separator (Modified Penn State Particle Separator, Agricultural and Biological Engineering Department, University Park, PA) fitted with a No. 5 American Society for Testing and Materials screen.
The PQ means for PPQ and IPQ feeds augered through 152-m feed lines are found in
Table 6. It was evident that IPQ feed had higher mean percentage of pellets (
P < 0.0001;
Table 6) and mean pellet survivability (
P < 0.0001;
Table 6), confirming that feed manufacturing strategies to create feed treatments differing in PQ were successful. Interestingly, the IPQ feed resulted in lower mean phytase activity compared with the PPQ feed (
P = 0.0088;
Table 6). It is documented that phytase efficacy can be better described by bird performance and tibia ash because of the variability within the phytase activity assay (
Loop et al., 2012). However, no birds were present in the present study and in vitro phytase activity. 12) was the only means of measuring phytase segregation. These data represent P:F calculations and phytase activity of pellets and fines, resulting in average phytase activity in a given region. Because phytase was applied post-pelleting, a greater phytase activity was observed when analyzing the fines for both the PPQ and IPQ feeds. These findings align with
Sellers et al. (2020) who reported that phytase activity increased in feed pans with decreased pellets and increased fines. These authors speculate that when phytase is applied post-pelleting, deterioration to the outside of the pellet causes phytase to slough off, allowing phytase to segregate into the fines. Additional applied research is needed to understand potential phytase segregation when phytase is added at the mixer.
PQ Means in 76-m Feed Lines
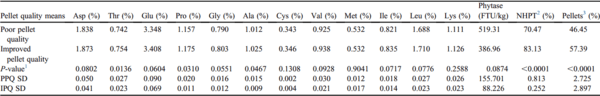
The mean pellet survivability and percentage of pellets were higher for the IPQ feed compared with PPQ feed when augered through 76-m feed lines (P < 0.0001; Table 7). Augering PPQ feed through 76-m feed lines increased the degree of nutrient segregation, noted by higher SD for aspartate, threonine, glutamate, proline, glycine, alanine, valine, isoleucine, leucine, and lysine concentrations compared with that of the IPQ feed (Table 7). Phytase activity, pellet survivability, and percentage of pellets also exhibited higher SD across the 8 regions when augering PPQ feed through 76-m feed lines compared with IPQ feed (Table 7). Data from Tables 6 and 7 reveal that increasing the percentage of pellets in the diet leads to less variation in amino acid concentration, phytase activity, percentage of pellets, and surviving pellets when augering feed throughout the house regardless of feed line length.
Table 7. Pellet quality means after augering feed through a 76-m feed line.
Abbreviations: IPQ, improved pellet quality; PPQ, poor pellet quality.
1 Student t-tests P-value.
2 NHPT = Pellet survivability was determined by placing 100-g samples of sifted pellets into the New Holmen Pellet Tester (NHPT100; TekPro Ltd., North Walsham, Norfolk, UK). The pellets were subjected to air flow for 30 s within the test chamber. The surviving pellets were then removed and weighed.
3 Pellets = Percentage of pellets determined using a modified particle size separator (Modified Penn State Particle Separator, Agricultural and Biological Engineering Department, University Park, PA) fitted with a No. 5 American Society for Testing and Materials screen.
Feed Line Length Means Using PPQ Feed
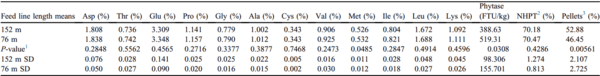
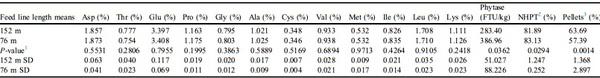
The SD were decreased for aspartate, threonine, glutamate, proline, glycine, alanine, cysteine, valine, isoleucine, leucine, and lysine concentrations, as well as pellet survivability when augered through 76-m feed lines compared with 152-m feed lines (Table 8). Corzo et al. (2005) reported that feeding higher amino acid concentrations to broilers improved FCR and breast meat yield. Relatedly, Kidd et al. (2004) observed detrimental effects to day 49 BW, FCR, carcass yield, and breast yield of broilers fed diets low in amino acid density. Within the parameters of the present study, the variability in amino acid concentration from region to region can be minimized by using shorter feed lines.
Table 8. Feed line length means using PPQ feed.
Abbreviation: PPQ, poor pellet quality.
1 Student t-tests P-value.
2 NHPT = Pellet survivability was determined by placing 100-g samples of sifted pellets into the New Holmen Pellet Tester (NHPT100; TekPro Ltd., North Walsham, Norfolk, UK). The pellets were subjected to air flow for 30 s within the test chamber. The surviving pellets were then removed and weighed.
3 Pellets = Percentage of pellets determined using a modified particle size separator (Modified Penn State Particle Separator, Agricultural and Biological Engineering Department, University Park, PA) fitted with a No. 5 American Society for Testing and Materials screen.
The mean percentage of pellets for PPQ feed was higher at the first cooperator farm compared with the second cooperator farm (
P < 0.0001;
Table 8). This is due to the time interval between Exp. Exp3 and Exp4 were performed 2 wk after Exp1 and Exp2. As a result, the PPQ and IPQ feeds used for Exp3 and 4 experienced some degree of pellet degradation due to feed aging. Within the parameters of this study, increased percentages of fines resulted in higher phytase activity. This speculation supports higher mean phytase activity observed in 76-m feed lines (
P = 0.0308;
Table 8). Overall, these data imply that amino acid segregation is substantially reduced when augering PPQ feed through shorter feed lines (76-m vs. 152-m); however, phytase segregation was still prominent.
Feed Line Length Means Using IPQ Feed
Higher SD for methionine concentration, phytase activity, and percentage of pellets were apparent when IPQ feed was augered through 76-m feed lines (Table 9). Compared with the 152-m-long feed lines, the degree of amino acid variability was reduced when augering feed through 76-m feed lines, regardless of PQ. Therefore, integrators who are reluctant to invest resources in PQ improvements can still decrease on-farm nutrient segregation by using shorter, split (middle house fed) feed lines. This study provides new perspectives and benefits of adopting feed manufacturing techniques that improve PQ. Additional research investigating the effect of on-farm nutrient segregation on broiler performance and flock uniformity is merited.
Table 9. Feed line length means using IPQ feed.
Abbreviation: IPQ, improved pellet quality.
1 Student t-tests P-value.
2 NHPT = Pellet survivability was determined by placing 100-g samples of sifted pellets into the New Holmen Pellet Tester (NHPT100; TekPro Ltd., North Walsham, Norfolk, UK). The pellets were subjected to air flow for 30 s within the test chamber. The surviving pellets were then removed and weighed.
3 Pellets = Percentage of pellets determined using a modified particle size separator (Modified Penn State Particle Separator, Agricultural and Biological Engineering Department, University Park, PA) fitted with a No. 5 American Society for Testing and Materials screen.
Conclusions and applications
1. Within the parameters of this study, modest improvements in pellet quality decreased amino acid and phytase activity segregation, regardless of feed line length.
2. Providing improved pellet quality when feed was augered through split (middle house fed) feed lines eliminated nutrient segregation across the 8 regions of the commercial broiler house.
3. Augering feed through 76-m-long feed lines decreased standard deviation of amino acid concentrations across the 8 regions of the commercial broiler house, regardless of PQ. Thus, split (middle house fed) feed lines may be a strategy to decrease nutrient segregation when faced with reluctance to improve pellet quality.
This article was originally published in 2021 Journal of Applied Poultry Research.30:100157. https://doi.org/10.1016/j.japr.2021.100157. This is an Open Access article under the CCBY license (http://creativecommons.org/licenses/by/4.0/).