Milk protein in early lactation
Bovine Milk in Early Lactation Stages is Richest Source of Protein Contents
Published: April 11, 2011
By: Dr. Ihsan Ullah
ABSTRACT
During this study, forty-five cows from Holstein Friesian were selected among the forty five, Fifteen cows were in early fifteen were in mid while fifteen were from late lactation stage. During this study the dietary plan was kept uniform for all the cows in the experiment. The protein contents were measured by spectrophotometer which revealed that the protein contents in the early lactation stages were higher in almost all the cows present in the study while cows in mid lactation stage revealed a drop off in the protein contents while cows in the late lactation stages showed a further decrease in the protein contents. The entire drop off in the protein contents were significant (P< 0.01) as the lactation stages continued from early to mid and from mid to late. Feed back response of the caseins and whey proteins were observed in SDS PAGE profile by resolving these proteins upon 15% gel which showed remarkable variation in the banding strength of all caseins i.e., α-caseins, β-caseins, κ-casein and whey proteins β-lactoglobulin, α-lactalbumin. Band strength was prominent at early lactation stage but became week at mid lactation stage and then weaker enough at late lactation stage.
Key words: SDS PAGE,α-caseins, β-caseins, κ-casein, β-lactoglobulin, α-lactalbumin.
INTRODUCTION
Research and development activities on domestic animals are mostly concentrated on species and breeds of animals available in the Pakistan Milk consists of about 3.3% proteins. Milk proteins contain all ten (10) essential amino acids required by humans. Milk proteins are synthesized in the mammary gland, but 60% of the amino acids used to build the proteins are obtained from the diet. Total milk protein content and amino acid composition varies with animal breed and individual animal genetics and the lactation stages of the milking period (Švestková, 2006).
There are two major categories of milk protein that are broadly defined by their chemical composition and physical properties (Merchen and Satter. 1983). The casein family consists of about 82% containing phosphorus and precipitate at pH 4.6, while the remaining 18% is serum, or whey protein. The bovine casein group contains four individual gene products known as αS1-CN, αS2- CN, β-CN and κ-CN in approximate proportions of 4:1:4:1 (w/w) (Ng-Kwai-Hang, 2002). Each of the four main casein components show further variability due to different degree of phosphorylation, glycosylation, disulphide bonding, proteolysis and genetic polymorphism (Ng-Kwai-Hang. 2002). Phosphorylation occurs in all casein molecules, but with highest degree in αS2- CN, αS1- CN and β-CN. The degree of phosphorylation in κ-CN is very low, instead this molecule can be glycosylated on up to six amino acid sites (Hoffmann and Steinhofel. 1990). The stage of lactation influences the level of Protein contents, although the results of different researcher are Vary at some extent but still there is a consistency in their results (Richardt et al., 2001). According to Arunvipas et al., 2003 protein contents were higher in the first days of lactation and continued increase rapidly during the first two months and reached to the maximum followed by a slower increase over the next two months. Protein levels decreased as lactation progressed. However Schepers and Meijer, 1998 found no variation by stage of lactation. Protein contents of he milk has been reported to be higher in first-lactation cows than second- or later-lactation Ostersen et al,1997 found statistically significant but numerically small difference in protein contents.
The main objective of the study was to conduct to measure the effect of different lactation stages of cow on the protein contents in milk.
MATERIALS AND METHOD
Cows and Management
Forty five assorted Holstein cows in their different lactation stages were selected and were divided into three groups according to lactation stages i.e., early mid and late lactation stages All the cows were fed with same diet consists of green fodder and cotton oil cake as dietary supplement.
Experimental Diets and Feeding
During this course study all cows were fed consisting of 78.62% corn silage, 20% alfalfa haylage, 0.5% trace-mineralized salt, 0.82% and 0.05% of a vitamin mix (containing 10,000,000 IU/kg of vitamin A, 2,200,000 IU/kg of vitamin D3, and 1100 IU/kg of vitamin E)
Sample collection
About one hundred mL (100 mL) of milk samples were collected from each animal and each sample was divided into five aliquots and each aliquot was subjected to serial dilution to adjust the protein contents for analysis. After dilution pH of all the samples were adjusted to 6.4 which is mormal pH of fresh milk.
Quantification of Proteins
For SDS PAGE analysis, the quantity of total protein in milk was measured by spectrophotometricallb by the Bradford method (Bradford 1976), with bovine serum albumin as the standard.
SDS PAGE analysis of the total protein content
Polyacrylamid gel electrophoresis (PAGE) was performed in a vertical slab gel apparatus. The acrylamid gel (15 % ), the buffer solution and samples were prepared according to the procedure. The electrophoresis was run at 20 milliampere for 20 minutes and then 100 milliampere until the marker dye (bromphenol blue) was 0.5 cm from the anodic end of the slab (about 3 hours). The slabs were stained for 1 hour with Coomassie brilliant blue G 250 in 3.5 % per- chloric acid and destained with 7.5 % (v/v) acetic acid.
RESULTS
All cows in early, mid and late lactation stage were selected to investigate how milk protein contents change throughout the lactation (Milking) period. Milk protein contents obtained from spectrophotometer readings were analyzed by JMP statistical software for comparison of their mean values for each lactation stage i.e., 1=Early lactation stage, 2=mid and 3= late lactation stage (Fig 1). Graph of mean values indicates that there was significant decrease in the protein contents in mid and late stages as compared to early lactation stage. In the early lactation stages protein content were higher in almost all breeds present in the study while cows in mid lactation stage revealed a drop off in the protein contents similarly cows in the late lactation stages showed a further decrease in the protein contents (Fig 1). These results were further supported by T-test at 0.05 level indicated three distinct groups of lactation stages on the basis of their protein contents (Fig. 1). Similarly ANOVA (analysis of variance) F-test ( Table 1) indicated that there were entire drop off in the protein contents of all individual cows and were found significant (P< 0.01) while there were gradual decrease in protein content of milk at different lactation stages (Table 1) i.e. (early, late and mid).
Fig.1
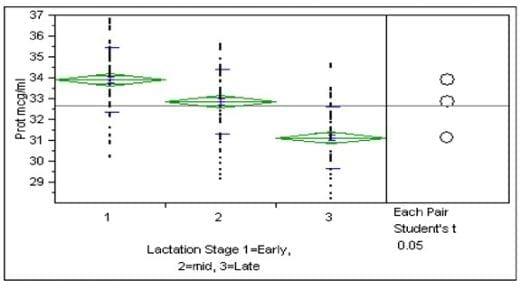
Fig.1. Mean bar graph of milk protein contents (μg/ml) of cow breeds at three distinct lactation stages (1=Early lactation stage, 2=mid and 3= late lactation stage). Bars of the mean values show no overlap which indicates that the results are significant.
Fig.1. Mean bar graph of milk protein contents (μg/ml) of cow breeds at three distinct lactation stages (1=Early lactation stage, 2=mid and 3= late lactation stage). Bars of the mean values show no overlap which indicates that the results are significant.
Table.1
Analysis of Variance
Source | DF | Sum of Squares | Mean Square | F Ratio | Prob > F |
Lac: 1=early, 2=mid, 3=Late | 2 | 409.0856 | 204.543 | 89.5407 | <.0001* |
Error | 309 | 705.8658 | 2.284 | ||
C. Total | 311 | 1114.9514 |
Table I: analysis of variance "F value at α 0.5" shows that the data is significant.
For the molecular characterization of milk proteins the milk samples were resolved through 15% Sodium Dodecyle Sulfate Poly acrylamide gel electrophoresis (SDS PAGE). SDS PAGE profile showed that all the casein contents i.e., αS1-casein, αS2-casein, κ-casein and β-case were higher in early lactation stage while the proportion of αS1-casein, αS2-casein, κ-casein and β-case casein decreased systematically as the lactation stages advanced from early to mid and from mid to late lactation stages. So weak band pattern can be detected as lactation stages advanced from early to mid and then late in SDS PAGE profile (Fig 2).
Same behavior was showed by whey proteins i.e., α-lactalbumin and β-lactoglobulin contents of milk and its proportion of total whey proteins decreased from early to mid and from mid to late lactation. Though the quality of milk protein contents remained unchanged and all the major proteins, i.e., all types of caseins and whey proteins were present in the milk sample of all the three (early, mid and late) lactation stages (Fig. 2) but the proportion was kept changing in different lactation stages.
Fig. 2
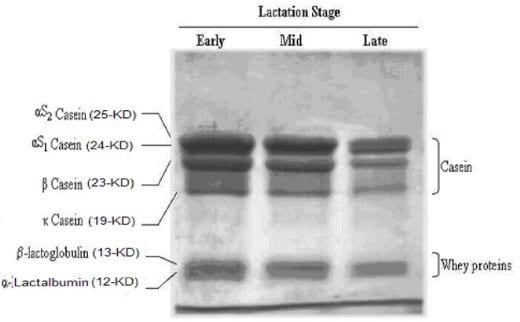
Fig. (2) SDS-PAGE profile for the composition of milk protein constituents of cows at early, mid and late lactation stages. 10 µg proteins were loaded into each well and stained with CBB.
DISCUSSIONS
Lactation is a defining characteristic of mammalian reproduction that involves substantial investment of energy and nutrients in the young and thus has a major impact on maternal nutrient requirements (Oftedal, 1984, 1985). Maternal investment can be measured if the quality of milk is determined and the amount transferred to offspring is quantified. Milk intake has been measured in a number of terrestrial mammals and in pinnipeds that nurse their young on land using isotopic dilution techniques (Holleman, White & Luick, 1975; Oftedal, 1984; Oftedal et al., 1987; Dove, 1988; Lydersen & Kovacs, 1999).
Results of protein quantification obtained from spectrophotometer revealed that the protein contents were high in the early lactation stages and progressively decreased with the successive progression of lactation stages from early to mid and from mid to late . Previous research also report a decrease in the protein content of cow milk at late lactation stages (Richardt et al., 2001) An analysis of the proteins from cows in different lactation stages were resolved through SDS PAGE showed that casein as a proportion of total milk proteins were higher in early lactation stage while the proportion of αS, β and κ-caseins in milk decreased systematically during lactation stages, from early to mid and from mid to late lactation. The α-lactalbumin and β-lactoglobulin contents of milk and its proportion of total whey proteins decreased from early to mid and from mid to late lactation. Same results that all milk protein components measured were significantly (P < 0.01) affected by stage of lactation have been previously reported by Jílek et al., 2006. Casein as a proportion of total milk proteins were higher in early lactation stage while the proportion of αs, β and κ-casein in total casein decreased systematically during lactation (Alomirah eat al., 2000). The whey protein (α-lactalbumin and β-lactoglobulin) contents of milk and its proportion of total proteins decreased from early to mid and from mid to late lactation (Wu and. Satter. 2000).
CONCLUSION
This study was conducted to measure the effect of different lactation stages of cow on the protein contents in milk. Results of the present study revealed that protein contents varied remarkably in the milk at different lactation stages due to the differential expression of the milk producing genes. Significant affect of different lactation stages were observed on protein contents, as the period of lactation advances the protein concentration in the milk decreased and the composition changed. The most significant decrease was reported in late lactation stages in cows, where the maximum protein concentration and casein concentration was observed in early lactation stages
ACKNOWLEDGEMENT
All the Authors express their genuine thanks to the Institute of Biotechnology and Genetic Engineering, NWFP Agricultural University, Peshawar, Pakistan and Department of Live Stock Management NWFP Agricultural University, Peshawar, Pakistan for providing research support for this work. We are also very thankful to Nimra Javed for her best moral support.
REFERENCES
Alomirah, H.F., I. Alli and Y. Konishi (2000) Applications of mass spectrometry to food proteins and peptides. J. Chromato. 893:1-21.
Arunvipas P., I.R Dohoo, J.A. Vanleeuwen, G.P.Keefe (2003) The effect of non-nutritional factors on milk urea nitrogen levels in dairy cows in Prince Edward Island, Canada. Prev. Vet. Med., 59, 83-93.
Bradford, M.M. 1976) Method for quantitation of microgram quantities of protein utilizing the principle of protein-dye-binding. 72:248-54.
Hoffmann V.M., O. Steinhofel . 1990.Possibilities and limitations for appraisal of energy and protein supply through monitoring of milk urea level. Mh. Vet. Med., 45, 223-227.
Jílek, F., D. Řehák, J. Volek, M. Štípková, E. Němcová, M. Fiedlerová, R. Rajmon, D. 2006. Role of milk enzymes in emulsion. Le Lait. 62:521-530
Švestková, 2006.effect of heat on milk compositin. Czech J.Anim. Sci., 51: 510-517.
Merchen, N. R., and L. D. Satter. 1983. Changes in nitrogenous compounds and sites of digestion of alfalfa harvested at different moisture contents. J. Dairy Sci. 66:789.
Ng-Kwai-Hang, K. F. 2002. Milk proteins; Heterogeneity, fractionation and isolation. Ency dairy sci. 165:1881-1902.
Ostersen, S., J. Foldager and J.E. Hermansen. 1997. Effects of stage of lactation, milk protein genotype and body condition at calving on protein composition and renneting properties of bovine milk. J. Dairy Res. 64:207-219.
Richardt W., H. Jeroch, J. Spilke. 2001. The impact of nutrition and non-nutrition factors on milk urea concentration. Tierz.-Arch. Anim. Breed., 44, 251-262.
Schepers A.J., R.G.M. Meijer. 1998 Evaluation of the utilization of dietary nitrogen by dairy cows based on urea concentration in milk. J. Dairy Sci., 81, 579-584.
Snezana. j., miroljub. B., ognjen. M. tanja and C. Lacnjevac . 2007, SDS-PAGE analysis of soluble proteins in reconstituted milk exposed to different heat treatments. J proteins. 7: 371-383 .
Tsioulpas, A., A.S. Grandison and M.J. Lewis. 2007. Changes in Physical Properties of Bovine Milk from the Colostrum Period to Early Lactation. J. Dairy Sci. 90: 5012-5017
Wu.Z., and L. D. Satter. 2000. Milk Production During the Complete Lactation of Dairy Cows Fed Diets Containing Different Amounts of Protein. J Dairy Sci 83:1042-1051.
Related topics:
Authors:

Recommend
Comment
Share

19 de mayo de 2011
yes i agree
Recommend
Reply

12 de abril de 2011
it is a good study to see the composition of milk at different stages of the lactation.through this study i come to the protein content of the milk at various stages of the lactation.
Recommend
Reply
Would you like to discuss another topic? Create a new post to engage with experts in the community.


You may be interested in
.jpg&w=3840&q=75)
Phileo by Lesaffre