I. INTRODUCTION
Free range layer hens deposit nutrients onto the range via their excreta. Over time, gradients of soil nutrients develop across the range with higher concentrations found closest to the shed and under shelters and trees (Wiedemann et al., 2018). Hens congregate underneath trees and shrubs seeking shade and shelter, but little is known about how well trees/shrubs handle the additional nutrient loads. Nitrogen and phosphorus are the two main plant nutrients whose excessive amount may lead to negative impacts on the environment. We hypothesized that the nutrient concentrations in soil would decrease with increasing distance from the shed, while anticipating higher concentrations under trees. Furthermore, we expected that nutrient concentrations in plant tissues of trees/shrubs would be higher when closer to the shed.
II. METHOD
Three farms were selected with fixed sheds and fixed ranges. Farms 1 and 2 had relatively similar soil textures with silty loam (pH 7.3 in CaCl2) and silty clay loam (pH 6.9 in CaCl2), respectively, and flat topography. Farm 3 had deep sand (pH 6.4 in CaCl2), and a south-east facing slope (5 – 10%). Farm 1 had an outdoor stocking density of 10,000 hens/ha, while farms 2 and 3 were stocked at 1,500 hens/ha. The closest trees/shrubs on farm 1 were Oldman saltbush (Atriplex nummularia), planted 10 m from the shed on the south range. On farm 2 the first row of olive trees (Olea europaea) was 15 m from the shed on the north range, while the first row of wine grapevines (Vitis vinifera) on farm 3 was 23 m on the south-east facing upslope from the shed. Soil was sampled under the first row of trees/shrubs closest to the shed on each farm, and at 50 m and 100 m from the shed. Similarly, soil was taken from open range areas adjacent to the trees/shrubs at the same distances from the shed. All soil samples were taken in triplicate 30 m apart running parallel to the shed. Nitrate and phosphorus were measured at the depths of 0 – 10 cm, 10 – 30 cm and 30 – 60 cm. Due to soil constraints (hard clay layer), farms 1 and 2 were only sampled at two depths (0 – 10 cm and 10 – 30 cm). All soil samples were analysed for nitrate and phosphorus by the Eurofins/APAL laboratory (Adelaide, South Australia).
Farm 1 saltbush plant tissue samples were collected in early summer when saltbush had new active growth. The first fully expanded leaf on a new growing tip was taken (100 leaves x 3 replicates x 3 distances from the shed). Olive trees on farm 2 were sampled when trees were at the late flowering to early fruit set stage. The first fully expanded olive leaf was sampled on fresh new growing tips without flowers/fruit (100 leaves x 3 replicates x 3 distances from the shed). Grapevines were sampled on farm 3 during veraison (onset of fruit ripening). Only the leaf blade (no petiole) was taken opposite a bunch of grapes (30 leaf blades x 3 replicates x 3 distances from the shed). All plant tissue samples were analyzed by the Eurofins/APAL laboratory (Adelaide, South Australia).
General ANOVA was conducted on soil nitrate and phosphorus data (Genstat v 21.1, VSN International, UK). Each farm was analysed separately. The main effects in the model were open range versus trees/shrubs, distance from the shed, and soil depth. Means and SEM were calculated for plant tissue results.
III. RESULTS
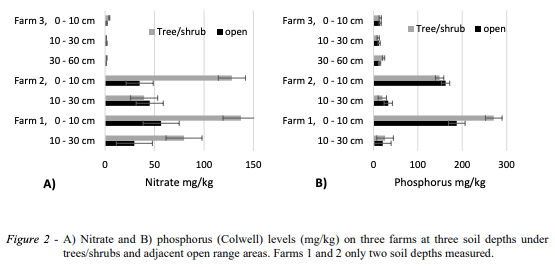
Nitrate levels were significantly higher in soils under saltbush (farm 1) and olive trees (farm 2) (108.6 ± 12.9 mg/kg and 83.9 ± 9.7 mg/kg, respectively) compared to the adjacent open areas of the range (43.1 ± 12.9 mg/kg and 40.0 ± 9.7 mg/kg, P = 0.002 & P = 0.004, respectively). Only farms 1 and 2 had significant nitrate gradients across the range (P = 0.003 and P < 0.001, respectively), whereby levels were highest close to the shed and lowest furthest from the shed (Figure 1 A). Nitrate levels close to the shed exceeded those of the desired level for olives, and vines. There are no levels available for saltbush. On the distant areas of the range, nitrate levels were within the desirable range. Farm 3 had very low nitrate levels. On all farms the top 10 cm of soil had approximately double the nitrate levels of those found at 10 – 30 cm (Figure 2 A). There were significant interactions for nitrate, whereby soil 0 – 10 cm under olives had significantly higher nitrate (128 ± 19.3 mg/kg) than soil at the same depth in the open areas (35 ± 19.3 mg/kg, P = 0.002). Yet, at the soil depth 10 – 30 cm, there were no differences between soils under olives and open areas (range 35 – 45 mg/kg). Similarly, there was higher nitrate under vines in the 0 – 10 cm soil depth (4.29 ± 0.51 mg/ kg, P = 0.012) compared to open areas (1.72 ± 0.51 mg /kg) and no differences at the other two depths (0.91 and 1.56 mg/kg, respectively). There were no interactions for nitrate on farm 1.
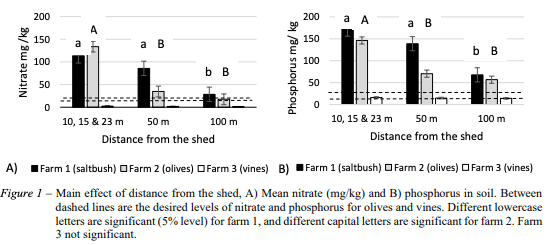
Phosphorus (Colwell) levels were higher in soils under saltbush compared to the adjacent open range areas on farm 1 (148.6 ± 13.3 mg/kg vs. 104.3 ± 13.3 mg/kg respectively, P = 0.028). No significant differences were found between trees/shrubs and open range areas on farms 2 and 3. Levels of phosphorus were highest closest to the shed on farms 1 and 2 (Figure 1 B). Farm 3 phosphorus levels were very low and there were no significant main effects or interactions. Phosphorus was not leaching into the deeper soil layer (10 – 30 cm) on farms 1 and 2 (Figure 2 B). Levels were high in the top 10 cm and there was significant distance from shed x soil depth interactions on farm 1 and 2 (P = 0.003 and P < 0.001 respectively). Closest to the shed at soil depth 0 – 10 cm, phosphorus was significantly higher on farm 1 and 2 (315 ± 23.0 and 253 ± 11.5 mg/kg respectively). There were no differences at 10 – 30 cm regardless of distance from the shed on both farms 1 and 2 (range 15 – 39 mg/kg).
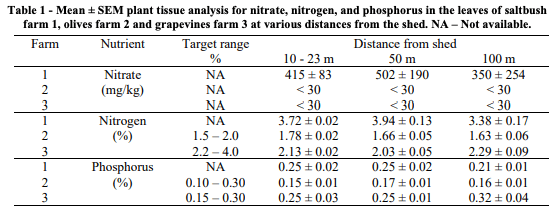
In saltbush plant tissues, there were no nitrate and nitrogen % changes with distance from the shed on farm 1 (Table 1), this was despite a strong distance from the shed effects for nitrate in the soil on farm 1. However, olive leaf did show higher nitrogen % closest to the shed compared to further away from the shed. At all distances from the shed there was adequate nitrogen in the leaves of olives. Nitrogen % was below the target range for grapevines at the veraison stage on farm 3, except at 100 m from the shed. Both olives and grapevines had below 30 mg/kg nitrate in their plant tissues, well below that of saltbush. Phosphorus in plant tissues showed no trend across the ranges of farms 1, 2 and 3, even though there were strong phosphorus gradients across the range soils on farms 1 and 2. Phosphorus % in plant tissues was within the target range for olives and grapevines. There are no target ranges available for saltbush.
IV. DISCUSSION
Hens mostly congregated in large numbers closest to the shed and under nearby trees and shrubs. As a result, nitrate and phosphorus were found at higher levels in soils closest to the shed with a decrease as distance from the shed increased (except farm 3). These findings support those of Zoli et al., (2023), Wiedemann et al., (2018) and a study with free range broilers (Kratz et al., 2004). Even though there were strong nutrient gradients in the soils across the range for nitrate and phosphorus, this was not reflected in plant tissues. There were no toxic levels found in plant tissues and no evidence of luxury uptake. The farms in this study have been operating as free range for nine years (farms 1 & 2) and 11 years (farm 3). At this stage the trees/shrubs on all three farms were healthy and surviving the high nutrient levels. However, long term sampling of soils under trees/ shrubs and plant tissue analyses are needed to monitor the health of trees/ shrubs on free range farms. In addition, a diversity of tree/ shrub species should be analysed to gauge how well they manage high nutrient loads.
The clay-based soils on farms 1 and 2 retained nitrate and phosphorus, notably in the top 10 cm of soil closest to the shed. In contrast, the sand on farm 3 did not retain nutrients (including nitrate and phosphorus) and was mostly deficient, even under the grapevines closest to the shed where the hens would mostly range. Nutrients in the sand had most likely been leached further down the sand profile (deeper than 60 cm), and/or the grapevines and the inter row perennial grasses had intercepted some of the nutrients. Soil texture is a possible mechanism in that can strongly influence nutrient accumulation or leaching properties of soils (Gaines and Gaines 2008).
A practical strategy to help manage nutrients on the range is the use of moveable shelters in areas closest to the shed (0 - 25 m) permanently located trees/shrubs beyond 25 m. Furthermore, it is important to protect the top layer of soil (0 – 10 cm) from water and/or wind erosion as this layer contains the highest levels of nitrate and phosphorus. To minimise erosion, rock rubble can be placed closest to the shed (0 – 10 m) and hay bales spread across any bare areas on the range.
ACKNOWLEDGEMENTS: We would like to thank Australian Eggs for providing the funding for this project and the farm managers for allowing us onto their farms to take soil and plant samples.
Presented at the 35th Annual Australian Poultry Science Symposium 2024. For information on the latest and future editions, click here.