Introduction
Optimizing the breast size of broilers is a critical economic target due to its higher market value versus other cut-up pieces. Historical improvements in breast production have shown an impact on the efficiency of broilers in using dietary energy (Martinez et al., 2019a), which accounts for 70–75 % of the poultry feed cost. They have also been associated with quality conditions such as white stripping, wooden breast, and spaghetti breast (CaldasCueva et al., 2021).
Gaining a closer insight into the growth dynamics of carcass and cut-up pieces of broilers under nutritional or management interventions would help understand better the mechanisms influencing these processes and develop strategies to optimize them (Maharjan et al., 2021a). However, processing birds is a destructive, time-consuming, and labor-intense activity that requires trained personnel and large enough samples to obtain reliable values (Wamsley and Moritz, 2014). It is used mainly as a response variable at the end of the studies and cannot be readily performed on broilers at early ages. Therefore, the dynamics of the carcass and cut-up pieces are approached to describe growth, but its evaluation as a response to tested factors is scarce.
Predicting the weights of the carcass and the cut-up pieces in live birds would help overcome these restrictions. Attempts have been made with equations based only on BW (Shafey et al., 2013), assuming no percentual differences exist, so their practical use is limited. Models based on live size measurements of the chest of broilers have provided diverse R2 values (0.18–0.88; Raji et al., 2010). Also, other technologies, including computerized tomography, magnetic resonance imaging, and real-time ultrasonic, have been studied on broilers (Silva et al., 2006). However, none have provided accurate models applicable to multiple cut-up pieces at extreme ages and weights (100 g – 5 kg BW) of broilers.
Dual-Energy X-ray Absorptiometry (DEXA; or Dual X-ray Absorptiometry, DXA) is a technology developed to determine human bone density. It detects differential attenuation rates of radiation by lean tissue, fat, and bone (Mitchell et al., 1997). Software coupled with DEXA equipment provides mineral, lean mass, and fat contents indexes. However, it is also used to determine the chemical composition of live birds (Goncalves et al., 2019). The application of DEXA to the determination of processing weights represents a new possible application relying on its ability to detect the body composition of the bird. Indeed, the relationship between the mineral, fat, and protein concentration varies among cut-up pieces (Bostami et al., 2017), so it is reasonable to expect that variations in the relative weight of each piece influence the body composition of the whole bird. Therefore, we hypothesized that DEXA-reported indexes are sensitive to changes in the weight of the cut-up pieces.
In a companion article (Martinez et al., 2022a), adjustment coefficients required to predict the processing weights of broilers using DEXA were developed. Therefore, the objective of this study was to develop models to predict the weights of the unchilled and chilled carcass and cut-up pieces and the abdominal fat of broilers during the first ten weeks of age using DEXA. Further external validation of these models is presented in another companion paper (Martinez et al., 2022b).
Material and methods
Birds used for model development
One hundred five Cobb 500 male broilers were randomly obtained from Experiment-1 (at 4, 14, 24, or 36 days of age) and 186 from Experiment-2 (at 47, 48, 49, 50, 57, 68, or 69 days); both carried out at the University of Arkansas Poultry Research Farm (Table 1). Birds in Experiment-1 were fed standard or semipurified mash diets in battery cages, while those in Experiment-2 were grown up in floor pens and fed corn-soybean meal-based pelleted treatments diets with varying crude protein and metabolizable energy contents. Birds obtained were euthanized with CO2 inhalation without a feed withdrawal period, and the BW (nonfasted BW; g) was determined.
Scans
The birds were scanned in a prone position using DEXA equipment (Lunar Prodigy; GE Healthcare, General Electric Co., Madison, WI) with a small animal body software (enCORE version 12.30; GE Healthcare, General Electric Co., Madison, WI). After scanning, a custom rectangular area involving the whole body of the bird was established as the region of interest for the software to determine the following approximated indexes: bone mineral density (g/cm2), bone mineral content (g), body area (cm2), total tissue (g), lean tissue weight (g), fat tissue weight (g), percent body fat (%). The lean-to-fat ratio (lean tissue weight / fat tissue weight) was calculated and included.
Table 1
BW and unchilled carcass and cut-up weights (g) of the broilers used to develop the models 1.
1 Mean values are bled unchilled weights. SD is shown within parenthesis.
2 BWNF, non-fasted BW; BWF, fasted BW.
3 CAR, carcass; RCP, ready-to-cook parts (TWM + LQU + WIN); TWM, total white meat (BRE + TEN); BRE, breast fillet; TEN, tenders; LQU, leg quarters; WIN, wings; FEE, feet (including shanks); HEA, head (including neck); ABF, abdominal fat (gizzard fat + fat pad). NA, not available.
Fasted body weight
For each of the birds, the corresponding 12-hour fasted BW (g) was calculated as:
BWp = BWnf x (100 - DCL)/100
where BWF = fasted BW (g), BWNF = non-fasted BW (g), and DCL = digestive content loss correction factor (%) (DCL ¼ 3:1810942 þ 3:0099386 e 0:001134 BWNF ð Þ; Martinez et al., 2022a).
Carcass traits
After being scanned, the birds were scalded, defeathered, eviscerated, the abdominal fat (ABF; fat pad and gizzard fat) recovered, and removed the feet (FEE; including the shanks) and head (with the neck) to obtain the carcass (CAR). The wings (WIN) were separated from the back by severing the humeral-scapular joint. The breast fillet (BRE; Pectoralis major) was obtained by pulling firmly downward (Caldas-Cueva et al., 2021), removing the skin, and cutting the edge of the P. mayor around the proximal end of the humerus. Both tenders (TEN; P. minor) were cut and pulled off the keel. The leg quarters (LQU; thigh and drumstick together) were obtained by dislocating both femurs from the hip joints. The junction of the thigh muscles with the pelvic girdle was cut, ensuring the oyster muscle located in the hollow on the dorsal side of the iliac fossa was pulled off with the thigh.
The following actual (unbled) weights were recorded (Supplementary Fig. S1): CAR, BRE, TEN, LQU, WIN, FEE, head, ABF, total white meat (TWM; breast and tenders), ready-to-cook parts (RCP; total white meat, leg quarters and wings; Maharjan et al., 2021b).
The actual (unbled) weights of the carcass and cut-up pieces were adjusted to the corresponding bled weights, considering the blood retained in the body. A uniform distribution of the blood within the bird and among cutting-up pieces was assumed. A retained blood value of 2.76 % of the fasted BW was considered (Martinez et al., 2022a), and the following calculation was applied:
PWb = (PWa x (100-CFb))/100
where PWB = bled piece weight (g), PWA = actual piece weight (g), and CFB = blood loss correction factor (2.76 %). Then, the carcass and each cut-up chilled weight (if the standard procedure at a processing plant with a one-hour rest on ice water was followed) were calculated, considering a 2.79 % increase in the weights (Martinez et al., 2022a). Chilled weights were not determined for ABF, head, and FEE.
Modeling process and statistical analysis
As shown in Fig. 1, the overall model development process included a data-splitting (hold-out twofold cross-validation) with a refitting approach (Harrell, 2015). A database with 291 rows was built gathering all the data from individual birds. Age, nonfasted BW, fasted BW, and the DEXA-reported values were considered possible predictors. The unchilled and chilled weights were included as response variables. A stratified random split was applied to partition the data into 70 and 30 % sets for training (fitting and selection; n = 204) and validation (n = 84), respectively. Multiple least-squares linear regressions were fitted independently for unchilled or chilled variables, according to the following general linear additive model:
where Y = response variable, b0 = intercept, b1 to bp = regression coefficients for the corresponding predictor, X1 to Xp = predictors included in the model, p = number of predictors, and e = error term. Interaction factors were also explored as predictors.
Candidate models were built based on the biological meaning of the predictors and the adjusted R2 using the stepwise regression control panel of JMP (JMP Pro 16; SAS Institute Inc., Cary, NC). However, the stepwise procedure itself was not applied. If potential outliers were detected on the Studentized Residuals plot and were influential (Cook’s Distance > 1), they were removed. The candidate models were screened considering the following criteria: (1) The normal distribution of residuals (Inca et al., 2020) on the Shapiro-Wilk W-test or a close to normal distribution on the Normal Quantile plot (Martinez et al., 2020) in addition to the relationship between the lack of fit to a normal distribution (distribution histogram shape) and the confidence to rely on the Central Limit Theorem based on the sample size (Lumley et al., 2002), and (2) the absence of heteroscedasticity on the Predicted versus Residual plot. When appropriate, natural log, square root, or inverse transformations were applied to improve the linearity of relationships among variables and normalize the distribution of the model residuals or increase their homoscedasticity. Collinearity was evaluated, and if predictors with variance inflation factor > 5 were detected, a new candidate model was built, progressively removing one predictor at a time.
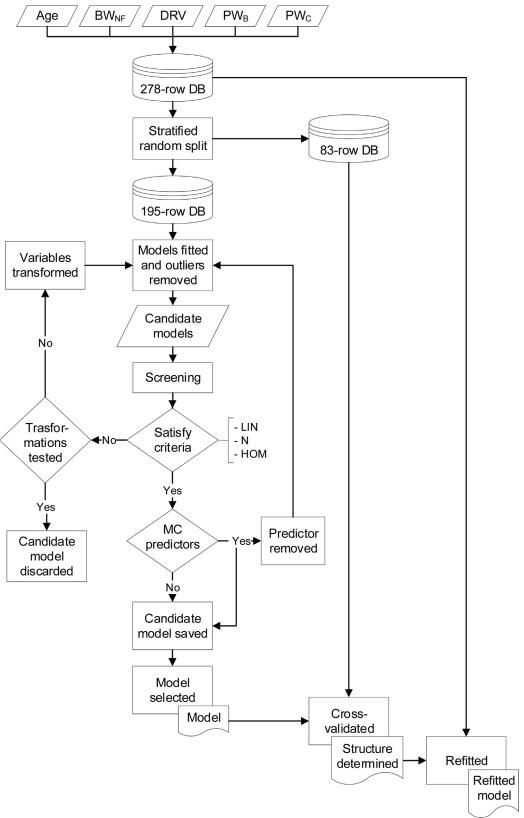
Fig. 1. Development of models to predict the processing weights of broilers. BWNF, non-fasted BW (g); DRV, DEXA-reported values; PWB, unchilled pieces weights (g); PWC, chilled pieces weights (g); DB, database; MC, colinear; LIN, linearity; N, normality; HOM, homoscedasticity.
Selection criteria were the highest adjusted R2 and the biological meaningfulness of both the predictors and their coefficients, if not reducing the adjusted R2. The lowest RMSE, calculated from the unbiased estimator of the random error variance (the Mean Square Error; MSE; Inca et al., 2022), was also considered if the response variable had the same unit. Following Prodan et al. (2005), parameter estimates were reported with up to seven decimal digits to preserve the precision of the models.
Validation and refitting
Finally, validation was performed by testing the selected model on the validation dataset and comparing the new R2 and RMSE with those obtained on the training dataset. Models were validated if the reduction in R2 from training to validation dataset was ≤ 10 %. Once validated, models were refitted without changing their structure using all data in the original dataset (n = 291; Harrell, 2015) to optimize the precision of parameter estimates. All statistical procedures were performed using JMP.
Results
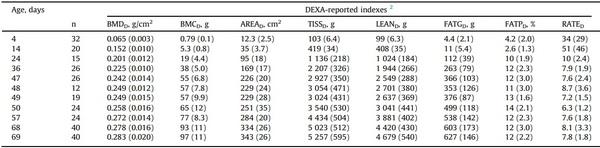
Birds used to develop the models (Table 1; Supplementary Fig. S2) showed high age-wise and overall variability (non-fasted BW from 95 g - 6.302 kg). At the same age, CV was from 5.7 (on day 4) to 19 % (on day 24), and ratios heaviest-to-lightest were 1.25 (on day 4) to 2.12 (on day 47). Processing traits (Table 1) and DEXA-reported indexes (Table 2) were also highly variable. The lowest mean age-wise CV in processing traits was found in the weights of FEE and WIN (10.7 and 11.6 %, respectively). Other parts were more variable (head, LQU, RCP, CAR, TEN, TWM, and BRE; mean age-wise CV 13.5, 13.7, 14.1, 14.4, 17.4, 18.3, and 19.0 %, respectively), and the highest mean CV was observed in ABF (35.6 %). Furthermore, the lowest mean CV in the DEXA-reported indexes within the same age was observed in the bone mineral density (5.7 %). Other indexes showed higher variabilities (body area, lean tissue weight, total tissue, and bone mineral content; mean CV 11.6, 12.0, 12.5, and 15.1 %, respectively). The highest CV was observed in those variables related to the body fat (percent body fat, fat tissue weight, and lean-to-fat ratio; 25.4, 32.0, and 38.7 %, respectively).
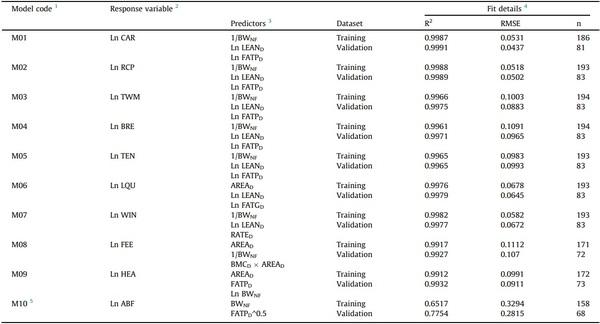
The procedure in Fig. 1 was followed, and the best model for each processing trait was selected. The models to predict the unchilled and chilled weights of the same processing piece showed the same structure, predictors, parameter estimates, and fit details. The intercepts were the sole difference between them. As shown in Table 3, the selected models included three predictors, except for the one predicting ABF, with only two. Most of the chosen models included natural logarithms of processing weights, DEXA-reported lean tissue weight and percent body fat, and the inverse of the nonfasted BW. The non-fasted BW and DEXA-reported indexes, like lean tissue weight, percent body fat, body area, lean-to-fat ratio, fat tissue weight, and bone mineral content, or their corresponding transformed variables, were included as predictors in 9, 7, 7, 3, 1, 1, and 1 of 10 models, respectively. Only the model predicting FEE included the DEXA-reported bone mineral content as a predictor, constituting an interaction term (model M08). All models, except the one to predict ABF (model M10; R2 = 0.65), showed very high precisions (R2 > 0.99).
The selected models were tested on the validation dataset. The prediction accuracy of the models was high, as the RMSE observed on the validation dataset were equivalent to prediction errors (% discrepancy) < 1.0 % for CAR, RCP, and LQU, < 2.0 % for WIN, TWM, BRE, and head, < 2.5 % for TEN and FEE, and < 8.0 % for ABF. No precision (R2) drop from training to validation higher than 0.2 % was found (Table 3), and the precision of all the models showed to be high (validation R2: 0.78 for ABF –model M10, > 0.99 for all other models).
Once tested, the models were refitted (Tables 4 and 5) using all the data available (Supplementary Figs. S1 to S17; obtained with scripts embedded in Supplementary Fig. S3 considering the notes in Supplementary Fig. S4). The models presented in Table 4 provided two alternative intercept values to predict unchilled or chilled weights.
Author’s point of view
Models to predict the processing weights of broilers are needed to study the growth dynamics of the carcass and cut-up pieces and support the development of efficient nutritional and management strategies (Martinez, 2012). We hypothesized that DEXA was able to determine processing weights based on body composition changes associated with yield differences (Maharjan et al., 2021c). Therefore, we sought to develop models to predict the unchilled and chilled processing weights of broilers from 4 to 69 days using DEXA.
The values reported by the DEXA software have been shown to predict the chemical composition of broilers (Goncalves et al., 2019), and higher lean-to-fat gain ratios are associated with lower feed conversion ratios (Martinez et al., 2019b). Consequently, the lower the fat concentration in the bird, the higher the yield of leaner cut-up was expected to be. Therefore, candidate models with more biologically meaningful predictors were considered based on this relationship between body composition and the weights of the cut-up pieces. Nevertheless, the DEXA-reported values used as predictors are related but do not truly correspond to the values obtained through wet chemistry analyses (Goncalves et al., 2019). Consequently, the models reported herein are unsuitable for predicting the processing weights using body composition traits as predictors or establishing relationships between chemical body composition and processing weights.
Table 2
Indexes reported by Dual-Energy X-ray Absorptiometry from broilers used to develop the models 1.
1 SD is shown within parenthesis
2 BMDD, bone mineral density (g/cm2); BMCD, bone mineral content (g); AREAD, body area (cm2); TISSD, total tissue (g); LEAND, lean tissue (g); FATGD, fat tissue weight (g); FATPD, percent body fat (%); RATED, lean-to-fat ratio (lean tissue weight / fat tissue weight).
Table 3
Predictors and validation of models to determine processing weights of broilers using Dual-Energy X-ray Absorptiometry.
1 Each of the prediction models M01 to M07 includes two versions, a and b, corresponding to those predicting unchilled and chilled weights, respectively. The chilled weights of FEE, HEA, and ABF were not determined.
2 Response variables: CAR, carcass (g); RCP, ready-to-cook parts (g); TWM, total white meat (g); BRE, breast fillet (g); TEN, tenders (g); LQU, leg quarters (g); WIN, wings (g); FEE, feet (including shanks; g); HEA, head (including neck; g); ABF, abdominal fat (g); RATED, lean-to-fat ratio (lean tissue weight / fat tissue weight); Ln, natural log.
3 Predictors: BWNF, non-fasted BW (g); LEAND, lean tissue (g); FATPD, percent body fat (%); FATGD, fat tissue weight (g); AREAD, body area (cm2 ). All predictors but BWNF, as provided by the DEXA. All models were linear ones and included an intercept.
4 Fit details: R2, coefficient of determination; RMSE, root mean square error; n, number of birds used to fit the model.
5 Applies for BWNF ≥ 700 g; otherwise, ABF = 0 g. The predictor FATPD^0.5 is the root square of the FATPD.
We used broilers of highly diverse ages, BW, processing weights, and body composition to achieve the proposed objective, so future predictions may likely be interpolations, not extrapolations, increasing the reliability of the models. However, it was not possible to obtain the processing weights of the same scanned birds, following the standard procedure at a processing plant, even if scanned alive, due to the extreme variation in BW and because birds were scanned without any feed withdrawal period. Nonfasted birds are not supposed to get into a processing line due to microbial safety, welfare, and efficiency issues. Therefore, we manually processed the scanned birds and applied correction factors to determine the fasted BW and the bleed and chilled weights.
In the current study, the stepwise regression procedure was not used to avoid the issues summarized by Harrell (2015). To ensure the quality of the models, they were selected considering the biological meaningfulness of their predictors. Also, considering that all DEXA-reported indexes are available at once, the Akaike and Bayesian information criteria were not considered not to penalize models with more parameters.
Usually, multicollinearity does not affect predictions on new data with the same degree of collinearity as the dataset used to estimate the model parameters, as long as extreme extrapolations are not undertaken (Harrell, 2015). However, if collinearity exists, the calculated coefficients do not accurately represent the relationships between predictors and response variables. In this study, the models developed were intended to predict processing weights, not explain the relationships between the DEXA-reported variables and the processing traits. Therefore, the models developed should not be used to make inferences about relationships between variables (Harrell, 2015; Martinez, 2021).
In our study, the best models to predict unchilled and chilled processing weights differed only in the intercept. This was expected as the correction factor used to obtain the chilled weights was constant across the grow-out period.
In addition to the non-fasted BW, the most frequent predictors in the developed models were the DEXA-reported lean tissue weight and percent body fat. Even though it has been reported that the DEXA-reported values do not exactly correspond to the values obtained through wet chemistry analysis, they predict the actual body composition with high precision (Goncalves et al., 2019). Then, considering that the fat and lean mass contents do not distribute uniformly across the body (Bostami et al., 2017), it was reasonable to expect that the lean mass and fat concentrations predict the processing weights of broilers. An exception was the model predicting the weights of the feet and shanks (M08) that did not include the lean body mass and fat indexes, but the DEXAreported bone mineral content (g) interacting with the size of the bird (body area, cm2; when the bird was laying on the DEXA). Indeed, the absence of meat in the feet and shanks and their corresponding relatively (%) higher mineral concentration than the rest of the body explains that the body mineral content was more sensitive to variations in the weight of the feet than the lean body mass or fat indexes.
All models, but the one to predict the abdominal fat weight (ABF, M10), showed very high fitting precisions (training R2). The R2 of the model predicting ABF is consistent with that of models predicting body fat using DEXA (Mitchell et al., 1997).
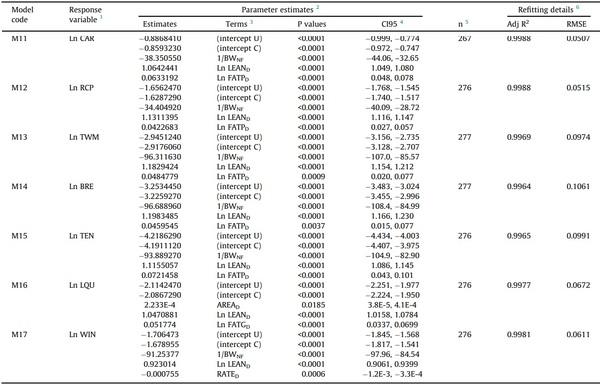
Table 4
Refitted models to predict processing weights of broilers using Dual-Energy X-ray Absorptiometry.
1 CAR, carcass; RCP, ready-to-cook parts; TWM, total white meat; BRE, breast fillet; TEN, tenders; LQU, leg quarters; WIN, wings; all in g. Ln, natural log. Models apply for unchilled or chilled weights depending on the intercept term used.
2 Numbers (Q) shown in scientific notation (QE-X) should be divided by 10 to the power of X.
3 Alternative intercept U and intercept C correspond to models predicting unchilled and chilled weights, respectively. BWNF, non-fasted BW (g); LEAND, lean tissue (g); FATPD, percent body fat (%); FATGD, fat tissue weight (g); AREAD, body area (cm2); RATED, lean-to-fat ratio (lean tissue weight / fat tissue weight). All predictors but BWNF, as provided by the DEXA.
4 95 % confidence intervals of the estimates.
5 n, number of birds used to refit the model.
6 Adj R2
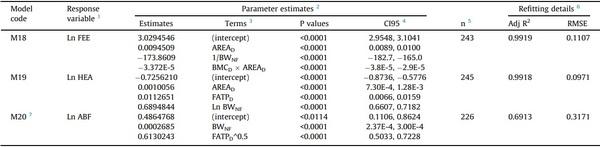
Table 5
Refitted models to predict complementary processing weights of broilers using Dual-Energy X-ray Absorptiometry.
1 Response variables: FEE, feet (including shanks; g); HEA, head (including neck; g); ABF, abdominal fat (g); Ln, natural log.
2 Numbers (Q) shown in scientific notation (QE-X) should be divided by 10 to the power of X.
3 AREAD, body area (cm2); BWNF, non-fasted BW (g); BMCD, bone mineral content (g); FATPD, percent body fat (%). All predictors but BWNF, as provided by the DEXA.
4 95 % confidence intervals of the estimates.
5 n, number of birds used to refit the model.
6 Adj R2 , adjusted R2.
7 Applies for BWNF ≥ 700 g; otherwise, ABF = 0 g. The predictor FATPD^0.5 is the root square of FATPD.
The models showed no overfitting as no relevant precision drop was observed when tested on the validation dataset (Table 3). Indeed, the data splitting approach applied to validate the models internally has been recognized as a safety procedure to prevent model overfitting (Candelotto et al., 2022). Furthermore, the high prediction performance (high R2) and accuracy (low RMSE) observed on the validation dataset are consistent with those reported for models predicting the body composition of broilers using DEXA (Goncalves et al., 2019). The R2 is considered a good measurement of the model’s predictive ability, particularly to quantify its reduction when the model is applied to new data. In addition, the extra-sample error estimation obtained on a validation dataset obtained by splitting the data (the validation RMSE) is considered a good estimator of the expected prediction error (Harrell, 2015).
The refitting procedure applied after the internal validation of the models was worth it, as evidenced by the increase in the precision of the parameter estimates and the accuracy of predictions. For example, the 95 % confidence interval of the terms (intercept and predictors) of the models predicting the unchilled carcass (M11 vs M01), unchilled breast (M14 vs M04), and abdominal fat (M20 vs M10) weights showed mean reductions in their rank width of 21, 19, and 21 %, respectively, and the same models showed reductions in the RMSE of 4.5, 2.7 and 3.7 %, respectively. Therefore, refitting the models with all the data available was undoubtedly a convenient procedure to increase the precision of the model estimates and the accuracy of the predictions. An equivalent approach has been reported by Candelotto et al. (2022) to test data cleaning methods in a study validating a sensor-based tracking system for broiler breeders and layer hens.
Further possible applications of the models developed herein include the following: (1) Determine the correlations between the diet energy value, based on alternative energy systems, and the market value of the birds, based on their predicted processing weights, using Suesuttajit et al.’s (in press) data. (2) Quantify the relationships between protein turnover and the dynamics in processing weights based on changes in dietary amino acid levels and ambient temperature, using Maharjan et al.’s (2020a) data, or by different genetics, using Maharjan et al.’s (2020b) data. (3) Determine a threshold criterion to minimize the number of birds to DEXA-determine processing weights using QuisirumbayGaibor et al.’s (2019) meta-analysis sensitivity data. (4) Develop a skeletal integrity risk index based on the relationship between the BW and the weight of the feet (using model M18) and the walking ability, using Uculmana et al.’s (2018) data. (5) Build a model to determine the changes in the market value of broilers based on changes in their carcass conformation (TWM to LQU ratio), using market prices and models M13 and M16, so that systematic reviews, such as that of Martinez and Uculmana’s (2016), may include predicted economics.
Conclusion
In conclusion, the results of this study support the use of DEXA to determine the processing weights of broilers with high precision and accuracy. The use of DEXA for this purpose has tremendous potential, reducing the cost of processing broilers at commercial ages for research projects, allowing determinations even at early ages, and studying the growth curves of independent cut-up pieces as influenced by nutrition, genetics, environment, and management. The models presented herein were developed to predict the processing weights, not explain the relationships among predictors and response variables, so they should not be used to make inferences about those relationships. In addition, these models were not developed to predict the processing weights using body composition values determined through wet chemistry as predictors or to establish relationships among them, as the DEXAreported values do not correspond to actual wet chemistry ones (Goncalves et al., 2019). Finally, the models developed may be considered exclusive to the specific equipment, software, and scanning technique used, as previously reported for body chemical composition determinations (Mitchell et al., 1997). Further external validation of the models developed herein is presented in a companion paper (Martinez et al., 2022b).
This article was originally published in Animal - Open Space, Volume 1, Issue 1, December 2022, 100023. https://doi.org/10.1016/j.anopes.2022.100023. This is an Open Access article under the CC BY license (http://creativecommons.org/licenses/by/4.0/). 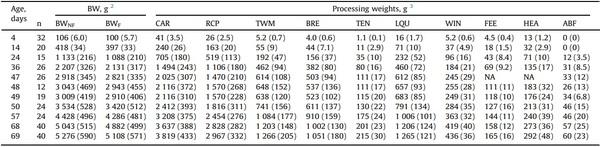

")


