Precaecal phosphorus digestibility of inorganic phosphate sources in male broilers
Published: May 8, 2018
By: P. Bikker, J. W. Spek, R. A. Van Emous, and M. M. Van Krimpen.
/ Wageningen Livestock Research, Department of Animal Nutrition, Wageningen, The Netherlands
Summary
- The aim of this study, comprising two experiments, was (1) to determine in Experiment 1 the relationship of incremental dietary P (phosphorus) content on precaecal digestible P in male broilers and (2) to determine in Experiment 2 the precaecal P digestibility of various inorganic P sources at marginal levels of P supply.
- In Experiment 1, a total of 260 male Ross 308 broilers were divided into groups of 10 birds per pen resulting in 8 replicates for treatment 1 and 6 replicates for treatments 2–4. Experimental diets were formulated to contain 4 incremental concentrations of digestible P by means of increasing concentrations of monocalcium phosphate (MCP). In the second experiment, 480-d-old male Ross 308 broilers were divided in groups of 12 birds per pen resulting in 16 replicates for the basal diet and 6 replicates for each test diet. A total of 4 inorganic P sources, MCP, monodicalcium phosphate (MDCP), dicalcium phosphate (DCP) and defluorinated phosphate (DFP) were added to the basal diet to determine the precaecal P digestibility. Three of the 4 inorganic P sources (MCP, MDCP and DCP) represented a mix of batches from different producers. At the end of both experiments, the chyme of the posterior part of the small intestine was collected. Digestibility of P and Ca was determined using titanium dioxide as indigestible marker.
- In Experiment 1, a reduction in precaecal digestibility of P was observed above an estimated precaecal digestible dietary P concentration of 4.8 g/kg.
- The precaecal P digestibility of the tested inorganic P sources in Experiment 2 was 78.3% for MCP, 59.0% for DCP, 70.7% for MDCP and 31.5% for DFP.
INTRODUCTION
Phosphorus (P) is an essential mineral for all farm animals and plays a key role in cellular metabolism, cellular regulatory mechanisms and in bone mineralisation (Suttle, 2010). Furthermore, next to calcium (Ca), it is the most abundant mineral in the body of farm animals including poultry (Georgievskii et al., 1982). In most diets for poultry, a source of inorganic P, for example, monocalcium phosphate (MCP) or dicalcium phosphate (DCP), is included to fulfill the P requirement of the animals. There is a need to reduce dietary concentrations of total P and inclusion of these phosphate products because of the limited inorganic mineral P reserves in the world and because of the negative environmental impact of P in excreta on the environment (Liu et al., 2008). This requires adequate insight in the digestibility and relative value of different sources of commonly used phosphate products. In the past, P digestibility of ingredients used in poultry nutrition was generally determined by calculating the difference between P consumed and P excreted in the excreta. This measurement may result in an underestimation of true digestible P, in the case that absorbed but unutilised P is excreted via the urine. Precaecal determination of P digestibility at the distal part of the ileum avoids this possible underestimation of digestible P of ingredients (Rodehutscord et al., 2012), and presumably results in P digestibility coefficients that are more reliable and consistent. However, precaecal digestible P values may be affected by the level of retainable P in the diet. When the retainable P content reaches or exceeds the requirements of the birds, the absorption of P from the digestive tract may be reduced. Therefore, it is essential to know in which range of dietary P content a constant P digestibility can be expected. Furthermore, Shastak et al. (2014) showed that precaecal digestibility of phytate-bound P decreases with increasing concentrations of nonphosphate P in the diet. This implies that the observed digestibility of P from a test ingredient is confounded by a decreasing contribution of P released from phytate. Hence, basal diets used in P digestibility studies should contain no or minimal amounts of phytate P in order to minimise disturbing effects of phytate P on measured P digestibility coefficients of test products. The first aim of this study, comprising two experiments, was to determine in Experiment 1 the relationship between incremental dietary P content and precaecal digestible P (pcdP) and precaecal digestible Ca (pcdCa) content in male broilers. The second aim was to determine the pcdP digestibility from the inorganic P sources MCP, dicalcium phosphate (DCP), monodicalcium phosphate (MDCP) and defluorinated phosphate (DFP) at marginal levels of P supply in male broilers, based on semi-purified diets containing minimal concentrations of phytate P to ensure a minimum level of interference from phytate P in Experiment 2. The third aim of this study was to make a limited comparison between apparent total tract retention (ATTR) of P and pcdP for MCP. The protocol developed by the World Poultry Science Association (WPSA, 2013) on the determination of pcdP digestibility was largely followed in this study.
MATERIALS AND METHODS
Experimental diets
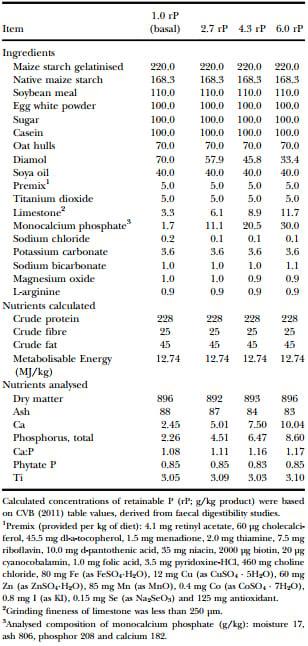
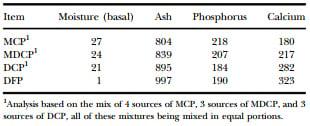
Diets used in Experiments 1 and 2 are presented in Table 1 and Table 2, respectively. In Experiment 1 (conducted in 2014), 4 diets were formulated to contain incremental concentrations of retainable P based on CVB (2011) by replacing diamol with increasing levels of monohydrated MCP (Aliphos, Bulgaria). In Experiment 2 (conducted in 2014), the precaecal P digestibility of the inorganic P sources MCP, DCP, MDCP and DFP was determined (chemical composition of the 4 inorganic P sources is shown in Table 3). Therefore, in addition to a basal diet, 4 diets were prepared including 2 g P/kg diet from either MCP, MDCP, DCP or DFP in a constant Ca:P ratio of 1.40 and using CaCO3 (grinding fineness of CaCO3 less than 250 µm) to include the required amount of Ca. In both experiments, titanium dioxide (TiO2) was used as marker to determine the digestibility. The MCP was acquired from 4 suppliers for monohydrated MCP and mixed in equal portions (Aliphos, the Netherlands; Aliphos, Bulgaria; Yara, Sweden and Timab, France). The MDCP was acquired from 3 suppliers and mixed in equal portions (Aliphos, the Netherlands, semi-monohydrated; Aliphos, Bulgaria, semi-monohydrated and Timab, France, monohydrated). The DCP was acquired from 3 suppliers and mixed in equal portions (Aliphos, the Netherlands, semihydrated; Aliphos, Bulgaria, semi hydrated and Timab, France, anhydrous). The DFP was acquired from 1 supplier (Phosphorit, Eurochem group, Russia).
Table 1. Composition of ingredients and nutrients in the diets used in Experiment 1 (in g/kg as fed unless otherwise indicated)
Birds and management
In Experiment 1, a number of 260-d-old male Ross 308 broilers were obtained from a commercial hatchery. The birds were vaccinated against avian infectious bronchitis and Newcastle disease and were group-housed on wood shavings between 0 and 14 d of age. In this period, the birds received a commercial starter diet (nutrient concentrations: 216 g/kg RE, 9.0 g/kg Ca, 5.9 g/kg P and 0.01% added commercial phytase; Natuphos 5000 G, BASF, Germany). From d 14 until the end of the experiment at d 24, the birds received the experimental diets and were divided over pens with plastic slatted floors (Jansen Poultry Equipment, Barneveld, the Netherlands) in groups of 10 birds per pen resulting in 8 replicates with 10 birds per replicate for treatment 1 and 6 replicate pens for treatment 2, 3 and 4. Temperature was set at 34°C at d 1 and gradually reduced thereafter to 21°C at d 21. Lighting schedule was 24 L:0D during d 1 and 2, 18 L:6D between d 3 and 21 and 24 L:0D between d 22 and 24 in order to ensure a steady-state situation with a homogenous distribution of feed intake during the last 3 d of the experiment. Feed and water were provided ad libitum during the complete period of the experiment.
Table 2. Content of ingredients and nutrients in experimental diets used in Experiment 2 (in g/kg as fed unless otherwise indicated).
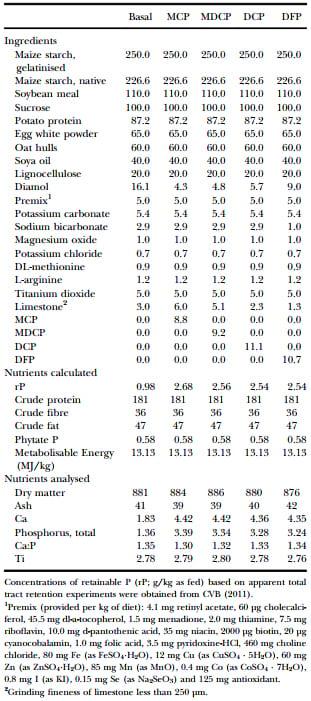
Table 3. Composition of inorganic phosphorus sources tested in Experiment 2 (in g/kg product).
Experiment 2 was part of a larger study and was carried out in two rounds with the same number of treatments and replicates per round. In total, 2200 (1100 per round)-d-old Ross 308 broilers were obtained from a commercial hatchery, of which 480 were used for Experiment 2. Birds were vaccinated against avian infectious bronchitis and Newcastle disease and were group-housed on wood shavings during the first 18 (round 1) and 17 (round 2) days. During these periods, the birds received a commercial starter diet (nutrient concentrations: 199 g/kg crude protein, 10.9 g/kg Ca and 7.0 g/kg P, no addition of exogenous phytase).
From 17/18 d of age until the end of the experiment at d 28, birds were housed in pens with plastic slatted floors (Jansen Poultry Equipment, Barneveld, the Netherlands) in groups of 12 birds per pen resulting in a total number of 40 pens of which 16 were used for the basal diet (8 pens per round) and 6 pens for each of the other diets (3 pens per diet per round). During this period, birds received the experimental diets.
Sample collection and measurements
In Experiment 1, total body weight (BW) per pen was determined at d 14 and 24 of age. Cumulative feed intake was recorded as the difference between feed provided during d 14–24 and feed remaining at d 24. At the end of Experiment 1 at d 24, birds were anaesthetised with 1 ml/kg BW of a 5:3 mixture of Sedanum and Ketamine via injection in the breast muscle and subsequently killed with an injection of 0.5 ml of T61 in the wing artery. Then, the birds were dissected and the posterior third of the small intestinal section between Meckel’s diverticulum and 2 cm before the junction to the caeca was removed and emptied by flushing the separated gut segment with distilled water. After collection, the samples were pooled per pen and immediately frozen and stored at −20°C pending analysis.
In Experiment 2, total BW per pen was determined at d 18 (round 1) and d 17 (round 2). Cumulative feed intake was recorded during d 18–27 for round 1 and d 17–27 for round 2 in the same way as for Experiment 1. At d 25, 26 and 27 of age, representative samples of excreta from the basal diet and the MCP diet were semi-quantitatively collected per pen, two times a day at 8:00 and 16:00 h, over a period of three full days of 24 h. Collection of excreta was semi-quantitative as excreta contaminated with feathers and feed were discarded. After collection, samples were immediately stored at −30°C. Then samples were pooled per pen and stored again at −30°C pending analysis. At d 27 and 28 of age, birds were anaesthetised and killed, and the contents of the posterior ileum were collected, pooled per pen and frozen as described for Experiment 1.
Chemical analyses and calculations
The MCP product used in Experiment 1 was analysed for P and Ca (ISO 11885, 1998c). The test products in Experiment 2 were analysed for P (ISO 6491, 1998a) and Ca (ISO 6869, 2000). Furthermore, for the two experiments, identical chemical analyses and calculations were used. Diets were analysed for dry matter (DM) (ISO 6496, 1998b), crude ash (ISO 5984, 2002), crude protein (ISO 5983, 1997), Ca and P (ISO 11885, 1998c) and Ti (van Bussel et al., 2010). Ileal digesta and excreta of birds were analysed for DM (ISO 6496, 1998b), crude ash (ISO 5984, 2002), Ca and P (ISO 11885, 1998c) and Ti (van Bussel et al., 2010).
The precaecal digestibility and ATTR of P, Ca, DM, ash and organic matter was calculated as follows:
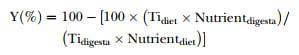
where Tidiet and Tidigesta are the analysed concentrations of Ti in the diet and digesta or excreta (g/kg DM), respectively, and Nutrientdiet and Nutrientdigesta are the analysed concentrations of nutrients in the diet and digesta or excreta, respectively. The pcdP content (g/kg) was determined as the pcdP digestibility (%) × P content (g/kg)/100.
Statistical analysis
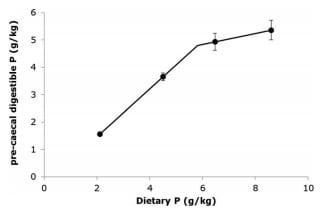
In both experiments, pen was the experimental unit and statistical analyses were carried out using Genstat, 16th edition (Experiment 1) and 17th edition (Experiment 2). In both Experiments 1 and 2, performance characteristics were analysed using Analysis of variance (ANOVA) with phosphate level (Experiment 1) or phosphate product (Experiment 2) as fixed effect, and for Experiment 2, round was included in the model as a random effect. Because in Experiment 1 a significant quadratic effect (P < 0.001) in the response of pcdP to dietary P content was observed, a broken stick regression analysis was carried out to estimate the relationship between pcdP and P (g/kg) (Figure) using the R2Lines procedure of Genstat. This broken stick model included an intercept, two slopes and a break point value. The estimated slopes represent the digestibility of P at inclusion levels below and above the breakpoint.
Figure. Relationship between precaecal digestible P concentration in broiler diets (pcdP; g/kg) (treatments means and standard deviation) and dietary P content (g/kg) analysed with a broken stick regression model represented by the lines. Goodness of fit of the model: R2 = 0.979 and SE = 0.221. Parameter estimates: break point value of precaecal digestible P = 4.80 ± 0.168 g/kg and dietary P = 5.81 ± 0.284 g/kg, slope before break point = 0.880 ± 0.0516, slope after break point = 0.201 ± 0.0735.
In Experiment 2, digestibility of Ca and P for each test product was determined as described in the WPSA (2013) protocol for P using a multiple linear regression model between pcdP content and added dietary P content including a common intercept value for all products and allowing separate regression coefficients for the products tested using the regression procedure in Genstat. In deviation of the WPSA protocol, the determination of the digestibility of Ca and P was based on the inclusion of one rather than two inclusion levels of each test product after having shown a linear response below a P content of 4.8 ± 0.17 g/kg in Experiment 1.
RESULTS
Experiment 1
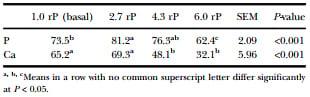
One statistically determined outlier value for the lowest dietary P concentration was removed from the data set and 3 outlier values for the highest dietary P concentration were removed from the data set before fitting the broken stick model. The 3 outlier observations for the highest dietary P concentration were considered outlier values as they had (1) organic matter digestibility values that deviated more than 1.9 standard deviations from the mean organic matter digestibility of 94 ± 1.7% and (2) negative pcdCa digestibility values. In the Figure, the broken stick relationship between pcdP content (g/kg) and dietary P (g/ kg) as analysed for the results in Experiment 1 shows that 98% of variation in pcdP content could be explained by the broken stick model. The pcdP digestibility of MCP, reflected by the slope, was estimated to be 88.0 ± 5.16% before the break point value at a dietary P concentration of 5.8 ± 0.28 g/kg and 20.1 ± 7.35% after this break point value. The performance characteristics are given in Table 4. The rP concentration had a significant (P < 0.001) effect on BW at d 24, average daily gain (ADG) and average daily feed intake (ADFI). Birds receiving the lowest retainable P (rP; g/kg) level diet had lower BW at d 24, lower ADG and lower ADFI compared to birds receiving the other diets with rP concentrations ranging from 2.7 to 6.0. No differences in BW, ADG and ADFI were observed between the diets with rP concentrations ranging from 2.7 to 6.0. The pcdP and pcdCa digestibility values of the diets are shown in Table 5. The rP concentration had a significant (P < 0.001) effect on pcdP and pcdCa digestibility. The pcdP digestibility of the 6.0 rP diet was lower compared to the other rP concentrations. Furthermore, the 2.7 rP diet had numerically the highest pcdP digestibility and had a higher pcdP digestibility compared to the 1.0 and the 6.0 rP diets. The pcdCa digestibility of the 1.0 and 2.7 rP diets were higher than the 4.3 and 6.0 rP diets.
Table 4. Performance characteristics of broilers in Experiment 1 from d 14 until d 24 supplied with diets varying in retainable P (rP; g/kg product).
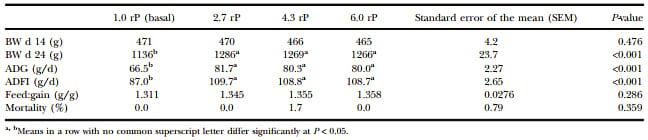
Table 5. Precaecal diet digestibility (%) of P and Ca in Experiment 1 with diets varying in retainable P.
Experiment 2
The performance characteristics of the birds in Experiment 2 as presented in Table 6 were significantly (P < 0.001) affected by the dietary treatments for BW at d 27, ADG, ADFI and feed:gain ratio. Birds fed the basal diet had the lowest ADG, ADFI and highest feed:gain ratio compared to the other treatments. Overall, performance results were highest for MCP and MDCP and lowest for DFP.
In Table 7, the precaecal digestibility of DM, ash, P and Ca of the experimental diets is presented. Highly significant effects (P < 0.001) on precaecal digestibility of ash, Ca and P were observed. The dietary precaecal digestibility of ash, P and Ca was significantly lower for the DFP diet compared to the other diets (except the basal diet). The pcdP digestibility was higher for MCP and MDCP diets compared to the DCP and DFP diets and the pcdP digestibility of the DCP diet was higher than that of the DFP diet. The pcdCa digestibility of the MCP diet was higher than that of the DCP diet.
Table 6. Performance characteristics of broilers in Experiment 2 from d 18 (Round 1)/d 17 (Round 2) until d 27 supplied with a low-P basal diet or the same diet supplemented with monocalcium phosphate (MCP), monodicalcium phosphate (MDCP), dicalcium phosphate (DCP) and defluorinated phosphate (DFP).
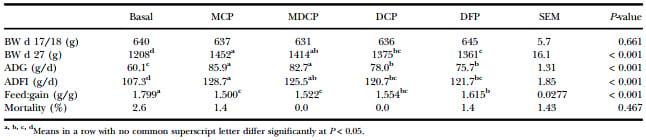
Table 7. Precaecal diet digestibility (%) of DM, ash, P and Ca of a low-P basal diet or the same diet supplemented with monocalcium phosphate (MCP), monodicalcium phosphate (MDCP), dicalcium phosphate (DCP) and defluorinated phosphate (DFP), determined in broilers at 27 d of age.
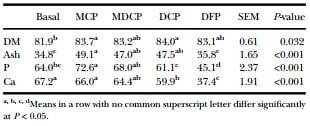
Table 8. Precaecal digestibility (%) of P (pcdP%) and Ca (pcdCa%) of monocalcium phosphate (MCP), monodicalcium phosphate (MDCP), dicalcium phosphate (DCP) and defluorinated phosphate (DFP), determined in broilers at 27 d of age.
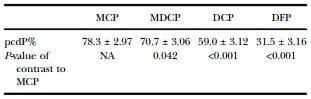
In Table 8, the pcdP digestibility values for the 4 test products are presented. Results in Table 8 show that pcdP digestibility is highest for MCP followed by MDCP, DCP and DFP. Compared to MCP, pcdP digestibility of the MDCP, DCP and DFP were significantly lower (P = 0.042 for MDCP and P < 0.001 for DCP and DFP).
For the MCP diet and the basal diet, the ATTR of P and Ca was determined as well. The ATTR of P and Ca for the basal diet was 65.4 ± 0.99 and −1.7 ± 2.62%, respectively, and ATTR of P and Ca for the MCP diet was 71.3 and 57.2%, respectively. For the test product MCP, the ATTR of P was 75.3 ± 1.1.
DISCUSSION
Experiment 1
Experiment 1 was conducted to estimate the dietary (digestible) P content above which a decrease in precaecal P digestibility is to be taken into account. From the published literature, this was not clear. For example, Rodehutscord et al. (2012) observed a linear increase in pcdP with increasing concentrations of dietary P content up to 8.14 g/ kg. Results of Experiment 1 show that the marginal efficiency of precaecal absorption of P declined above a certain level of P intake and absorption. The broken line model indicated that this decline started at a pcdP concentration of 4.8 ± 0.17 g/kg feed. Rodehutscord et al. (2012) determined the pcdP of MCP (g/kg) in an experiment with 5 incremental concentrations of dietary P, ranging from 2.39 to 8.14 g/kg, by adding MCP to a basal ration. The range in determined pcdP was 0.94–3.0 g/kg. For this range, a linear relationship between pcdP and dietary P (g/kg) was observed, that is, no break point could be established. In contrast, a break point was established in the response of P in the excreta to an incremental dietary P content. This indicates that excretion of excess P in the urine progressively increased at a concentration of dietary P below the level of dietary P at which precaecal absorption of dietary P started to decline. In the study of Rodehutscord et al. (2012), a progressive increase in excretion of P was observed above a dietary P concentration of 5.2 g/kg, corresponding with a pcdP concentration of 2.46 g/kg and an ATTR P concentration of 2.71 g/kg. This ATTR P concentration of 2.71 g/kg agreed well with the break point value of ATTR of P of 2.4 g/kg observed in a study from Leske and Coon (2002). The results from Rodehutscord et al. (2012) and Leske and Coon (2002) combined with the results of Experiment 1 in the present study indicate that a decline in ATTR may be observed at a lower P intake than a decline in precaecal digestibility, presumably due to a progressive increase in P excretion in the urine. The precaecal digestibility of P seems reliable below a pcdP concentration of at least 3.7 g/kg feed and probably even below 4.8 g/kg, because in the present study, in Experiment 1, the model estimated a relation linear up to 4.8 g pcdP/kg. The range in observed pcdP levels in the experiment was sufficiently large to estimate a break point value. However, because of the limited number of pcdP levels created in Experiment 1, it remains unknown whether or not there truly is a distinct break point value. The determined pcdP digestibility of MCP of 88.0% in the current study agrees well with the ATTR of P values from CVB (2011) for monohydrate MCP of 85% but is higher than the pcdP content observed in Experiment 2 of 78.3%.
Experiment 2
The results of pcdP digestibility for the diets shown in Table 7, combined with the P contents of the same diets shown in Table 2, show that the highest observed pcdP was 2.46 g/kg for the MCP diet, which is well below the break point value of 4.8 ± 0.17 g/kg established in Experiment 1. This indicates that the conditions of Experiment 2 were adequate for testing a reliable pcdP value for the different feed phosphates.
Growth performance of the birds receiving the basal and DFP diets were considerably below the performance of birds of the MCP, MDCP and DCP treatments (Table 6), indicating that retainable P supply for these treatments was below the optimum. Similar negative effects of a low dietary P concentration on performance were observed in other studies as well (Leske and Coon, 2002; Yan and Waldroup, 2006; Mello et al., 2012). A difference in pcdP digestibility for MCP was observed between Experiment 1 (88.0%) and Experiment 2 (78.3%). Different MCP sources were used for Experiment 1 (Aliphos Bulgaria) and Experiment 2 (a mixed product of sources from different origins; Aliphos, the Netherlands; Aliphos, Bulgaria; Yara, Sweden and Timab, France). Probably, differences in chemical composition and production processes between the MCP sources used in Experiments 1 and 2 caused these differences in pcdP digestibility. Another explanation for the difference in pcdP digestibility between Experiments 1 and 2 is the higher Ca:P ratio in Experiment 2 (1.33 average) compared to Experiment 1 (1.16 average), which might have contributed to more phytate–Ca complex formation and consequently a decreased absorption of phytate P (Tamim et al., 2004; Amerah et al., 2014). This is supported by results of a study of Rodehutscord et al. (2012), in which an even lower pcdP digestibility of MCP of 42% was established in diets with an average Ca:P ratio of 1.83. Both in the study of Rodehutscord et al. (2012) and in the present study, diets low in phytate P were used and the P contents in the basal diets were low (<2.40 g/kg). In contrast to the explanation of a negative effect of a high Ca:P ratio, in a study from Van der Klis and Versteegh (1992a) for MCP a high ATTR of P of 79% was observed at a Ca:P ratio of 2.27, where MCP was regarded to be the only dietary P source. In the study of Van der Klis and Versteegh (1992a), the MCP digestibility was determined at a low retainable P concentration of 2.05 g/kg.
The pcdP digestibility of the anhydrous DCP of 59.0% observed in this study is in between the ATTR values of 76% and 53% for dihydrated DCP and anhydrous DCP, respectively, as measured in the study from Van der Klis and Versteegh (1992b) but closer to the value for the anhydrous form. However, the pcdP digestibility value of anhydrous DCP of 59.0% established in this study is substantially higher than the pcdP digestibility of anhydrous DCP of 25.0–30.0% observed in the study of Shastak et al. (2012). In the same study of Shastak et al. (2012), a pcdP digestibility of 54–67% for monosodium phosphate was found which is low compared to reported monosodium phosphate digestibility (Van der Klis and Versteegh, 1996), and indicates that the differences in pcdP digestibility between DCP observed in this study and observed in the study of Shastak et al. (2012) may be attributed to systematic differences in experimental conditions and not to differences in DCP properties per se.
The pcdP digestibility of MDCP of 70.7% observed in this study was substantially lower than the ATTR value of 80.3% observed in a study from Van der Klis and Versteegh (1998a) in which MDCP was regarded as the only P source and tested at a retainable P concentration of 3.13 g/kg with a Ca:P ratio of 1.79. In another study of Van der Klis and Versteegh (1998b), two MDCP sources were tested resulting in precaecal P digestibility values of 72.2% and 81.8%, indicating that substantial differences in MDCP qualities exist. Unfortunately, no information was provided with respect to the degree of hydration of the two MDCP sources and their DM, Ca and P content.
For DFP, no literature data was found to be used for comparison with the observations in the present study. The results of this study indicate a much lower pcdP digestibility compared to the other commonly used phosphate products.
Because of the large differences in observed digestibility of inorganic P sources between studies, it might be argued that in future research, in addition to absolute pcdP digestibility values, more focus should be paid to differences between inorganic phosphate sources within studies and on describing the degree of hydration of the products tested. Compared to other studies, in the present study, a comparison is possible between the major inorganic phosphate sources.
At the basal diet, an unexpected low ATTR of Ca of −1.7 ± 2.62% was observed. This low ATTR of Ca is likely caused by the low P supply in the basal diet and the preferential retention of P in soft tissue (i.e. muscle and organs) rather than in bone as hydroxy apatite. Since the Ca content in soft tissue is very low (Ca:P is 1:35 in broiler meat according to Fuentes Zapata et al. (1998)), the majority of Ca is excreted. This finding emphasises that total tract digestibility studies cannot be used for the determination of Ca digestibility in feedstuffs, but rather reflect the retention in body tissue.
In this study, P sources from different suppliers were pooled to form MCP, MDCP and DCP mixtures. The determined precaecal P and Ca digestibility of these pooled P mixtures can be considered as average values for these type of P sources being used in Europe but it should be realised that digestibility values of individual MCP, MDCP and DCP products might differ from these average values as a result of differences in chemical composition and production processes (Viljoen, 2001). This becomes also evident from the difference in pcdP digestibility of MCP between Experiments 1 and 2 in the current study.
It is concluded that the response in pcdP digestibility to increments in dietary P concentration is linear over a wider range of dietary P than the response in P retention based on ATTR. A reduction in precaecal absorption of P was observed above an estimated pcdP concentration of 4.8 g/kg. In Experiment 2, in which pdcP digestibility of inorganic P sources were determined at marginal dietary pcdP contents of maximal 2.5 g/kg, the pcdP digestibility of the P sources, representing a mixture of available products in the market, was 78.3% for MCP, 59.0% for DCP, 70.7% for MDCP and 31.5% for DFP.
DISCLOSURE STATEMENT
No potential conflict of interest was reported by the authors.
This article was originally published in British Poultry Science, 2016 Vol. 57, No. 6, 810–817, http://dx.doi.org/10.1080/00071668.2016.1222604. This is an Open Access article distributed under the terms of the Creative Commons Attribution-NonCommercial-NoDerivatives License (http://creativecommons.org/licenses/by-nc-nd/4.0/).
REFERENCES
AMERAH, A.M., PLUMSTEAD, P.W., BARNARD, L.P. & KUMAR, A. (2014) Effect of calcium level and phytase addition on ileal phytate degradation and amino acid digestibility of broilers fed corn-based diets. Poultry Science, 93: 906–915. doi:10.3382/ps.2013-03465
CVB (CENTRAAL VEEVOEDERBUREAU) (2011) Table on Feed Ingredients. Data on the Chemical Composition, Digestibility and Nutritional Value of Feedstuffs. (Product Board Animal Feed, Den Haag, The Netherlands).
FUENTES ZAPATA, J.F., DOS REIS MOREIRA, R.S., FREIRE FUENTES, M.D.F., MIRANDA SAMPAIO, E. & MORGANO, M. (1998) Meat mineral content in broilers fed diets without mineral and vitamin supplements. Pesquisa Agropecuaria Brasileira, 33: 1815–1820.
GEORGIEVSKII, V.I., ANNENKOV, B.N. & SAMOKHIN, V.I. (1982) Mineral Nutrition of Animals. Studies in the Agricultural and Food Sciences. (Butterworth & Co, London). ISBN 978-0-408- 10770-7.
INTERNATIONAL ORGANIZATION FOR STANDARDIZATION (1997) Animal Feeding Stuffs. Determination of Nitrogen Content and Calculation of Crude Protein Content. Kjeldahl Method. ISO 5983. (Geneva, Switzerland, Int. Organ. Standardization).
INTERNATIONAL ORGANIZATION FOR STANDARDIZATION (1998a) Animal Feeding Stuffs. Determination of Phosphorus Content – Spectrometric Method. ISO 6491. (Geneva, Switzerland, Int. Organ. Standardization).
INTERNATIONAL ORGANIZATION FOR STANDARDIZATION (1998b) Animal Feeding Stuffs. Determination of Moisture and Other Volatile Matter Content. ISO 6496. (Geneva, Switzerland, Int. Organ. Standardization).
INTERNATIONAL ORGANIZATION FOR STANDARDIZATION (1998c) Water Quality. Determination of 33 Elements by Inductively Coupled Plasma Atomic Emission Spectroscopy. ISO 11885. (Geneva, Switzerland, Int. Organ. Standardization).
INTERNATIONAL ORGANIZATION FOR STANDARDIZATION (2000) Animal Feeding Stuffs. Determination of the Contents of Calcium, Copper, Iron, Magnesium, Manganese, Potassium, Sodium and Zinc – Method Using Atomic Absorption Spectrometry. ISO 6869. (Geneva, Switzerland, Int. Organ. Standardization).
INTERNATIONAL ORGANIZATION FOR STANDARDIZATION (2002) Animal Feeding Stuffs. Determination of Crude Ash. ISO 5984. (Geneva, Switzerland, Int. Organ. Standardization).
LESKE, K. & COON, C. (2002) The development of feedstuff retainable phosphorus values for broilers. Poultry Science, 81: 1681–1693. doi:10.1093/ps/81.11.1681
LIU, Y., VILLALBA, G., AYRES, R.U. & SCHRODER, H. (2008) Global phosphorus flows and environmental impacts from a consumption perspective. Journal of Industrial Ecology, 12: 229–247. doi:10.1111/j.1530-9290.2008.00025.x
MELLO, H.H.C., GOMES, P.C., ROSTAGNO, H.S., ALBINO, L.F.T., DA ROCHA, T.C., DE ALMEIDA, R.L. & CALDERANO, A.A. (2012) Dietary requirements of available phosphorus in growing broiler chickens at a constant calcium: available phosphorus ratio. Revista Brasileira de Zootecnia, 41: 2323–2328. doi:10.1590/S1516-35982012001100004
RODEHUTSCORD, M., DIECKMANN, A., WITZIG, M. & SHASTAK, Y. (2012) A note on sampling digesta from the ileum of broilers in phosphorus digestibility studies. Poultry Science, 91: 965–971. doi:10.3382/ps.2011-01943
SHASTAK, Y., WITZIG, M., HARTUNG, K. & RODEHUTSCORD, M. (2012) Comparison of retention and prececal digestibility measurements in evaluating mineral phosphorus sources in broilers. Poultry Science, 91: 2201–2209. doi:10.3382/ps.2011- 02063
SHASTAK, Y., ZELLER, E., WITZIG, M., SCHOLLENBERGER, M. & RODEHUTSCORD, M. (2014) Effects of the composition of the basal diet on the evaluation of mineral phosphorus sources and interactions with phytate hydrolysis in broilers. Poultry Science, 93: 2548–2559. doi:10.3382/ps.2014-03961
SUTTLE, N.F. (2010) Mineral Nutrition of Livestock: Fourth Edition, Wallingford, UK, CABI pp. 1–547.
TAMIM, N.M., ANGEL, R. & CHRISTMAN, M. (2004) Influence of dietary calcium and phytase on phytate phosphorus hydrolysis in broiler chickens. Poultry Science, 83: 1358–1367. doi:10.1093/ps/83.8.1358
VAN BUSSEL, W., KERKHOF, F., VAN KESSEL, T., LAMERS, H., NOUS, D., VERDONK, H., VERHOEVEN, B., BOER, N. & TOONEN, H. (2010) Accurate determination of titanium as titanium dioxide for limited sample size digestibility studies of feed and food matrices by inductively coupled plasma optical emission spectrometry with real-time simultaneous internal standardization. Atomic Spectroscopy, 31: 81–88.
VAN DER KLIS, J.D. & VERSTEEGH, H.A.J. (1992a) De beschikbaarheid van fosfor voor slachtkuikens in de voederfosfaten Rükana en Rükana-phos. Verslag No. 130. (Beekbergen, The Netherlands, COVP-DLO).
VAN DER KLIS, J.D. & VERSTEEGH, H.A.J. (1992b) De beschikbaarheid van fosfor voor slachtkuikens in plantaardige en dierlijke veevoedergrondstoffen en in voederfosfaten. Verslag No. 132. (Beekbergen, The Netherlands, COVP-DLO).
VAN DER KLIS, J.D. & VERSTEEGH, H.A.J. (1996) Phosphorus nutrition of poultry, in: GARNSWORTHY, P.C., WISEMAN, J. & HARESIGN, W. (Ed) Recent Advances in Animal Nutrition, pp. 71–83 (Nottingham, UK, Nottingham Univ. Press).
VAN DER KLIS, J.D. & VERSTEEGH, H.A.J. (1998a) The absorbable phosphorus content in mono-dicalcium phosphate (Kynofos 21) in broilers. Report No. 98.051. (Lelystad, The Netherlands, ID-DLO).
VAN DER KLIS, J.D. & VERSTEEGH, H.A.J. (1998b) The absorbable phosphorus content in feed phosphates in broilers. Report No. 98.056. (Lelystad, The Netherlands, ID-DLO).
VILJOEN, J. (2001) Quality of feed phosphate supplements for animal nutrition, in: South African Animal Science, 2 (1):pp. 13–19.
WPSA (WORLDS’S POULTRY SCIENCE ASSOCIATION, WORKING GROUP 2 -NUTRITION- OF THE EUROPEAN FEDERATION OF BRANCHES) (2013) Determination of phosphorus availability in poultry. World’s Poultry Science Journal, 69: 687–698. doi:10.1017/ S0043933913000688
YAN, F. & WALDROUP, P.W. (2006) Nonphytate phosphorus requirement and phosphorus excretion of broiler chicks fed diets composed of normal or high available phosphate corn as influenced by phytase supplementation and vitamin D source. International Journal of Poultry Science, 5: 219–228. doi:10.3923/ijps.2006.219.228
Related topics:
Authors:

Wageningen University & Research

Wageningen University & Research

Influencers who recommended :
Federico A. GomezRecommend
Comment
Share

Yara
24 de febrero de 2023
Last but not least, let's remember what Craig Coon wrote in 2002.
"The quantitative values for feed raw materials (such as inorganic feed phosphates) are needed to make feed formulation decisions about feed P (among others). P pre-caecal digestibility and retention, hence, appear to be the most appropriate criteria for evaluating P sources in poultry."
Recommend
Reply

Would you like to discuss another topic? Create a new post to engage with experts in the community.


You may be interested in
.jpg&w=3840&q=75)