Explore
Communities in English
Advertise on Engormix

Impact of chemical and physical properties on flowability characteristics of corn distillers dried grains with solubles

Published: September 25, 2020
By: Ahmet Y. Pekel 1, Ali Çalik 2, Eren Kuter 3, Mustafa S. Alatas 4, Safa B. Öklen 1, Abdurrahman Kizil 1, Melike Bulat 1, and Özcan Cengiz 5.
Summary

Author details:

1 Department of Animal Nutrition and Nutritional Diseases, Faculty of Veterinary Medicine, Istanbul University-Cerrahpasa, Turkey; 2 Department of Animal Nutrition and Nutritional Diseases, Faculty of Veterinary Medicine, Ankara University, Turkey; 3 Department of Animal Nutrition and Nutritional Diseases, Faculty of Veterinary Medicine, Burdur Mehmet Akif Ersoy University, Turkey; 4 Department of Animal Nutrition and Nutritional Diseases, Faculty of Veterinary Medicine, Selçuk University, Turkey; 5 Department of Animal Nutrition and Nutritional Diseases, Faculty of Veterinary Medicine, Adnan Menderes University, Turkey.

The influence of the physical and chemical composition of corn distillers dried grains with solubles on its flowability was evaluated in the current study. The samples were evaluated for angle of repose, compressibility, Hausner ratio, tapped density, bulk density, mean bulk density, colour and nutrient content. PROC CORR and REG procedures were used to determine correlations. The ether extract was negatively correlated with crude protein and redness (a*), while crude protein was negatively correlated with yellowness (b*). Acid detergent fibre and neutral detergent fibre were negatively correlated with a* and positively correlated with lightness (L*), respectively. Compressibility showed a negative correlation with bulk density. Bulk density, tapped density and mean bulk density did not impact the angle of repose. The angle of repose was positively correlated with the compressibility and Hausner ratio. Apart from the correlation between acid detergent fibre and tapped density, the angle of repose and other physical parameters were not affected by the nutrient composition of the distillers dried grains with solubles samples. In conclusion, the results of this study indicate that nutrient composition has little influence over the flowability of distillers dried grains with solubles but compressibility and the Hausner ratio can be used to predict the potential flow characteristics of corn distillers dried grains with solubles.

Keywords: angle of repose, bulk density, compressibility, distillers dried grains with solubles, flowability.
INTRODUCTION
The rapid expansion of commercial ethanol production, esp. in the United States, has resulted in a significant increase in the availability of corn distillers dried grains with solubles (DDGS), a co-product of the ethanol production process (De Matteis et al., 2019). Total annual ethanol and DDGS production in the USA is 15 billion gallons and 44 million metric tons, respectively, making the USA the world’s largest DDGS producer (US Grains Council, 2019). As DDGS production increases in the USA, larger amounts are being exported to foreign countries, with the top four destinations being Mexico, South Korea, Turkey, and Vietnam (US Grains Council, 2019). Due to the usage of nearly all of the starch in the grain by yeast during fermentation, the proportion of most of the other nutrients such as protein, fat, and fibre, etc. in DDGS increases up to 2- or 3-fold compared to the grain itself (Bandegan et al., 2009). As a consequence, the addition of DDGS to animal diets has become a very common practice due to the high energy, mid-range protein, and high digestible phosphorus content (Swiatkiewicz and Koreleski, 2008; Kingsly et al., 2010). However, a down-side of DDGS is its poor flow characteristics especially in storage and transport vessels, this factor can have a direct negative impact on its marketability (Kingsly et al., 2010). The flowability of feed mixtures is an important aspect of the feed handling characteristics that affect both feed manufacturing and farm feed operations such as storage in silos and feeding systems (Ganesan et al., 2008). Flowability can be defined as the ability of a powder to flow in the desired manner in a specific piece of equipment. Therefore, it depends on both the feed characteristics which are mainly physical properties and the equipment and container used for handling, storing or processing the feed material (Juliano and Barbosa-Canovas, 2010). The bulk density (BD), moisture content, particle size, particle shape, permeability, and conductivity are some of the physical properties that have been identified as having an impact on feed flow characteristics (Bhadra etal., 2008; Crawford et al., 2016). Moreover, the flowability of feedstuffs can also be significantly influenced by their chemical composition, such as ether extract (EE) and crude protein contents (CP) (Bhadra et al., 2008).
The angle of repose (AR) is often used as an indication of the flow characteristics of powders including feeds. The AR is the maximum angle of a pile to the horizontal surface at which the material can remain in place without sliding or slump-ing (Zou and Brusewitz, 2002). Bhadra et al. (2009) reported that commercial DDGS samples had the potential for flow problems in the field. Moreover, the flow of DDGS has been reportedly impaired by caking and bridging during its storage and transportation (Ganesan et al., 2008). Since DDGS is a hygroscopic product, under appropriate conditions such as long distance shipping in a high humidity environment the formation of caking may occur (Saragoni et al. 2007). In particular, the chemical composition has been found to influence the water sorption of DDGS, which suggests the possible role of nutrients in the caking process (Kingsly and Ileleji, 2009). However, information concerning the chemical features affecting the flow characteristics of DDGS is scarce. In addition, BD of DDGS has been identified as having a key effect on flowability (Keirleber and Rosentrater, 2010). Therefore, it was hypothesized that BD, compressibility, and the nutrient composition of DDGS are some of the features that might affect its flowability through AR.
The aim of the current study was to determine the significant physical and chemical properties that influence the flow characteristics of DDGS which can be used to estimate its flowability.
MATERIALS AND METHODS
The DDGS samples (n = 18) used in the current study were gathered from different feed mills between March and December 2017. Special attention was paid to collecting samples with colour characteristics ranging from light yellow to dark yellow in visual appearance in so far as this was possible (b* values were from 28 to 36) to improve the degree of variety and cover a wide range of samples with different colour features. Approximately 1 kg of each sample was sealed in plastic bags and stored at 4°C until analysis.
Samples of DDGS were ground to a sufficiently fine consistency to pass through a 0.5 mm screen using an ultracentrifugal rotor mill grinder (Retsch ZM 200, Retsch GmbH Co. KG, Haan, Germany). The dry matter (DM), crude ash, EE, CP, P, crude fibre, acid detergent fibre (ADF), and neutral detergent fibre (NDF) were determined in triplicate. The DM content of the samples was determined by drying the samples at 105°C for 18 h in an oven (method 930.15; AOAC, 2006). The crude ash content of the DDGS samples was determined by ashing in a muffle furnace overnight at 600°C (method 942.05; AOAC, 2006). The ether extract content of the samples was determined with the use of a gravimetric extraction procedure using petroleum benzene in a Soxhlet apparatus for approximately 2 hours and 15 minutes (method 984.13; AOAC, 2006). The nitrogen content was determined with a Kjeltec analyser (method 984.13; AOAC, 2006) using the Kjeldahl method. In brief, the samples were digested in a digester (Gerhardt Kjeldatherm KB, Bonn, Germany) using sulphuric acid and then the resulting ammonium sulphate was distilled using NaOH in a distillation unit (Gerhardt Vapodest 50 Carousel, Germany). The crude protein values were derived from multiplying the nitrogen values by a factor of 6.25. Acid molybdate and Fiske-Subbarow reducer solutions were used to measure the concentration of P through the formation of a phosphomolybdenum com-plex and the P concentrations in the digested samples were determined through the use of spectrophotometry by measuring the absorbance at 620 nm (method 946.06; AOAC, 2006) using a plate reader (Biotek Synergy Neo2, Biotek Instruments, Winooski, VT, USA). The crude fibre, ADF, and NDF contents were determined using a fibre analyser (Ankom 200 Fiber Analyzer, Ankom Technology, Fairport, NY) and a filter paper technique (Van Soest et al., 1991).
The L* (lightness), a* (redness), and b* (yellowness) values of the DDGS samples were measured in triplicate using a Minolta chromameter (Minolta ChromaMeter CR-300, Milano, Italy). In brief, the samples were placed in a petri dish (90 mm diameter) to a depth of approximately 2 cm before colour measurements were taken. Measurements were taken from 3 different locations on the outer surface of each DDGS sample.
The AR for each sample was determined in triplicate by funnel test and used as an indicator of the flowability characteristic. A fixed funnel tip with a height of 2 cm from the horizontal surface was used to determine the AR value of each sample. The diameter of the funnel, its extension, and its total length were 18, 21, and 29 cm, respectively. A quantity of DDGS from each sample was allowed to flow through the funnel onto a filter paper until the apex of the pile beneath came into contact with the lower tip of the funnel. Then, the loose portion of the DDGS sample on the filter paper was marked with a pencil and the pile was removed. The diameter of the formed pile was measured twice (horizontally and vertically) and its average was taken. This process was repeated three times and the average diameter (d) and radius (r = d/2) were calculated. Based on the height of the funnel and the radius determined, AR was calculated by taking the inverse tangent (tan) of the height (h)  of the pile to the r of the pile [(AR = tan−1(h r–1)] (Joshi et al., 1993; Aliyu et al., 2010).
The DDGS samples were evaluated for BD, tapped density (TD), mean bulk density (MBD), and compressibility in triplicate. The aerated bulk density (kg m–3) was calculated by dividing the weight of the feed sample (15 g) by its vol-ume using a measuring cylinder. The tapped density (kg m–3) was obtained after rotating a graduated cylinder (100 ml) containing a DDGS sample (15 g) using a vortex mixer for 2 min and then mechanically tapping it until no further vol-ume change occurred. The mean bulk density (kg m–3) was obtained by taking the average of BD and TD. The Hausner ratio (HR) was defined as the TD divided by BD. The compressibility (C) of the samples was calculated by using the Carr index formula C = 100 1 / TD BD (Carr, 1965).
The data were subjected to linear regression using the PROC REG procedure and Pearson correlation (R) analysis was conducted by using the PROC CORR procedure of SAS software (SAS, 2006).
RESULTS AND DISCUSSION
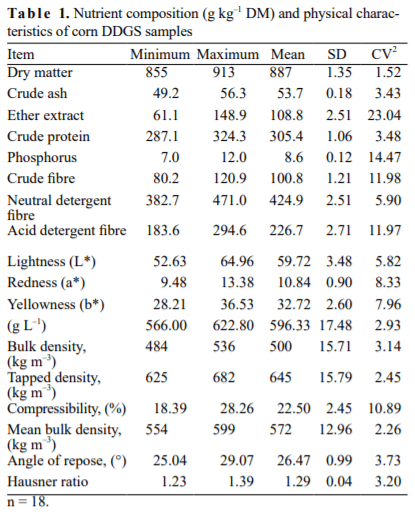
Corn DDGS is a co-product of the dry-grinding ethanol industry that has gained popularity among poultry producers due to its competitive nutrient content, availability and price. The nutrient composition of the corn DDGS samples was summarized in Table 1. The average nutrient levels in the current study generally fit within the range reported by others for corn DDGS. The average ash content of 54 g kg–1 DM measured in the current study was within the range (39-63 g kg–1 DM) reported by other studies (Akayezu et al., 1998; Belyea et al., 2004; Ortín and Peiqiang, 2009; Belyea et al., 2010).The CV value (3.43) of the ash content found in the DDGS samples in the current study was significantly lower than the CV value of 25 obtained for 10 DDGS samples by Wang etal. (2018). This difference between the two studies may bedue to differences between the varieties of the corn used, soil type, and fertilizer applied when growing corn or the different DDGS production protocols used by different plants (Samson and Mehdi, 1998). The CP content of the DDGS samples in the current (287-324 g kg–1 DM) study showed a range of values very similar to that observed in previous studies (301-320 g kg–1 DM) (Akayezu et al., 1998; Belyea et al., 2004; Ortín and Peiqiang, 2009; Belyea et al., 2010).However, the CV of the CP content in the current study (3.48) was lower than the published values (4.69-7.7) by other authors (Spiehs et al., 2002; Belyea et al., 2004; Belyea et al., 2010; Wang et al., 2018). On the other hand, the CV value of 23 for the EE content in the current study was greater than the CV value of 6.5 reported by Belyea et al.(2004) for 235 DDGS samples. Distillers dried grains and distillers solubles are two intermediate products of ethanol production by the dry-grinding method. The solubles intermediate product of this production has a high fat content and for the most part it is added back to distillers dried grains in part to increase its fat level and the end product is called DDGS (Adeola and Zhai, 2012). However, this procedure may be different from plant to plant and therefore this might also have contributed to the higher variations in EE content in the current study. Moreover, 7 DDGS samples in the current study had an EE content lower than 100 g kg–1 DM which was most likely due to the removal of the extra oil from DDGS samples by DDGS plants. Guney et al. (2013) reported that ethanol producers could extract some of the oil in the DDGS and use the term low-oil DDGS for the leftover product. They also reported that DDGS with a lower than 99 g kg–1 EE can be defined as low-oil DDGS. Therefore, it seems reasonable to define the 7 samples in the current study as low-oil DDGS and this may explain, in part at least, the higher CV value of EE for the DDGS samples. The total P level ranged from 7 to 12 g kg–1 DM which is comparable to previous results reporting average P levels of between 7.7 and 8.9 g kg–1 DM (Shurson et al., 2001; Ortín and Peiqiang, 2009; Pekel et al., 2013). The acid detergent fibre (226.7 g kg–1 DM) and NDF (424.9 g kg–1 DM) content of the DDGS samples were higher than the reported ADF and NDF values of 135.3 g kg–1 DM and 370.8 g kg–1 DM by Wang et al. (2018), respectively. But they were lower than the ADF and NDF values of 237.3 and 588.9 g kg–1 DM reported by Belyea et al. (2010).
Impact of chemical and physical properties on flowability characteristics of corn distillers dried grains with solubles - Image 1
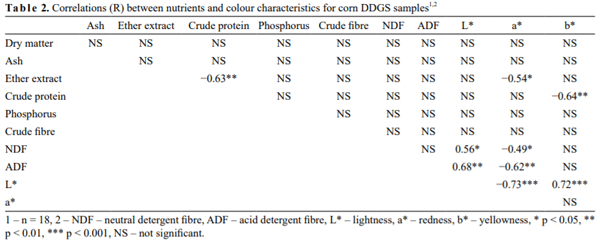
As the CP content of the DDGS samples increases, the EE  and b* values decreased (R = −0.63 for EE and −0.64 for b*, Table 2). In a similar way, significantly negative correlations have also been reported between CP−EE and CP−b* for corn DDGS by Pekel et al. (2013). Redness (a*) was negatively correlated with the content of ADF (R = −0.62), NDF (R = −0.49) and EE (R = −0.54). Similarly, Pekel et al. (2013) also reported a negative correlation between ADF and a* for DDGS samples. Lightness was positively correlated with ADF (R = 0.68) and NDF (R = 0.56). Lightness was also positively correlated with b* (R = 0.72) and negatively correlated with a* (R = −0.73). Collectively, darker (low L*) and more red-coloured (high a*) DDGS samples were more likely to have a lower fibre content. On the other hand, the less red- and yellow-coloured the DDGS samples, the higher the EE and CP content. However, since the R2 values (0.24 to 0.46) of these relationships were low, presumably they are of limited use under field conditions.
The major problem encountered in using DDGS is the difficulty with handling and storage due to its poor flow characteristics caused by caking between its particles as shown by Bhadra et al. (2009). Therefore, the aim of the study was to determine the effects of the physical and chemical composition of the DDGS samples on its flowability characteristics. The characterization of the physical properties of DDGS is essential to understanding its flow behaviour during production, processing (i.e. mixing, drying, etc.), transport, and storage, this study may aid in the design of appropriate equipment or tools to improve the handling of DDGS in the field (Baryeh, 2002). The physical parameters reported to affect the flowability of DDGS, these include moisture/relative humidity, BD, particle size, the shape of the particles, and particle size distribution/interaction (Ganesan et al., 2008; Bhadra et al., 2009; Pinotti and Dell’Orto, 2011). Moreover, Ganesan et al. (2005) reported that the addition of the solubles portion and moisture negatively affected the flowability of DDGS. Other researchers have also reported that the higher the moisture content, the larger the AR, and therefore, the poorer the flowability for other types of oilseeds and grains (Hossain et al., 1998; Amin et al., 2004). On the other hand, Ganesan et al. (2008) reported that while increasing the moisture content of DDGS from 100 to 200 g kg–1 decreased its flowability, it was interesting to note that increasing it further to a range of 250 to 300 g kg–1 had the opposite effect. Therefore, they speculated that increasing the moisture content up to a certain point might have acted as a lubricant. In contrast, in an earlier study, Rosentrater (2006) reported that the moisture content was negatively correlated with AR for 18 DDGS samples (the moisture level varied between 130 and 210 g kg–1), which suggested an improvement in flowability with the increased moisture content. However, the r value was low (–0.33), and this decreases the reliability of the results. No attempt was made to increase the moisture content of the DDGS samples and the moisture levels were determined to lie between 87 and 145 g kg–1 which is lower than 200 g kg–1 value and this may explain the lack of a moisture (DM) effect on AR for the DDGS samples in the current study (Table 3). Moreover, Saragoni et al. (2007) reported that DDGS is highly hygroscopic and therefore has the inclination to cake when its moisture content reach-es levels high enough to stimulate stickiness which results in caking. Taking the two effects of moisture together, it seems likely that the effect of moisture on the flowability of DDGS depends on its level and therefore moisture should be closely monitored.
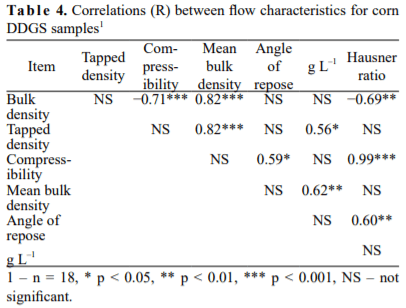
The bulk densities of the DDGS samples in the current study ranged from 484 to 536 kg m–3 and these values were in close agreement with the 391 to 590 kg m–3 BD data obtained by others (Rosentrater, 2006; Bhadra et al., 2009). Tapped density has been reported to be a better way of describing BD during storage in bins or during transportation which can physically force air out of the stored material (Bhadra et al., 2009). Therefore, it is important to determine the TDof the DDGS samples before any handling. Moreover, in the current study TD was around 29% higher than its respective mean BD value which may be used to estimate its compressibility and it may also be used to calculate the storage and transfer capacity of DDGS in the field. However, in a previous report, it was shown that the TD of the DDGS samples varied based on the load applied to pack DDGS in which the 1 kN load resulted in higher TD values compared to the 50 N load (19% compressibility with 1kN versus 5% compressibility with 50N) (Keierleber and Rosentrater, 2010). Therefore, there is a need to establish a standard protocol for estimating the compressibility and TD values of DDGS. Neither BD nor TD was correlated with AR (Table 4) and therefore the flowability of the DDGS samples in the current study which is in line with the data reported by Rosentrater (2006). Collectively, the TD of DDGS may be a strong indicator of its storage and packing quality, although it is not correlated with AR in the current study.
Impact of chemical and physical properties on flowability characteristics of corn distillers dried grains with solubles - Image 2
 
Impact of chemical and physical properties on flowability characteristics of corn distillers dried grains with solubles - Image 3
 
Impact of chemical and physical properties on flowability characteristics of corn distillers dried grains with solubles - Image 4
The colour and physical parameters determined in the current study were not correlated with each other as might be expected. In contrast, Bhadra et al. (2012) speculated that the colour and brightness of a product could indicate the level of nutrients and therefore, in turn, it could affect the flow properties of DDGS. Rosentrater (2006) showed significant negative correlations between BD and L* and between BD and a*. However, they also reported no significant correlations between the colour and AR of the samples which is in line with the current study. Although two correlations between ADF−TD and ADF−g L–1 were observed in the current study, there was no correlation between AR and any nutrient. Therefore, the flow characteristics of DDGS appear to be independent of its nutrient composition, at least for the data set in the current study.
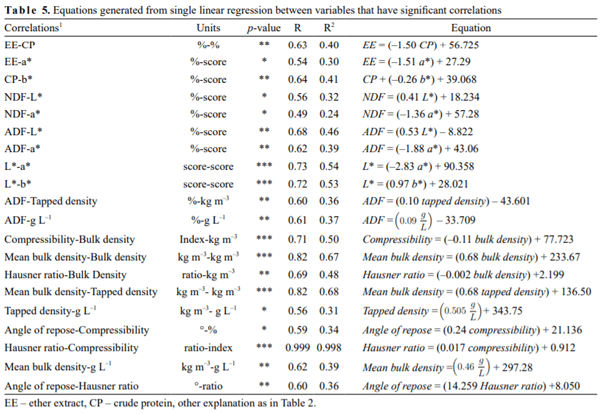
The AR measurement has been used previously as a measure of the flow characteristics of solids including feed ingredients and diets (Zou and Brusewitz, 2002). It is defined as the steepest angle between the slope of a pile and the horizontal plane at which a granular solid mate-rial can be piled without sliding or slumping. The lower the AR, the better the flowability. In general, any solid mate-rial with AR values between 25 and 35° has favourable flowability characteristics (Bhadra et al., 2009). The AR of the DDGS samples in the current study was between 25 and 29° and therefore it can be considered to have a good flowability. Another measure for flowability is called HR which is a common unit for defining the compressibility of solids besides the compressibility itself. This was confirmed by the very high correlation (R = 0.99) between HR and compressibility in the current study. The Hausner ratio of a solid may be calculated by determining the ratio of TD to BD. Hausner values higher than 1.25 generally indicate that the material has poor flowability characteristics, whereas values lower than 1.25 are an indication of good flowability. The mean HR for the DDGS samples in the current study was 1.29 and therefore, as determined by this particular factor, it roughly falls under the category of poor flowability whereas the opposite was found to be true when using the AR data. This contradiction may suggest that it is most likely not enough to just use AR data to arrive at a conclusion concerning the flowability characteristics of DDGS. This hypothesis was supported by the significant correlation (R = 0.60, R2 = 0.36) found between HR and AR in the current study. Similarly, Bhadra et al. (2009) also showed that HR exhibited a high linear correlation with AR in DDGS samples. Moreover, the results of the current study also indicated that HR (R2 = 0.36) was a slightly better predictor of AR than the compressibility index (R2 = 0.34, Table 5). Although in both cases the R2values were low, indicating that estimating AR, and therefore the flowability of DDGS from both correlations was of low practical value. The prediction equations calculated from significant correlations are shown in Table 5. No association was found between AR and the nutrient composition of the DDGS samples in the current study. While compressibility was negatively correlated with BD (R = −0.71), on the other hand, it was positively correlated with AR (R = 0.59). Therefore, the greater the compressibility value, the higher the AR, which indicates less flowability for the DDGS samples. Ganesan et al. (2008) and Keierleber and Rosentrater (2010) also showed that the greater the BD of DDGS, the less compressible it is which confirms the result of the current study. Although the R2 value obtained was low (0.34), the flowability of the DDGS samples may be predicted by using compressibility data. Therefore, besides HR, the compressibility value which ranged from 18 to 28% in the current study can also be of use in selecting DDGS with better flow characteristics.
Impact of chemical and physical properties on flowability characteristics of corn distillers dried grains with solubles - Image 5
 
Impact of chemical and physical properties on flowability characteristics of corn distillers dried grains with solubles - Image 6
Thus, taken together, these observations may indicate that DDGS samples with low compressibility and high BD values would have better flow characteristics and equations generated from the significant correlations shown in Table 5 can be used to estimate AR from the compressibility and HR values. Although HR and compressibility values could be used to provide useful information for the feed industry using the equations calculated in the current study, it needs to be determined whether or not this assumption also holds true for the industrial scale. Mean bulk density is closely correlated (R = 0.82) with BD and TD which is logical because MBD was calculated using both densities in the current study. Table 6 shows the multiple regression equations generated from significant correlations between the different parameters tested in the current study that may be used to predict CP, EE, a*, and L* in DDGS.
CONCLUSIONS
1. The crude protein content was negatively correlated with the ether extract values. Lightness (L*) and redness (a*) may be used to estimate the acid detergent fibre and the neutral detergent fibre content of distillers dried grains with solubles.
2. The nutrient composition did not appear to affect the angle of repose and therefore the flowability of distillers dried grains with solubles.
3. Bulk density, tapped density and mean bulk density did not influence the flowability of distillers dried grains with solubles.
4. Compressibility and the Hausner ratio were good predictors of the angle of repose and therefore may be used to estimate the flowability of distillers dried grains with solubles.
5. Further studies with a larger sample size under different conditions such as storage and transportation are required to better understand the flow characteristics of distillers dried grains with solubles.
Conflict of interest: The authors declare that they haveno conflict of interest.
This article was originally published in International Agrophysics, 2020, 34, 195-202. doi: 10.31545/intagr/117502. This is an Open Access article under a Creative Commons Attribution License.

Adeola O. and Zhai H., 2012. Metabolizable energy value of dried corn distillers grains and corn distillers grains with solubles for 6-week-old broiler chickens. Poult. Sci., 91, 712-718, https://doi.org/10.3382/ps.2011-01889

Akayezu J.M., Linn J.G., Harty S.R., and Cassady J.M., 1998. Use of distillers grains and co-products examined. Feed-stuffs., 70, 11-13.

Aliyu B., Agnew B., and Douglas S., 2010. Croton megalocarpus (Musine) seeds as a potential source of bio-diesel. Biomass Bioenerg., 34, 1495-1499, https://doi.org/10.1016/j.biombioe­. 2010.04.026

Amin M.N., Hossain M.A., and Roy K.C., 2004. Effects of moisture content on some physical properties of lentil grains. J. Food Eng., 65, 83-87.

AOAC, 2006. Official Methods of Analysis of AOAC Interna-tional. 18th ed., AOAC Int., Gaithersburg, MD.

Bandegan A., Guenter W., Hoehler D., Crow G.H., and Nya-choti C.M., 2009. Standardized ileal amino acid digestibility in wheat distillers dried grains with solubles for broilers. Poult. Sci., 88, 2592-2599, https://doi.org/10. 3382/ps.2009-00309

Baryeh E.A., 2002. Physical properties of millet. J. Food Eng., 51, 39-46, https://doi.org/10.1016/S0260-8774(01)00035-8

Belyea R.L., Rausch K.D., and Tumbleson M.E., 2004. Compo-sition of corn and distillers dried grains with solubles from dry grind ethanol processing. Bioresour. Technol., 94, 293-298, https://doi.org/10.1016/j.biortech.2004.01.001

Belyea R.L., Rausch K.D., Clevenger T.E., Singh V., Johnston D.B., and Tumbleson M.E., 2010. Sources of variation in composition of DDGS. Anim. Feed Sci. Technol., 159, 122-130, https://doi.org/10.1016/j.anifeedsci.2010.06.005

Bhadra R., Rosentrater K.A., and Muthukumarappan K., 2008. Surface characteristics and flowability of distillers dried grains with solubles. ASABE meeting presentation, https://doi.org/10.13031/2013.25024 · Source: OAI

Bhadra R., Muthukumarappan K., and Rosentrater K.A., 2009. Flowability properties of commercial distillers dried grains with solubles (DDGS). Cereal Chem., 86, 170-180, https://doi.org/10.1094/CCHEM-86-2-0170

Bhadra R., Muthukumarappan K., and Rosentrater K.A., 2012. Effects of CDS and drying temperature levels on the flowability of DDGS. Drying Technol., 20, 542-558, htt-ps://doi.org/10.1080/07373937.2011.649510

Carr R.L., 1965. Evaluating flow properties of solids. Chem. Eng., 72, 163-168.

Crawford N.C., Nagle N., Sievers D.A., and Stickel J.J., 2016. The effects of physical and chemical preprocessing on the flowability of corn stover. Biomass Bioenerg., 85, 126-134, https://doi.org/10.1016/j.biombioe.2015.12.015

De Matteis M.C., Yu T.E., Boyer C.N., and DeLong K.L., 2019. Analyzing determinants of US distillers dried grains with solubles exports. Agribusiness., 35, 168-181, https://doi.org/ 10.1002/agr.21575

Ganesan V., Rosentrater K.A., and Muthukumarappan K., 2005. Effect of moisture content and soluble levels on the physical and chemical properties of DDGS. ASAE Paper No.056110,ASAE,St.Joseph,MI.doi:10.13031/2013.20125

Ganesan V., Rosentrater K.A., and Muthukumarappan K., 2008. Flowability and handling characteristics of bulk sol-ids and powders: A review with implications for DDGS. Biosyst Eng., 101, 425-435, https://doi.org/10.1016/j.bio-systemseng.2008.09.008

Guney A.C., Shim M.Y., Batal A.B., Dale N.M., and Pesti G.M., 2013. Effect of feeding low oil distillers dried grains with solubles on the performance of broilers. Poult. Sci., 92, 2070-2076, https://doi.org/10.3382/ps.2012-02699

Hossain M.A., Khaleque M.A., and Hassan M.S., 1998. Physi-cal characteristics of groundnut kernels at various moisture contents. Legume Res., 21, 79-84.

Joshi D.C., Das S.K., and Mukherjee R.K., 1993. Physical properties of pumpkin seed. J. Agric. Eng. Res., 54, 219-229, https://doi.org/10.1006/jaer.1993.1016

Juliano P. and Barbosa-Canovas G.V., 2010. Food powders flowability characterization: theory, methods, and applica-tions. Annu. Rev. Food Sci. T., 1(1), 211e239, https://doi. org/10.1146/annurev.food.102308.124155.

Keierleber C. and Rosentrater K.A., 2010. Granular packing influences bulk density of DDGS. Cereal Chem., 87, 586-596, https://doi.org/10.1094/CCHEM-04-10-0055

Kingsly A.R.P. and Ileleji K.E., 2009. Sorption isotherm of corn distillers dried grains with solubles and its prediction using chemical composition. Food Chem., 116, 939-946, https:// doi.org/10.1016/j.foodchem.2009.03.050

Kingsly A.R.P., Ileleji K.E., Clementson C.L., Garcia A., Maier D.E., Stroshine R.L., and Radcliff S., 2010. The effect of process variables during drying on the physical and chemical characteristics of corn dried distillers grains with solubles (DDGS)- plant scale experiments. Bioresour. Technol., 101, 193-199, https://doi.org/10.1016/j.biortech. 2009.07.070

Ortín W.G.N. and Peiqiang Y., 2009. Nutrient variation and availability of wheat DDGS, corn DDGS and blend DDGS from bioethanol plants. J. Sci. Food Agr., 89(10), 1754e61, https://doi.org/10.1002/jsfa.3652

Pekel A.Y., Çakir E.O., Polat M., Çakir K., Inan G., and Kocabagli N., 2013. Correlations between chemical assays and near-infrared reflectance spectroscopy for nutrient components and correlations between nutrients and color scores of distillers dried grains with solubles. J. Appl. Poult. Res., 22, 814-824, https://doi.org/10.3382/japr.2013-00728

Pinotti L. and Dell’Orto V., 2011. Feed safety in the feed supply chain. Biotechnol. Agron. Soc. Environ., 15, 9-14.

Rosentrater K.A., 2006. Some physical properties of distillers dried grains with solubles (DDGS). Appl. Eng. Agri., 22, 589-595. http://dx.doi.org/10.13031/2013.21212

Samson R. and Mehdi B., 1998. Strategies to Reduce the Ash Content in Perennial Grasses; Resource Efficient Agricul-tural Production-Canada: Sainte-Anne-de-Bellevue, QC, Canada.

Saragoni P., Aguilera J.M., and Bouchon P., 2007. Changes in particles of coffee powder and extensions to cake. Food Chem., 104, 122-126, https://doi.org/10.1016/j.foodchem. 2006.11.029

SAS Institute, 2006. “SAS/STAT User’s Guide. Release 9.1”, Cary, NC, USA, SAS Inst Inc.

Shurson J., Spiehs M., Whitney M., Baidoo S., Johnston L., Shanks B., and Wulf D., 2001. The value of distillers dried grains with solubles in swine diets. In:Mn. Nutr. Conf. Mn. Corn Growers Assoc. Tech. Sympos., Bloomington, MN.

Spiehs M.J., Whitney M.H., and Shurson G.C., 2002. Nutrient database for distillers’ dried grains with solubles produced from new ethanol plants in Minnesota and South Dakota. J. Anim. Sci., 80, 2639-2645, https://doi.org/10.1093/ansci/ 80.10.2639

Swiatkiewicz S. and Koreleski J., 2008. The use of distillers dried grains with solubles (DDGS) in poultry nutrition. World’s Poult. Sci. J., 64, 257-265, https://doi.org/10.1017/ S0043933908000044

US Grains Council, 2019. Buying and selling. DDGS. Production and Exports. https://grains.org/buying-selling/ddgs/

Van Soest P.J., Robertson J.B., and Lewis B.A., 1991. Methods for dietary fiber, neutral detergent fiber, and nonstarch poly-saccharides in relation to animal nutrition. J. Dairy Sci., 74, 3583-3597, https://doi.org/10.3168/jds.S0022-0302(91)78551-2

Wang H.Y., Bai S.P., Ding X.M., Wang J.P., Zeng Q.F., Su Z.W., Xuan Y., and Zhang K.Y., 2018. Nitrogen-corrected appar-ent metabolizable energy value of corn distillers dried grains with solubles for laying hens. Anim. Feed. Sci. Tech., 238, 66-72, https://doi.org/10.1016/j.anifeedsci.2018.02.002

Zou Y. and Brusewitz G.H., 2002. Flowability of uncompacted marigold powder as affected by moisture content. J. Food Eng., 55, 165-171, https://doi.org/10.1016/S0260-8774(02) 00060-2

Related topics:
Authors:
Ahmet PEKEL
Istanbul Universitesi Merkez Kampusu
Recommend
Comment
Share
Profile picture
Would you like to discuss another topic? Create a new post to engage with experts in the community.
Join Engormix and be part of the largest agribusiness social network in the world.