Introduction
The transition period, 3 weeks before to 3 weeks after parturition, is important for health, reproduction, production and profitability of dairy cows (Bertoni et al., 2008). In this period cows are affected by different stressors including the increase of body lipid mobilization, oxidative stress, major changes in endocrine status, and altered immune function, which together result in an increased risk of diseases (Jonsson et al., 2013).
Inflammation is involved in most of these changes through several mediators, such as eicosanoids (Sordillo et al., 2009) and proinflammatory cytokines (PIC; Kushibiki, 2011). The PIC [e.g. tumor necrosis factor alpha (TNF-á), interleukin-1beta (IL-1â), interleukin-6 (IL-6), and interferon-gamma (INF-ã)] are released mainly by macrophages (Koj, 1998), but they are also produced in other tissues (e.g. liver, brain, adipose tissue), and exert both paracrine and systemic effects. In the liver, PIC stimulate the synthesis of positive acute phase proteins (pos-APP), such as haptoglobin, serum amyloid A and ceruloplasmin (Gruys et al., 2005). Concomitantly, PIC impair the synthesis of negative acute phase proteins (neg-APP), some of them being important for normal liver metabolism (Bertoni and Trevisi; 2013). Indeed, the low neg-APP concentrations (e.g. albumin, lipoproteins, retinol binding protein) have been associated with decreased liver function, reproductive performance, milk yield and increased disease incidences (Bionaz et al., 2007; Bertoni et al., 2008; Bossaert et al., 2012). Moreover, PIC have a role in worsening feed intake, possibly even anorexia (Johnson, 1997), a condition often occurring around parturition (Grummer, 1995; Drackley, 1999; Trevisi et al., 2012). In accordance to these results, the role of PIC have been investigated as potential indicators of postpartum reproductive diseases (Ishikawa et al., 2004; Islam et al., 2013b). Recently, the plasma concentration of IL-6 in the early lactating cows has shown a positive correlation with the severity of the inflammatory response (Trevisi et al., 2012). Interestingly, this study also showed a great variability of the plasma concentration of IL6 at calving time, suggesting the importance of the absolute level of the PIC in the transition period. Thus, we hypothesize that the concentration of PIC before or around calving can be related with the success or the failure (i.e. high occurrence of metabolic and infectious diseases, unsatisfactory performance, poor fertility, early culling) of the transition period.
In previous studies, the variations of PIC was not systematically and frequently investigated during the transition period, together a wide metabolic and inflammatory profile. Therefore, the main objective of this study was to establish the pattern of changes of IL-1â and IL-6 in the peripartum of dairy cows along with several biomarkers of the metabolism and inflammation.
Materials and methods
This study complied with Italian laws on animal experimentation and ethics. The experiment was carried out in the dairy farm of Università Cattolica del Sacro Cuore (Piacenza, Italy) from 2010 to 2012.
Animals and feeds
Twenty-one multiparous Holstein dairy cows (parity 2.5±1.0) in transition period [from -35 d to +28 d from parturition (DFP)] were included in this study. Cows were housed in the barn of the university, equipped with air conditioning (summer), heating (winter), artificial lighting and ventilation systems to guarantee relatively stable conditions in the whole year. On average the climatic conditions were: environmental temperature around 20°C, relative humidity between 60% to 70%, photoperiod with 14 h of light (from 5:00 to 19:00 h) and 10 h of dark. Cows were individually fed and, every morning, the remnants were weighed and recorded. Forages were offered ad libitum every 12 h, whereas concentrates were distributed by an auto-feeder every 3 h and 12 h for lactating and dry cows, respectively.
On average, dry cows received 9-12 kg of grass hay, 8-10 kg of corn silage and 1 kg of concentrate per day (soybean meal and mineral- vitamin supplementation). After calving, the daily diet included 2 kg of grass hay and 3 kg of alfalfa hay, while amount of concentrate and corn silage were gradually increased (on d 30 of lactation, on average cows received 11–13 kg of concentrates and 18-20 kg of maizesilage). The average composition of diets consumed in the last month of pregnancy and in the first month of lactation is shown in Table 1.
Table 1. Ingredients and main chemical and nutritional traits of the diets fed to dry (last month of pregnancy) and lactating (first month of pregnancy) dairy cows.
DM, dry matter; NEL, net energy lactation; CP, crude protein; NDF, neutral detergent fibre; EE, ether extract. °Mineral and vitamin supplement provided at each cow every day: vitamin A, 150,000 U; vitamin D, 20,000 U; vitamin K, 100 mg; vitamin E, 750 U; vitamin B12, 0.5 mg; 500 mg; vitamin PP, 2 mg Co; I, 20 mg; Mn, 350 mg; Cu, 80 mg; Se, 3 mg; Zn, 800 mg; yeast, 15 g (Yea-Sacc102.6; Alltech Italia S.r l., Bologna, Italy).
Sample collection
Blood samples were collected from each cow on days -35±2,-28±2, -21±2, -14±2, -7, -2, -1, 0, 1, 2, 3, 7, 14±2, 21±2, and 28±2 from the date of parturition. On d 0, the samples were collected within 3 hours before the calving. Other blood samples were collected in the morning before feeding. Samples were obtained from the jugular vein using evacuated tubes containing Li-heparin as an anticoagulant (Vacuette, Kremsmünster, Austria). Tubes were immediately placed in ice water until arrival in the laboratory. Within one hour of collection, a small amount of the blood was used for packed cell volume determination (Centrifugette 4203; ALC International Srl, Cologno Monzese, Italy). The remainder of the sample was centrifuged at 3500×g for 15 min at 4°C and the plasma was frozen in several aliquots at -20°C until analyzed.
Milk yield, dry matter intake, body condition score and health problems
All cows were treated at drying-off with a dry-cow intramammary preparation (penethamate hydroiodide, bentamin penicillin, framycetin sulphate; Mamyzin®, Boehringer Ingelheim, Reggello, Italy) and intramuscular treatments with tylosin (Eli Lilly, Sesto Fiorentino, Italy). During the trial rectal temperature was measured every morning at feeding time (08:00). All cows were routinely vaccinated against bovine viral diarrhea, infectious bovine rhinotracheitis, parainfluenza type 3 and bovine respiratory syncytial viruses by a live attenuated vaccine (CattleMaster 4; Pfizer Animal Health, Exton, PA, USA) every 6 months, except in the 4 weeks before and after calving.
Individual milk yield was weighted at each milking. Milking procedures included cleaning of the teat with a clorexidine-moistened paper towel, forestripping and milking cluster attachment. The SCC (Fossomatic 180, Foss Electric, Hillerød, Denmark), fat, protein and lactose (MilkoScan FT 120, Foss Electric, Hillerød, Denmark) of milk were measured routinely once a week. The feed intake was measured daily by weighing differences of the supplied feed and the orts. The feed DM content was routinely assessed during the trial by the sampling of hay and concentrate when lots were changed and corn silage every 4 weeks from the bunker silo. The body condition score (BCS) was individually evaluated by the same observer according to a five-point scale (Agriculture Development and Advisory Service, 1986), at the first blood sampling (about 35 d before the expected calving date) and then every 14 d until d 28 after calving.
Blood analysis
Blood samples were analyzed to assess the following metabolites: i) inflammatory response indices: pos-APP (haptoglobin, ceruloplasmin) and neg-APP (albumin, cholesterol as lipoprotein index); ii) liver indices: total bilirubin, aspartate aminotransferase (GOT), ã-glutamyl transferase (GGT), alkaline phosphatase (ALP), paraoxonase (PON); iii) energy metabolism indices: glucose, NEFA (non-esterified fatty acid), â-hydroxybutyrate (BHBA); iv) protein metabolism indices: urea, creatinine; v) oxidative stress response index: total reactive oxygen metabolites (ROMs); vi) minerals (Ca, P, Mg, Na, K, Cl, Zn); vii) vitamins: retinol (index of its carrier protein), tocopherol, â-carotene; viii) other parameters (total proteins, globulins). Methods used for the determination of these parameters were previously described by Bertoni et al. (2008). Briefly, glucose, total protein, albumin, total cholesterol, total bilirubin, creatinine, urea, Ca, P, Mg, GOT, GGT and ALP were determined at 37°C by a clinical auto-analyzer (ILAB 600, Instrumentation Laboratory, Lexington, MA, USA) using commercial kits purchased from Instrumentation Laboratory (IL Test). Globulins were calculated as the difference between total protein and albumin. Electrolytes (Na+, K+, and Cl−) were detected by the potentiometer method (Ion Selective Electrode connected to ILAB 600). Zn and NEFA were determined by commercial kits (Wako Chemicals GmbH, Neuss, Germany). ROMs were measured using a method patented by Diacron International S.r.l. (Grosseto, Italy). BHBA was determined by commercial kit (Randox Laboratories Ltd., Crumlin, UK).
Haptoglobin and ceruloplasmin concentrations were measured using methods proposed by Bertoni et al. (2008) adapted to ILAB 600 conditions. Plasma PON activity was assessed by adapting the method of Ferré et al. (2002) to the ILAB 600. Plasma retinol, á-tocopherol and â- carotene were extracted with hexane and analyzed by reverse-phase HPLC using Spherisorb ODS-2.3 ìm, in a 150×4.6 mm column (Alltech, Deerfield, IL, USA); a UV detector set at 325 nm (for retinol) or 290 nm (for á-tocopherol); 460 nm (for â-carotene) and 80:20 methanol:tetrahydrofurane as the mobile phase.
Cytokine assay
The concentrations of IL-1â and IL-6 were analyzed using commercially available ELISA kits specific for the bovine species (Pierce, Thermo Scientific, Rockford, IL, USA) according to the manufacturer’s instruction. All the samples were analyzed in duplicate. The intra- and inter-assay coefficients of variation were 4 and 17% and 3 and 13% for IL-1â and IL-6, respectively.
Data handling and groups
To investigate the association of plasma concentration of cytokines and other blood parameters and productive performances, the 21 cows were retrospectively divided into 3 groups, each consisting of 7 cows, according to the value of area under the concentration curve (AUC) of IL- 1â concentrations during dry period (from -35 to 0 DFP), and were designated as high IL-1â (UPIL1), intermediate IL-1â (INIL1) and low IL- 1â (LOIL1) groups. We have chosen IL-1â for grouping as it is one of the most important PIC. Data of plasma parameters during calving were also divided into 4 periods, i.e. from -35 to -14 (DRY1), from -7 to -1 (DRY2), from +1 to +7 (LACT1) and from +14 to +28 DFP (LACT2). Data of plasma measured over time within the period of interest were aggregated according to these periods.
Statistical analyses
Statistical analyses were performed with SAS software (SAS Inst. Inc., Cary, NC, USA; release 8.0). These data were subjected to ANOVA using the REPEATED statement in the MIXED procedure of SAS. The statistical model for plasma parameters included the fixed effect of groups (UPIL1, INIL1, LOIL1), DFP (-35, -28, -21, -14, -7, -2, -1, 0, 1, 2, 3, 7, 14, 21 and 28) or periods (DRY1, DRY2, LACT1 and LACT2) and groups by DFP or period interaction. The statistical model for DMI, BCS, milk yield and milk parameters included the fixed effect of groups (UPIL1, INIL1, LOIL1), and DFP with group by DFP interaction. For all the parameters the random variable was cow within the groups. Each parameter was tested for normal distribution using UNIVARIATE procedure of SAS and normalized when necessary, using either natural logarithmic (IL- 1â, IL-6, glucose, cholesterol, urea, magnesium, GOT, GGT, bilirubin, haptoglobin, tocopherol, somatic cell count) or cubic (calcium) conversion. Each parameter was subjected to 4 covariance structures: first order autoregressive, compound symmetry, spatial power, toeplitz, and the best covariance structure was retained (Littell et al., 1998). Partial correlations were computed among plasma parameters using the GLM procedure of SAS with the MANOVA statement.
Prevalence of health problems recorded during the study was evaluated by 2 analysis (PROC FREQ of SAS) to determine whether prevalence differed among groups.
Statistical significance was declared at P≤0.05, with trends noted at P<0.10.
Results
Pro-inflammatory cytokines
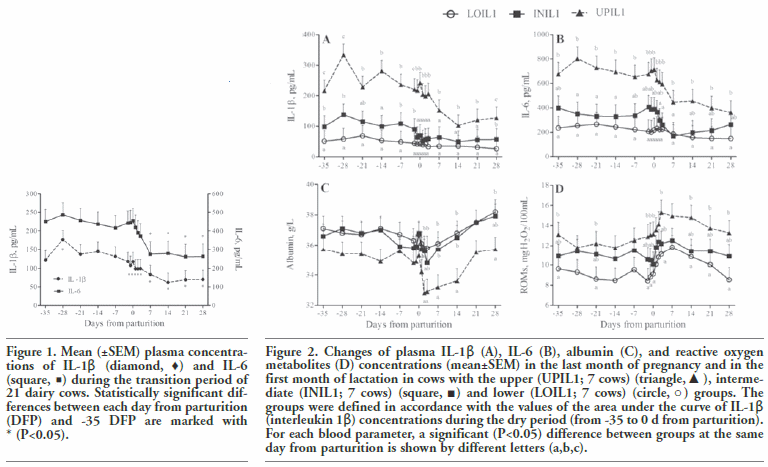
The patterns of changes of the concentration of IL-1â and IL-6 from -35 DFP to 28 DFP are shown in Figure 1. The plasma concentrations of both cytokines remained almost stable in the last month of pregnancy, but showed a great variability among the cows. Concentrations of both the cytokines were higher before calving, showed increase variability at calving time and then decreased gradually after parturition. To better describe the pattern of changes of cytokines, the values observed in the transition period were compared with the value detected at -35 DFP (beginning level). The concentration of IL-1â decreased significantly after calving for the entire 1st month of lactation. The IL-6 showed a similar pattern of change of IL-1â, but the significant reduction (P<0.01) was observed from the 7 DFP in comparison to the value observed at -35 DFP.
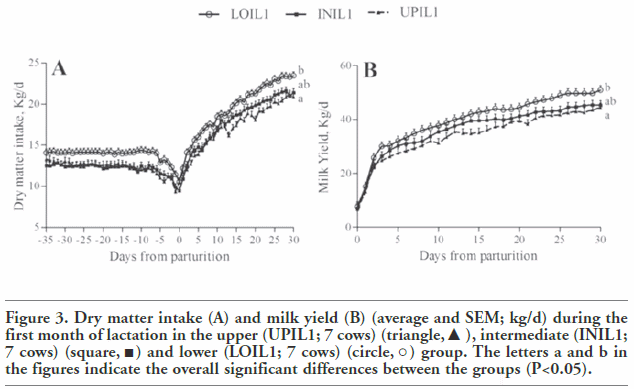
Grouping the animals, the average concentrations of IL-1â during the last month of pregnancy were 51.1, 98.2 and 246.9; SEM 35.09 pg/mL for LOIL1, INIL1 and UPIL1, respectively (P<0.01; Figure 2A). During the first month after calving a significant difference (P<0.01) was observed only between UPIL1 and LOIL1 groups. Concentrations of IL-1â were significantly correlated with those of IL-6 (r=0.46, P<0.01), but no significant correlations were found with other blood parameters. Statistical differences among the 3 groups were also found for IL-6 concentration (Figure 2B). The cows of UPIL1 group showed higher concentration of IL-6 (P<0.05) compared to LOIL1 group during the whole study period and to INIL1 for -28, -21, -14 DFP (P<0.05).
Inflammometabolic profiles
The changes of some plasma metabolic and immune parameters during the study period are shown in Figures 2C and 2D and Table 2. Albumin concentrations (Figure 2C) remained quite stable in the dry period and showed a reduction after calving. The more marked decrease was observed in UPIL1 group compared to INIL1and LOIL1 groups. Differences between UPIL1 and other groups were significant (P<0.05) for the entire first month of lactation. The ROMs concentrations (Figure 2D) rose after calving in all groups (P<0.05). The difference of ROMs between LOIL1 and UPIL1 groups were significant (P<0.05) for almost the whole period (i.e. -35, -21, -2, -1, 0, 1, 3, 14, 21, 28 DFP). The calcium concentration (Table 2) of UPIL1 group was lower compared to other groups in the whole period (P<0.05). Moreover, the calcium concentration of UPIL1 group was lower (P<0.05) compared to INIL1 group at DRY1 (from -35 to -14 DFP), and to LOIL1 group at LACT1 (from +1 to +7 DFP). Zn also showed a significant difference (P<0.05) between INIL1 and LOIL1 groups at LACT1. Globulin concentrations showed a significant effect on the period (P<0.01) and the interaction between IL1â group and period (P<0.01). The UPIL1 group showed a marked increase after calving and reached the highest concentration at LACT2 (P<0.05 vs INIL1 and NS vs UPIL1).
The pos-APP (haptoglobin and ceruloplasmin) did not differ among the three groups before calving, and increased after calving in all cows (LACT1 vs DRY2; P<0.05). Haptoglobin concentration was higher (P<0.05) in INIL1 and UPIL1 groups than in LOIL1 group in LACT1 (Table 2), while ceruloplasmin resulted only numerically higher in UPIL1 group compared with LOIL1 in LACT1 (3.65 vs 3.30 μmol/L). Concomitantly, plasma concentrations of creatinine were numerically lower in UPIL1 group cows in comparison to the INIL1 and LOIL1 groups during the entire peripartum, but statistical difference between UPIL1 and LOIL1 was observed only during the first week of lactation (P<0.05). The NEFA (Table 2) and BHBA (data not shown) concentrations rose gradually from DRY1 to LACT1 (P<0.01) in all cows, but differences among groups were not significant.
Table 2. Mean values of plasma concentrations of calcium, zinc, globulin, haptoglobin and creatinine in different groups of transition cows (35 d before to 28 d after calving).
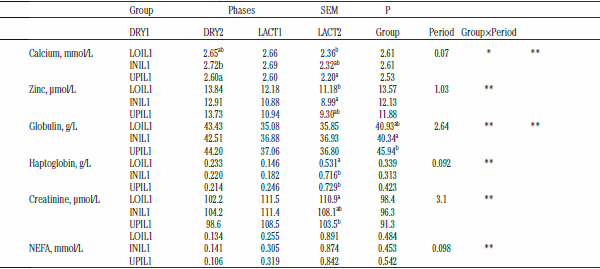
DRY1, from 35 to 14 d from parturition; DRY2, from 7 to 1 d from parturition; LACT1, from 1 to 7 d from parturition; LACT2, from 14 to 28 d from parturition; LOIL1, low IL-1β group; IL-1β, interleukin 1β; INIL1, intermediate IL-1 β group; UPIL1, upper IL-1β group; NEFA, non-esterified fatty acids. Groups are formed according to values of area under the curve of IL-1β concentrations during dry period (from -35 to 0 d from parturition). a,bMeans with different superscript within the same column differ significantly at P<0.05. *P<0.05; **P<0.01.
Health problems and body condition Score
Major disease frequency in the first month of lactation for each group and criteria for the diagnosis of the diseases are reported in Table 3. No clinical diseases were detected until parturition. In lactation, LOIL1 group showed a lower number of cows with clinical diseases (28%) in comparison to INIL1 (57%) and UPIL1 (71%). Of the 7 cows in each group used in the study, 4 cows of UPIL1 group and 2 cows of INIL1 group were diagnosed with clinical mastitis in the first month of lactation, while LOIL1 group cows did not show any mastitis (P<0.10 compared UPIL1 vs LOIL1). Cows with clinical mastitis were treated timely with intramammary preparation (rifaximine and cefacetrile). The SCC were controlled routinely once a week and as a whole tended to be higher (P<0.1) in UPIL1 groups (242.59±84.86 n/ìL) in comparison with LOIL1 (104.04±84.86 n/ìL) and INIL1 (182.54±84.25 n/ìL) groups. The average rectal temperature measured at the morning did not differ among groups. All groups showed a tendency to have a similar pattern of BCS changes from 35 d before calving to 28 d in milk, with numerically higher body losses in UPIL1 (-0.45 points) and INIL1 (-0.45 points) in comparison to LOIL1(- 0.33 points).
Table 3. Prevalence of clinical events in the lower, intermediate and upper group cows during the first month of lactation.

LOIL1, low IL-1β group; IL-1β, interleukin 1β; INIL1, intermediate IL-1β group; UPIL1, upper IL-1β group. Groups are formed according to values of area under the curve of IL-1β concentrations during dry period (from -35 to 0 d in milk). °Diagnosed when foetal membranes were retained after 12 h from parturition; #diagnosed trough typical clinical symptoms (udder with oedema and hardness, clots in milk, fever, above 1000 Somatic Cells Number per μL); §rectal temperature higher of 39.5°C; ^abomasal dislocation, Partial retained placenta (diagnosed when only part of foetal membranes were retained after 12 h from parturition). a,bMeans with different superscript within the same column differ significantly at P<0.10.
Dry matter intake and milk yield
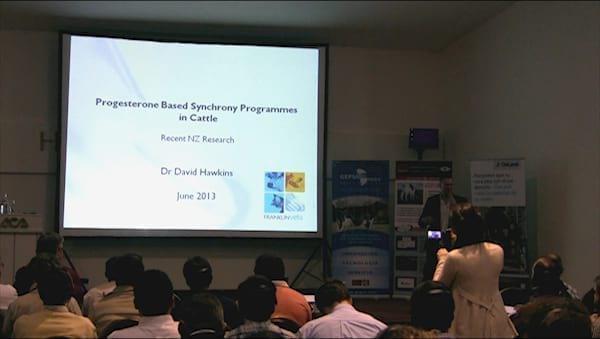
In the dry period, the average DMI (Figure 3a) was 13.9, 12.2 and 12.3 kg/d (SEM=0.4680) in LOIL1, INIL1 and UPIL1 groups, respectively while during lactation period DMI was 19.6, 18.1 and 17.4 kg/d (SEM=0.4680) in LOIL1, INIL1 and UPIL1 groups, respectively. The DMI of UPIL1 group was lower (P<0.01) during the postpartum period in comparison with the other two groups. Milk yield (Figure 3b) was higher in LOIL1 than INIL1 (P<0.05) and UPIL1 (P<0.01) groups. The average milk yield in the first 30 d of lactation was 39.7, 36.1 and 34.0 kg/d (SEM=1.71) in LOIL1, INIL1 and UPIL1 groups, respectively. Milk content of protein, fat and lactose did not show any differences among the groups.
Discussion
Immune alterations and inflammatory conditions are signalled in the peripartum period, and often without clinical symptoms. The understanding of this phenomenon is very relevant to improve the health and welfare of dairy cows. The changes of PIC concentrations, as IL-1b and IL-6, during the transition period are not well known and until now it was erroneously assumed that their changes in plasma were very quick and difficult to detect. In this research, we observed that concentrations of IL-1b and IL-6 remained almost stable in late pregnancy, but surprisingly, animals showed a wide variability. Therefore, cows were retrospectively divided in tertiles, on the basis of the concentrations of IL-1b in the last month of pregnancy, to study their relationship with the occurrence of periparturient health problems, dry matter intake, milk yield and plasma inflammometabolic parameters.
Effect of transition period on plasma concentration of pro-inflammatory cytokines
The concentration of PIC showed a short-lasting increase in the sample collected after the calving (within 24 hours following). This increase was not statistically different in comparison to previous weeks, but it is in agreement with the results of Hebisch et al. (2004) who measured IL-1b and IL-6 in women during pregnancy, delivery and early puerperium. Moreover, our data also partially agree with Jonsson et al. (2013), who observed an increase of the IL-1â expression in the leukocytes collected from heifers within 24 h after calving. Our data suggest that a proper evaluation of the calving effects on PIC production in dairy cows require more frequent samplings around parturition.
In this study, we observed a reduction of PIC concentration after parturition in UPIL1 and INIL1, but barely in LOIL1. The reduction of IL- 6 agrees with the study of Ishikawa et al. (2004) and Trevisi et al. (2012) in clinically healthy dairy cows, while the reduction of IL- 1b has also been reported by Islam et al. (2013a). Similar results were also observed in murine model by Orsi et al. (2006), who found a raise of PIC (e.g. TNF-á, IL-1â and IL-6) in serum during mid and late gestation. The T helper cells (Th) play an important role in the immunoregulation and immunostimulation and can be classified in Th1, Th2 and Th17 cells, which produce different pattern of cytokines, also called lymphokines (Saito et al., 2010). Th1 and Th2 produce cytokines with opposite effects, pro-inflammatory and anti-inflammatory respectively, but their production is suppressed by immunoregulatory cytokines, such as transforming growth factor (TGF)-â and IL10 or by cell-to-cell interaction (Saito et al., 2010). In our research, the higher concentration of PIC in late pregnancy relative to those measured after parturition partly disagrees with the opinion with respect to a low ratio of Th1 to Th2 cells for the maintenance of pregnancy. Thus, Raghupathy et al. (2000) suggested that a lower ratio of Th1 and Th2 during pregnancy is useful for a successful peripartum because it optimizes the fetomaternal immune interaction and vascularisation (Reinhard et al., 1998). In this condition, PIC concentrations in plasma before parturition should be low, because they are mainly released by Th1 cells. At parturition, the decrease of the Th2/Th1 ratio should occur rapidly in the uterus, switching from a condition that provide tolerance for the foetus (Th2) to a condition that offers protection against infecting agents. Orsi et al. (2006) indicated that the Th1-Th2 dichotomy poorly describes the complex immunological process like pregnancy in mice. In fact, they observed very high concentrations of TNF-á during pregnancy, which means unbalance of Th1 and Th2 ratio. Despites, the high concentrations of PIC in late pregnancy has been suggested as risky, Orsi et al. (2006) did not observe complications in pregnancy. Similar results were also reported in dairy cows by Ishikawa et al. (2004), Trevisi et al. (2012) and Jahan et al. (2015). The results of our present study and of Ishikawa et al. (2004) displayed relatively high and stable values of plasma PIC in late pregnancy in a relevant number of dairy cows. This was seen, although it is documented that cows show an immunosuppression condition that start about three weeks before calving (Mallard et al., 1998). This does not mean, as stated by Ishikawa et al. (2004), that immune function during pregnancy is inactive. However, they did not consider that PIC can also be released by several other cells besides leukocytes (Kruse et al., 2000) and that the contribution of leukocytes become remarkable only when the immune system is active and challenged by pathogens and/or antigens. After calving the PIC concentrations were remarkably reduced. The reasons of this decline were not clear, but some authors attributed the reduction of PIC due to the strong increase of 17â-estradiol (Rogers and Eastell, 2001) and cortisol (Oppert et al., 2005), both markedly increase at calving time (Goff and Horst, 1997). Moreover, Vitoratos et al. (2008) suggested a role of placenta in the synthesis of some cytokines (e.g. IL-1â, adiponectin) and explained the reduced concentration of PIC in plasma after parturition due to the removal of placenta. Nevertheless, our results suggest some contradictions during early lactation. In fact when the PIC concentration was lower the pos-APP increased (e.g. haptoglobin), suggesting an acute phase response. From our data, the short-lived peaks of IL-1â and IL-6 observed around calving seem not to be related to the raise of pos-APP few days after it. More likely, the raise of pos-APP concentration after calving could be influenced by a different susceptibility of cows to inflammation, which could be associated to the ratio among cytokines (and thus Th1 and Th2) and the concentration of PIC in plasma (Orsi et al., 2006; Ishikawa et al., 2004).
Relationship between pro-inflammatory cytokines and acute phase reactants in transition period
The association between PIC and acute phase response has been investigated for a long time (Elsasser et al., 1997; Gruys et al., 2005). Nevertheless, few experiments investigated this association in the periparturient period, characterized by several and pronounced phenomena, such as negative energy balance, oxidative stress, immunosuppression as well as inflammatory like condition (Sordillo and Aitken, 2009; Trevisi et al., 2012; van Knegsel et al., 2014).
In our experiment, metabolic and inflammatory reactants, showed the classic pattern of changes of the transition dairy cows, with an increase of NEFA and pos-APP after calving and a slight reduction of neg-APP around calving (Bionaz et al., 2007; Bertoni et al., 2008; Trevisi et al., 2012). In this context, the concentrations of PIC showed a marked reduction after calving in all the cows. Interestingly, the concentrations of PIC in late pregnancy seem related to the severity of inflammation observed in early lactation. Indeed, when cows were classified by the AUC of IL-1â during the dry period, the concentration of haptoglobin after parturition (marker of the severity of inflammation (Bionaz et al., 2007; Bertoni et al., 2008) was higher in the groups of higher and medium concentration of IL-1â in late pregnancy compared with the group of lower IL-1â content.
Moreover, grouping cows based on PIC showed some differences in parameters affected by inflammation (e.g. decrease of albumin, increase of ROMs) in late pregnancy, but based on this ranking of cows, differences between inflammatory and metabolic parameters were mainly observed after calving. The marked reduction of albumin concentrations was previously observed either before (Abdul- Aziz, 2008; Trevisi et al., 2010) or after (Bionaz et al., 2007; Bertoni et al., 2008; Abdul-Aziz, 2008) calving in cows with severe inflammation. The synthesis of liver proteins change after a few hours after the initiation of an infection, resulting in an increase of the pos- APP concentration while at the same time the neg-APP concentrations start to decrease (Gruys et al., 2005). The decrease of neg-APP concentration is in part the consequence of the modified vascular permeability, which changes the protein distribution between plasma and other fluids (Fleck, 1989), and, perhaps, in part the consequence of the increases of the renal clearance. These phenomena explain the marked reduction of albumin concentration immediately after parturition, especially in UPIL1. The delayed reduction of plasma albumin is mainly explained by the reduction of their liver synthesis (Powanda, 1980), probably competed by the higher synthesis of pos-APP.
The inflammatory condition also affects some mineral concentrations in blood (Beisel, 1977). The UPIL1 and INIL1 groups showed a greater decrease of zinc concentration after calving, although the statistical difference has been observed only between INIL1 and LOIL1. The zinc is considered as a positive acute phase reactants, in fact, its reduction in plasma is an index of higher liver synthesis of metallothionein in case of inflammation (Rink and Kirchner, 2000). The UPIL1 cows also displayed a lower concentration of calcium (table 2), particularly after calving. These data partly agree with Kimura et al. (2006) and Bertoni et al. (2008) who measured lower concentration of blood calcium in cows in more severe inflammatory like condition after calving. A further evidence of stronger inflammations and oxidative stress in UPIL1 group compared to LOIL1 and INIL1 groups was represented by the higher concentrations of ROMs. The differences of ROMs among groups showed up in the dry period and remained during the calving period (all groups showed the same degree of increase) and persisted for the entire first month of lactation. ROMs can contribute to increased susceptibility of dairy cows to a variety of diseases (Trevisi and Bertoni, 2010; Celi, 2011). Moreover, the increased concentrations of ROMs can reiterate the inflammatory state of animals (Rimbach et al., 2002; Trevisi et al., 2010). Considering the high individual variability of ROMs, largely independent of the distance from calving, it is possible that genetic factors explain the differences among groups with different concentrations of PIC, in agreement with Sordillo and Aitken (2009).
Relationship among pro-inflammatory cytokines, health status and productive performance
In our study, the grouping of cows based on IL-1b concentrations in the last month of dry period seemed related to the frequency of some diseases (mainly mastitis) that occurred in the subsequent early lactation. Several studies were focused to identify inflammatory and oxidative stress markers able to predict clinical events in periparturient dairy cows (Ishikawa et al., 2004; Zebeli et al., 2011; Islam et al., 2013a, 2013b), but the results often do not agree. Our results on post-partum clinical problems are partly in agreement with Ishikawa et al. (2004), who showed the high concentrations of IL-6 in pre-partum were able to predict post-partum reproductive disorders. In contrast, Islam et al. (2013a) recently suggested that low concentrations of IL-1b at 15 d prior or at calving may be used to identify the cows susceptible to develop post-partum reproductive diseases. In another experiment, Islam et al. (2013b) claimed that increased concentration of the IL-10 (an anti-inflammatory cytokine) at 15 d pre-partum can be a good predictor of retained placenta and metritis. Unfortunately, the data of Islam et al. (2013a, 2013b) are difficult to compare with our results because in these studies no inflammatory or metabolic markers in plasma were investigated.
More consistent appear researches, which have investigated concentrations of PIC and the feed intake. PIC have a profound behavioural, neuroendocrine, and metabolic effect and act in the brain to reduce food intake in laboratory animal species (Plata-Salamán, 2000; Johnson, 1997). In chicks, a series of experiments demonstrated that a variety of inflammatory agents reduced feed intake and efficiency of gain, increased body temperature and plasma corticosterone (Klasing et al., 1987). In cows with induced ketosis (Loor et al., 2007) the increased expression of IL-6 may have been causally involved in the reduced DMI and milk production. In overall these data agree with our research, in fact cows with the higher concentration of pro-inflammatory cytokines before calving showed a lower DMI for the whole period, a higher frequency of mastitis and a lower milk yield. Surprisingly, the marked differences in DMI in the present study were not associated with increased lipid mobilization. In our experiment, the NEFA and BHBA concentrations were only numerically higher in UPIL1 in comparison to other groups, likely because of the simultaneous marked reduction of milk synthesis. Thus, our study suggests a role of plasma PIC concentrations before calving in the regulation of the DMI during the peripartum.
Conclusions
The present study demonstrates that in dairy cows the concentrations of PIC (e.g. IL-1b and IL-6) are almost stable during the last month of pregnancy, but shows a high variability among the cows. Although PIC concentrations were significantly higher in the dry period, only few relationships between these cytokines and other plasma parameters (e.g. lower concentrations of albumin and higher concentrations of ROMs) were found in late pregnancy. Importantly, none of the cows showed clinical diseases. Nevertheless, cows with the highest concentration of PIC in late pregnancy exhibited the worst condition in term of metabolic and inflammatory indices, incidences of mastitis, feed intake and milk production in early lactation, suggesting that PICs are good candidates to discover animals with an unsuccessful transition period. Future efforts should be addressed to clarify the causes of the high variability of PIC concentration among cows leading to inflammatory phenomena in the forthcoming lactation, as well as the reasons for the higher PIC concentrations in pregnancy without evidence of acute phase reaction status.
References
Abdul-Aziz, M.A.M., 2008. Studies on some serum constituents of dairy cows in Saudi Arabia. Sci. J. King Faisal Univ. 9:105-113.
Agriculture Development and Advisory Service, 1986. Condition scoring of dairy cows. Ministry of Agriculture, Fisheries and Food ed., Lion House, Alnwick, UK.
Beisel, W.R., 1977. Zinc metabolism in infection. Prog. Clin. Biol. Res. 14:155-179.
Bertoni, G., Trevisi, E., 2013. Use of the liver activity index and other metabolic variables in the assessment of metabolic health in dairy herds. Vet. Clin. N. Am. 29:413-431.
Bertoni, G., Trevisi, E., Han, X., Bionaz, M., 2008. Effects of inflammatory conditions on liver activity in puerperium period and consequences for performance in dairy cows. J. Dairy Sci. 91:3300-3310.
Bionaz, M., Trevisi, E., Calamari, L., Librandi, F., Ferrari, A., Bertoni, G., 2007. Plasma paraoxonase, health, inflammatory conditions, and liver function in transition dairy cows. J. Dairy Sci. 90:1740-1750.
Bossaert, P., Trevisi, E., Opsomer, G., Bertoni, G., De Vliegher, S., Leroy, J.L.M.R., 2012. The association between indicators of inflammation and liver variables during the transition period in high-yielding dairy cows: an observational study. Vet. J. 192:222-225.
Celi, P., 2011. Biomarkers of oxidative stress in ruminant medicine. Immunopharm. Immunot. 33:233-240.
Drackley, J.K., 1999. ADSA Foundation Scholar Award. Biology of dairy cows during the transition period: the final frontier? J. Dairy Sci. 82:2259-2273.
Elsasser, T.H., Kahl, S., Steele, N.C., Rumsey, T.S., 1997. Nutritional modulation of somatotropic axis-cytokine relationships in cattle: a brief review. Comp. Biochem. Phys. A 116:209-221.
Ferré, N., Camps, J., Prats, E., Vilella, E., Paul, A., Figuera, L., Joven, J., 2002. Serum paraoxonase activity: a new additional test for the improved evaluation of chronic liver damage. Clin. Chem. 48:261-268.
Fleck, A., 1989. Clinical and nutritional aspects of changes in acute-phase proteins during inflammation. Proc. Nutr. Soc. 48:347-354.
Goff, J.P., Horst, R.L., 1997. Physiological changes at parturition and their relationship to metabolic disorders. J. Dairy Sci. 80:1260-1268.
Grummer, R.R., 1995. Impact of changes in organic nutrient metabolism on feeding the transition dairy cow. J. Anim. Sci. 73:2820-2833.
Gruys, E., Toussaint, M.J.M., Niewold, T.A., Koopmans, S.J., 2005. Acute phase reaction and acute phase proteins. J. Zhejiang Univ. Sci. B. 6:1045-1056.
Hebisch, G., Neumaier-Wagner, P.M., Huch, R., von Mandach, U., 2004. Maternal serum interleukin-1 beta, -6 and -8 levels and potential determinants in pregnancy and peripartum. J. Perinat. Med. 32:475-480.
Ishikawa, Y., Nakada, K., Hagiwara, K., Kirisawa, R., Iwai, H., Moriyoshi, M., Sawamukai, Y., 2004. Changes in interleukin- 6 concentration in peripheral blood of pre- and post-partum dairy cattle and its relationship to postpartum reproductive diseases. J. Vet. Med. Sci. 66:1403-1408.
Islam, R., Kumar, H., Nandi, S., Mehrotra, S., 2013a. Circulatory level of interleukin-1 in periparturient cows with or without postpartum reproductive diseases. Asian Pacific J. Reprod. 2:316-320.
Islam, R., Kumar, H., Nandi, S., Rai, R.B., 2013b. Determination of anti-inflammatory cytokine in periparturient cows for prediction of postpartum reproductive diseases. Theriogenology 79:974-979.
Jahan, N., Minuti, A., Trevisi, E., 2015. Assessment of immune response in periparturient dairy cows using ex vivo whole blood stimulation assay with lipopolysaccharides and carrageenan skin test. Vet. Immunol. Immunop. 165:119-126.
Johnson, R.W., 1997. Inhibition of growth by pro-inflammatory cytokines: an integrated view. J. Anim. Sci. 75:1244-1255.
Jonsson, N.N., Fortes, M.R.S., Piper, E.K., Vankan, D.M., De Cisneros, J.P.J., Wittek, T., 2013. Comparison of metabolic, hematological, and peripheral blood leukocyte cytokine profiles of dairy cows and heifers during the periparturient period. J. Dairy Sci. 96:2283-2292.
Kimura, K., Reinhardt, T.A., Goff, J.P., 2006. Parturition and hypocalcemia blunts calcium signals in immune cells of dairy cattle. J. Dairy Sci. 89:2588-2595.
Klasing, K.C., Laurin, D.E., Peng, R.K., Fry, D.M., 1987. Immunologically mediated growth depression in chicks: influence of feed intake, corticosterone and interleukin- 1. J. Nutr. 117:1629-1637.
Koj, A., 1998. Termination of acute-phase response: role of some cytokines and antiinflammatory drugs. Gen. Pharmacol. 31:9- 18.
Kruse, N., Greif, M., Moriabadi, N.F., Marx, L., Toyka, K.V., Rieckmann, P., 2000. Variations in cytokine mRNA expression during normal human pregnancy. Clin. Exp. Immunol. 119:317-322.
Kushibiki, S., 2011. Tumor necrosis factor-á- induced inflammatory responses in cattle. Anim. Sci. J. 82:504-511.
Littell, R.C., Henry, P.R., Ammerman, C.B., 1998. Statistical analysis of repeated measures data using SAS procedures. J. Anim. Sci. 76:1216-1231.
Loor, J.J., Everts, R.E., Bionaz, M., Dann, H.M., Morin, D.E., Oliveira, R., Rodriguez-Zas, S.L., Drackley, J.K., Lewin, H.A., 2007. Nutrition-induced ketosis alters metabolic and signaling gene networks in liver of periparturient dairy cows. Physiol. Genomics 32:105-116.
Mallard, B.A., Dekkers, J.C., Ireland, M.J., Leslie, K.E., Sharif, S., Vankampen, C.L., Wagter, L., Wilkie, B.N., 1998. Alteration in immune responsiveness during the peripartum period and its ramification on dairy cow and calf health. J. Dairy Sci. 81:585-595.
Oppert, M., Schindler, R., Husung, C., Offermann, K., Gräf, K.J., Boenisch, O., Barckow, D., Frei, U., Eckardt, K.U., 2005. Low-dose hydrocortisone improves shock reversal and reduces cytokine levels in early hyperdynamic septic shock. Crit. Care Med. 33:2457-2464.
Orsi, N.M., Gopichandran, N., Ekbote, U.V., Walker, J.J., 2006. Murine serum cytokines throughout the estrous cycle, pregnancy and post partum period. Anim. Reprod. Sci. 96:54-65.
Plata-Salamán, C.R., 2000. Central nervous system mechanisms contributing to the cachexia-anorexia syndrome. Nutrition 16:1009-1012.
Powanda, M.C., 1980. Host metabolic alterations during inflammatory stress as related to nutritional status. Am. J. Vet. Res. 41:1905-1911.
Raghupathy, R., Makhseed, M., Azizieh, F., Omu, A., Gupta, M., Farhat, R., 2000. Cytokine production by maternal lymphocytes during normal human pregnancy and in unexplained recurrent spontaneous abortion. Hum. Reprod. 15:713-718.
Reinhard, G., Noll, A., Schlebusch, H., Mallmann, P., Ruecker, A.V., 1998. Shifts in the TH1/TH2 balance during human pregnancy correlate with apoptotic changes. Biochem. Bioph. Res. Co. 245:933-938.
Rimbach, G., Minihane, A.M., Majewicz, J., Fischer, A., Pallauf, J., Virgli, F., Weinberg, P.D., 2002. Regulation of cell signalling by vitamin E. Proc. Nutr. Soc. 61:415-425.
Rink, L., Kirchner, H., 2000. Zinc-altered immune function and cytokine production. J. Nutr. 130:1407-1411.
Rogers, A., Eastell, R., 2001. The effect of 17beta-estradiol on production of cytokines in cultures of peripheral blood. Bone 29:30-34.
Saito, S., Nakashima, A., Shima, T., Ito, M., 2010. Th1/Th2/Th17 and regulatory T-cell paradigm in pregnancy. Am. J. Reprod. Immunol. 63:601-610.
Sordillo, L.M., Aitken, S.L., 2009. Impact of oxidative stress on the health and immune function of dairy cattle. Vet. Immunol. Immunop. 128:104-109.
Sordillo, L.M., Contreras, G.A., Aitken, S.L., 2009. Metabolic factors affecting the inflammatory response of periparturient dairy cows. Anim. Health Res. Rev. 10:53- 63.
Trevisi, E., Amadori, M., Cogrossi, S., Razzuoli, E., Bertoni, G., 2012. Metabolic stress and inflammatory response in high-yielding, periparturient dairy cows. Res. Vet. Sci. 93:695-704.
Trevisi, E., Bertoni, G., 2010. Some physiological and biochemical methods for acute and chronic stress evaluation in dairy cows. Ital. J. Anim. Sci. 8:265-286.
Trevisi, E., Zecconi, A., Bertoni, G., Piccinini, R., 2010. Blood and milk immune and inflammatory profiles in periparturient dairy cows showing a different liver activity index. J. Dairy Res. 77:310-317.
van Knegsel, A.T.M., Hammon, H.M., Bernabucci, U., Bertoni, G., Bruckmaier, R.M., Goselink, R.M.A., Gross, J.J., Kuhla, B., Metges, C.C., Parmentier, H., Trevisi, E., Tröscher, A., van Vuuren, A.M., 2014. Adaptation to lactation: key to cow health, longevity and a sustainable dairy production chain. CAB Rev. 9:1-15.
Vitoratos, N., Valsamakis, G., Mastorakos, G., Boutsiadis, A., Salakos, N., Kouskouni, E., Creatsas, G., 2008. Pre- and early post-partum adiponectin and interleukin-1beta levels in women with and without gestational diabetes. Hormones 7:230-236.
Zebeli, Q., Sivaraman, S., Dunn, S.M., Ametaj, B.N., 2011. Intermittent parenteral administration of endotoxin triggers metabolic and immunological alterations typically associated with displaced abomasum and retained placenta in periparturient dairy cows. J. Dairy Sci. 94:4968-4983.


