TMR Sampling: Valuable Exercise or a Random Number Generator?
Published: June 2, 2017
By: Bill Weiss 1; Peihua Zhang 1, John Goeser 2, and Normand St-Pierre 1.
/ 1 Department of Animal Sciences, The Ohio State University; 2 Rock River Laboratory, Inc. and Department of Dairy Science, University of Wisconsin.
Summary
Sampling and analyzing the total mixed ration (TMR) has several potential uses. It can be used to identify nutritional deficiencies or surpluses in the diet that was actually fed to the cows. It can be used to estimate manure excretion of nutrients via mass balance calculations. The consistency of ration delivery can be evaluated by sampling the TMR, and it can be used to determine whether the ration that is delivered to the cows is the same as the diet that was formulated. However, for any of these uses to be valid, the TMR sample must accurately reflect the diet that was actually fed. Previously, we found that sampling variation was substantial for TMR samples. This was investigated further by sampling three different TMR (one had silages and concentrate; one had silages, concentrate and hay, and one had silages, hay, whole cottonseed, and concentrate) using two different sampling protocols. One protocol was simple and consisted of taking several handfuls of TMR across the feed bunk. The other protocol consisted of putting trays in the feedbunk prior to feed delivery and then removing the trays filled with TMR, mixing, and sampling from the trays. Sampling protocol had very little effect on sampling variation or on the accuracy of the sample. Samples of TMR did not accurately estimate the true mineral concentrations (sodium, phosphorus, and copper) of the TMR. A single sample of TMR (using either protocol), however, generally gave an accurate estimate of the true concentration for dry matter (DM) and crude protein (CP) in the TMR. For neutral detergent fiber (NDF), a single sample had a high risk of being wrong (i.e., inaccurate), but taking duplicate samples and averaging the analytical results were generally accurate. TMR sampling can be accurate for macronutrients but care must be taken when sampling and often duplicate samples will be required.
Introduction
Proper sampling of ration ingredients and submitting those samples for nutrient analysis to a good lab are essential components of diet formulation. The relative importance of sampling, analytical, and real variation on overall variation in nutrient composition data of ingredients has been discussed at previous conferences (Weiss et al., 2012; Weiss et al., 2014). Sampling variation was an equal or greater source of variation than was real month-to-month variation for corn silage over a 12-month period. Although real variation over a 12-month period was the greatest source of variation for hay crop silage, sampling variation was still an important source of variation. The overall conclusion from all those data is that averages of duplicate samples should be used for ration formulation. Using means rather than individual sample data will increase the likelihood that the nutrient composition of the
actual diet is reasonably close to formulation specifications.
Ingredients are sampled and analyzed mainly to provide data for diet formulation. TMR are sampled and analyzed for other reasons, including monitoring consistency both within a feedbunk and day-to-day, evaluating the feeder and TMR mixer, and determining whether the nutrient composition of ingredients within the TMR may have changed. Because of the different use of TMR composition data compared with ingredient composition data, sampling protocols and schedules developed for ingredients may not fit TMR sampling.
Why Sample a TMR?
1. Assessing within bunk variation in nutrient delivery. Ideally, the nutritional composition and physical form of a TMR is consistent within a pen (the portion of the TMR that was delivered first should be very similar that which was delivered last). Numerous factors affect consistency of TMR delivery, and these were discussed at a previous conference (Oelberg, 2015) and will not be discussed here. When evaluating consistency of delivery, samples are taken at various locations across the bunk, analyzed for something and then the variation is calculated. This measure of variation is compared to a benchmark to determine whether the TMR is consistent across the pen. A basic premise of this approach is that the variation between samples is caused by location and not sampling. Sampling variation refers to the difference between two samples taken in the same location within a feed bunk. If that variation was similar to the variation between samples taken at different locations within the feed bunk, you would not know whether diet delivery was inconsistent (i.e., location in 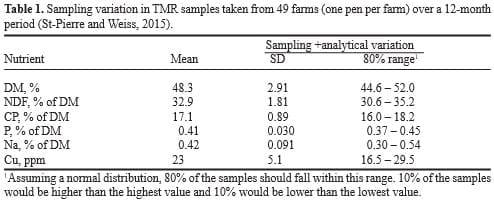
the bunk really affects composition) or if the sampler was not very good at taking representative samples. Therefore, if your objective is to evaluate consistency, multiple samples at multiple locations within the feed bunk should be taken so variation caused by sampling and location can be partitioned.
2. Assessing day-to-day consistency of TMR delivery. It is unclear at this time whether day-to-day variation in nutrient composition of TMR is important. In a survey-type experiment (Sova et al., 2014), herd average milk production was negatively correlated with day-today variation in NEL concentration (i.e., high variation was associated with lower herd average production). However in controlled experiments, substantial day-today variation in NDF, forage to concentration ratio, and fatty acids had no major effects on cow productivity (McBeth et al., 2013; Weiss et al., 2013; Yoder et al., 2013). Nonetheless, if your objective is to evaluate day-to-day variation in nutrient delivery, sampling variation must be separated from variation caused by day. To do this, multiple samples must be taken each day over multiple days. This will allow you to determine whether day is the source of variation or if the observed variation is simply an artifact of sampling (or more likely both sources are probably important).
3. Determining whether the delivered ration matches the formulated one. The nutrient composition of commonly fed forages and many concentrates exhibit substantial within farm variation (Weiss et al., 2012; St-Pierre and Weiss, 2015). Sampling and monitoring TMR composition could be used to suggest when the nutrient composition of a feed or feeds have changed, indicating it is time to re-sample ingredients and re-formulate the diet. In addition to the nutrient composition of the individual ingredients in a TMR, the nutrient composition of a TMR also reflects the recipe that was actually delivered to the pen on that day. Sampling TMR can be used to troubleshoot diets and feed delivery. If a diet is formulated to precisely meet the nutrient requirements for a pen of cows and if the requirement model used is accurate, milk production should decrease if the actual delivered diet provides less nutrients over a period of days than anticipated. Because of feeder errors and scale errors, the delivered diet may differ markedly from the formulated diet even, when the nutrient composition of the individual ingredients has not changed. Sampling a TMR, if the results accurately reflect the delivered diet, could help a nutritionist identify nutrient deficiencies or feed delivery problems. To make valid conclusions regarding the nutrient composition of the delivered diet, the sample results must accurately reflect the composition of the TMR delivered to the pen. If sampling error is high, a nutritionist may conclude that the delivered TMR is not what was formulated and spend time trying to identify the reason why that occurred, when in reality the TMR was correct; it was the sample that was bad. Conversely, a bad sample could suggest that the TMR is matching specifications when really it does not.
4. Monitoring nutrient management plans. On some dairy operations, the amount of P and N excreted in manure must be monitored to ensure compliance with environmental regulations. Accurate sampling of manure is extremely difficult and calculated nutrient balance offers an alternative approach (Castillo et al., 2013). Intake of P or N can be calculated by multiplying feed delivery to the herd times its concentration of P and N and sampling milk and analyzing that for P and N and then subtracting milk secretion from intake. The remainder is an estimate of the amount of N and P excreted in manure. Measuring the P and N (i.e., CP) in a TMR sample can be used to estimate intake of those nutrients. However, if the sample does not accurately reflect the TMR, the actual nutrient application to soil may exceed a farm’s nutrient management plan. Using TMR composition data to evaluate diets and troubleshoot nutritional problems has great potential; however, for TMR data to be useful, the nutrient composition of the sample must accurately reflect what was delivered to the pen (i.e., the sample results must be accurate). The recurring theme for all the possible uses of TMR sampling data is that sampling error must be known for you to reach valid conclusions regarding the data.
Is Sampling Error a Concern for TMR?
Sampling error (or sampling variation) simply means that if you take multiple samples from the same population, you obtain different values (ignoring analytical variation). A population could be a truck load of distiller grains, a pile of silage that will be fed to a group of cows today, or a TMR that was delivered to a pen of cows. With respect to feeds and TMR, sampling error occurs because different particles (which are what are actually sampled) have widely different nutrient composition. A TMR is comprised of particles that vary in density, size, shape, and nutrient composition. A stem of hay is light, long, and is generally high in fiber, whereas a grain of salt is heavy, small. and has no fiber. Because of this, sampling error is a major issue for TMR. From a field study of about 50 dairy farms across the U.S., sampling and analytical variation (because of the design of the experiment, these 2 sources of variation could not be separated) accounted for 36 to 70% of the total within farm variation in TMR composition (the range represents different nutrients) over a 12-month period (St-Pierre and Weiss, 2015). Sampling error was great enough to have a substantial impact on interpretation of results (Table 1). For example, based on Table 1, you have a 10% chance that a single sample of TMR could have a CP concentration <16% when the true concentration was 17.1%. These large sampling errors reflect the heterogeneous nature of TMR and the ease at which poor samples can be taken.
Improper sampling techniques could result in a sample having fewer small particles than the actual TMR. Small particles are often rich in starch, minerals, or protein, which means that in this case, the sample might have lower concentrations of those nutrients than the actual TMR. Because of the wide disparity between particles with respect to size and density, particle gradients can develop within a pile of TMR in the feed bunk. With mechanical movements, large light particles (such as pieces of hay) tend to rise to the top of a stack and dense small particles tend to sink. This means that a handful of TMR taken from the top of the pile may have higher NDF concentrations, and a handful of TMR taken from the bottom of the pile may be enriched in starch or protein.
TMR Sampling Project
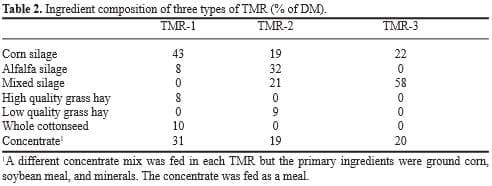
To determine whether sampling method affected the accuracy (i.e., how close the nutrient composition of a TMR sample came to the true composition of the TMR) and precision (how much variation was observed among samples) of TMR sampling and to determine the overall accuracy of TMR sampling, a study was conducted at the Krauss Dairy Center at OARDC in Wooster. Three different pens with TMR that differed greatly in ingredient components (Table 2) were sampled for 3 consecutive days and then sampled again for 3 consecutive days the following week. Each TMR was sampled using 2 different sampling methods (discussed below) and a duplicate sample was taken each day from each method. Each sample was then assayed in duplicate for DM, NDF, and CP using standard wet chemistry methods at the OARDC Dairy Nutrition Lab. Dry ground samples were sent to Rock River Laboratory (Watertown, WI) and analyzed in duplicate for major and trace minerals using standard wet chemistry methods. This protocol allowed us to determine sampling error for 3 different types of TMR and whether sampling method could affect accuracy and precision. Not all the statistical analyses have been completed, so this paper will discuss mostly accuracy rather than precision.
Sampling protocols
Both protocols were performed immediately after the TMR was delivered to the pen. The simple protocol consisted of taking 1 handful of TMR every approximately 10 feet of the feed bunk, yielding about 6 handfuls per pen. The top, middle, and bottom third of the TMR was sampled alternatively as the sampler walked the feed bunk. The handfuls were placed into a large plastic bag. The handfuls were collected with the palm facing upward to reduce loss of small particles. That process was immediately repeated to yield a duplicate sample. The complex sampling protocol consisted of placing 4 trays (2 ft wide x 3 ft long x 8 inches tall in the manger just before TMR delivery. The trays were equally spaced across the bunk (Tray 1 was at the south end, then 2, 3, and 4). Immediately after feed was delivered, the 4 trays filled with TMR were pulled to the center aisle. At this point, the simple sampling protocol was conducted. After that was completed, the contents of Tray 1was emptied onto a clean sheet of plastic and mixed using a scoop. The contents was sectioned and 2 approximately 1/8 sections was removed with a scoop and placed into an empty, clean tray. That process was repeated with Tray 3. The subsample from Trays 1 and 3 were combined, thoroughly mixed, and a section was removed with a scoop and placed into a bag. The duplicate sample was obtained by repeating this process using the contents of Tray 2 and 4. The 4 samples per pen (2 sampling methods in duplicate) were brought to the lab and analyzed.
Determining accuracy
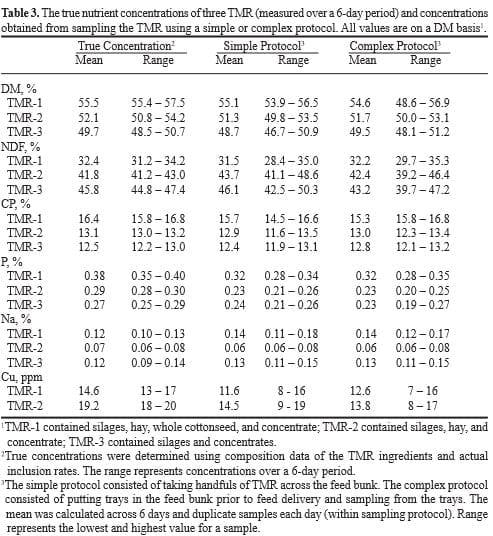
Each day the TMR were sampled, all TMR ingredients (silages, hays, concentrate mixes, and cottonseed) were sampled in duplicate and analyzed in duplicate using standard wet chemistry methods. Ingredient inclusion amounts were recorded electronically using commercially available TMR software. Multiplying inclusion rate by assayed composition (mean of the duplicate samples and duplicate assays) yielded what we considered the actual or true composition of the TMR.
Effect of Sampling Protocol
The effect of sampling protocol (simple vs. complex) on sampling variation was not consistent across the different TMR or across nutrients. For the majority of TMR and nutrients, protocol had no effect on sampling variation. The complex protocol had greater sampling variation than the simple method for DM concentration in TMR-1 (contained hay and cottonseed), for NDF concentrations for TMR2 (contained hay), and TMR-3 (contained only silage and concentrate). Conversely, the complex protocol had statistically lower sampling variation for NDF concentration of TMR-1, for CP and Na in TMR-2, and Na in TMR-3. We hypothesized that for the most variable matrix (TMR-1 that contained silage concentrate, hay, and cottonseed), the complex sampling method would be more consistent, and for the simplest matrix (TMR-3 with just silages and concentrate), sampling protocol would not have any effect on sampling variation. With respect to sampling variation, the simple protocol was generally just as good (and much easier and faster) than the complex method.
We also statistically tested whether sampling protocol affected nutrient concentrations. This does not evaluate accuracy (e.g., the protocols could give similar numbers but both could be wrong). For most nutrients and TMR types, sampling protocol did not affect analytical results. The only meaningful difference between sampling protocols was for NDF concentration of TMR-3 (silage and concentrate only). The simple method yielded a mean of 46.1%, whereas the complex method had a mean of 43.2% (Table 3). If this was a consistent finding across TMR types (i.e., the simple method had higher NDF concentrations) ,it would likely mean that the protocol resulted in loss of small particles, but since this was only found with one TMR type, it may be just a spurious finding.
Accuracy has a flexible definition depending on how good is good enough. If you were constructing a nuclear submarine, tolerances might be expressed in nanometers, but if you are digging a hole for a fence pole, tolerances may be several inches. For TMR accuracy, we decided that if a sample result was within 5% of the real value, the sample was accurate. Accuracy was evaluated for major nutrients (DM, NDF, and CP), phosphorus (because it can be used in nutrient management plans and because it is mostly in basal ingredients, not mineral supplements), sodium (because most sodium is from salt), and copper (as an example trace mineral). To evaluate accuracy, we calculated the deviation of the real value from each sample result and we also calculated the mean of the duplicate samples (within each protocol) and calculated the deviation of the real value from that mean.
Minerals
About half the copper in the 3 TMR were from mineral supplements within the concentrate mix and about half was from basal ingredients. Taking a single sample using either protocol from any of the 3 types of TMR had absolutely no value in estimating the true concentration of copper. Of the 72 individual TMR samples (3 types of TMR x 6 days x 2 protocols x 2 duplicate samples = 72), only 8 (11%) of the samples were within 5% of the true value and 39 samples (54%) were more than 20% different from the true value. Across sampling protocols and TMR types, samples usually had lower concentrations of Cu than the actual TMR. The samples for TMR-3 (silage and concentrate) were slightly less inaccurate compared with the other two types of TMR. The average deviation for TMR-1 and TMR-2 was about 25% (averaged across sampling protocol) and about 18% for TMR-3. Taking duplicate samples and averaging slightly improved the accuracy of TMR samples for copper, but the results were generally so inaccurate as to be useless. Only 1 (3%) of the duplicate means was within 5% of the true mean, and 17 of the means (47%) were more than 20% different from the mean.
The vast majority of sodium in these TMR was from added salt contained in the concentrate mix; therefore, sodium can be used as a marker of concentrate inclusion accuracy and the uniformity of the mix. On average, sample concentrations of sodium were higher than true concentrations for TMR-1 (hay and cottonseed) and TMR-3 (silage) but lower for TMR-3 (hay). Both sampling protocols had the same pattern. No difference in accuracy of single samples was found between the 2 sampling protocols, and results for sodium were similar to those for copper. For sodium, individual samples from TMR-2 (included hay) were more accurate than for the other 2 types of TMR (average deviation for TMR-2 was about 10% compared with about 22% for the other 2 TMR). We do not have a reason why that type of TMR yielded more accurate sampling results. Overall, single samples for sodium were not accurate; only 12 of the samples (17%) were within 5% of the actual concentration and 29 samples (40%) were more than 20% different from actual concentrations. Taking duplicate samples and averaging did not improve the accuracy greatly. Only 6 duplicate means (17%) were within 5% of the actual value.
Unlike sodium and copper, essentially all the phosphorus in the 3 TMR was from basal ingredients not mineral supplements. Across sampling protocols and TMR types, concentrations of P in samples was less than the actual concentration. Sampling method or TMR type had no effect on accuracy; accuracy was poor for everything. Only 2 samples (3%) had P concentrations within 5% of the true concentrations and 23 samples (31%) differed from the true values by more than 20%. Averaging duplicate samples did not improve accuracy. These data bring into question the use of TMR sample data to calculate P balance on farm as part of a nutrient management plan. The overall conclusion of these data is that a single TMR sample has little value in assessing the accuracy of mineral delivery and averaging duplicate samples probably will not help very much. Indeed averaging all the samples within a protocol was still not accurate for minerals (Table 3).
Macronutrients
Sampling a TMR was accurate for estimating its true DM concentration. This was true for both sampling protocols and all 3 types of TMR. The average deviation was <3% and 96% of the samples were within 5% of the true values. Sampling TMR using either method accurately reflected the CP concentration of the TMR. Differences in accuracy between sampling protocols were minor. For TMR-2 and TMR-3, a single sample was within 5% of the true concentration of CP 80% of the time and only 1 sample (TMR-2) was >10% different from the true value. Single samples were less reliable for the TMR with hay and cottonseed (54% of the samples were within 5% of the true value and 8% of the samples were more than 10% different from the mean). Averaging duplicate samples eliminated the extreme error (no mean was more than 8% different from the true value and most means were within 6% of the mean).
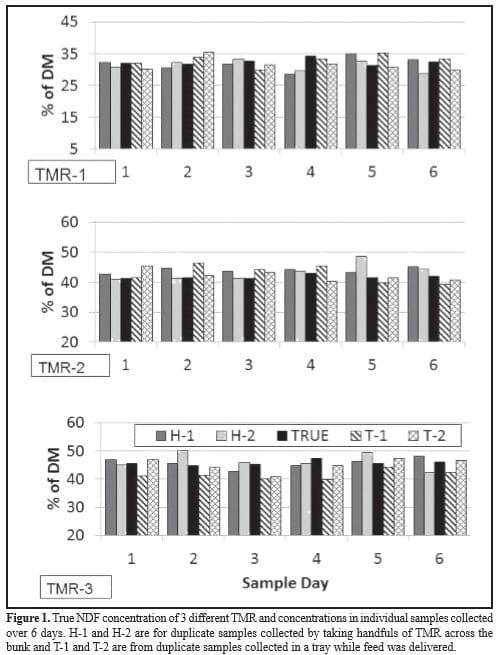
As with all other nutrients, sampling protocol had no effect on accuracy for NDF concentrations and accuracy did not differ greatly between the TMR types. A single sample to assess the NDF concentration of a TMR was less reliable than for CP. Only 50% of the single samples were within 5% of the true concentration for NDF and almost 20% of the samples differed by more than 10% (Figure 1; Table 3). Using means of duplicates increased the chance of being within 5% of the mean (60% of the means were within 5% of the true values), but more importantly, means greatly reduced the chances to obtain extreme deviations (10% of the means were more than 10% different from the true value).
Conclusions
Using a simple, yet good sampling technique for obtaining TMR samples was generally accurate for macronutrients (DM, NDF, and CP); however, using results from a single sample had a high risk of being very wrong (>10% different) with respect to NDF. Taking duplicate samples and averaging reduced the risk of being wrong but did not greatly increase overall accuracy. Sampling TMR did not accurately assess mineral delivery.
Presented at the Tri-State Dairy Nutrition Confererence, 2016.
References
1 Castillo, A.R., N.R. St-Pierre, N. Silva del Rio, and W.P. Weiss. 2013. Mineral concentrations in diets, water, and milk and their value in estimating on-farm excretion of manure minerals in lactating dairy cows. J. Dairy Sci. 96:33883398.
2 McBeth, L.J., N.R. St-Pierre, D.E. Shoemaker, and W.P. Weiss. 2013. Effects of transient changes in silage dry matter concentration on lactating dairy cows. J. Dairy Sci. 96:3924-3935.
3 Oelberg, T.J. 2015. Effective outcomes of TMR audits. Proc. Tri-State Dairy Nutr. Conf. pgs. 121-132.
4 Sova, A.D., S.J. LeBlanc, B.W. McBride, and T.J. DeVries. 2014. Accuracy and precision of total mixed rations fed on commercial dairy farms. J. Dairy Sci. 97:562-571.
5 St-Pierre, N.R., and W.P. Weiss. 2015. Partitioning variation in nutrient composition data of common feeds and mixed diets on commercial dairy farms. J. Dairy Sci. 98:50045015.
6 Weiss, W.P., C.T. Hill, and N. St-Pierre. 2014. Proper sampling and sampling scheduling can prevent reduced milk yields. Proc. Tri-State Dairy Nutr. Conf. pgs. 149-162.
7 Weiss, W.P., D. Shoemaker, L.R. McBeth, P. Yoder, and N.R. St-Pierre. 2012. Within farm variation in nutrient composition of feeds. Proc. Tri-State Dairy Nutr. Conf. pgs. 103-140.
8 Weiss, W.P., D.E. Shoemaker, L.R. McBeth, and N.R. St-Pierre. 2013. Effects on lactating dairy cows of oscillating dietary concentrations of unsaturated and total long-chain fatty acids. J. Dairy Sci. 96:506-514.
9 Yoder, P.S., N.R. St-Pierre, K.M. Daniels, K.M. O'Diam, and W.P. Weiss. 2013. Effects of short term variation in forage quality and forage to concentrate ratio on lactating dairy cows. J. Dairy Sci. 96:6596-6609.
Related topics:
Authors:


Rock River Laboratory. Inc.
Recommend
Comment
Share
25 de octubre de 2019
Ehsan The samples must be in their individual bags, It is not in their sub-samples. thus, when you sample forage, you must keep it in a bag and as well repeat the entire process. Other samples should be kept in a bag. Analyze each bag in the Lab separately.
Recommend
Reply
21 de octubre de 2019
Great work. What do you mean by "duplicate" sampling? It means dividing the same sample to 2 samples and analyzing both of them separately?
Recommend
Reply

Would you like to discuss another topic? Create a new post to engage with experts in the community.
Featured users in Dairy Cattle


