INTRODUCTION
When attributional life cycle assessment (LCA) is used to calculate the greenhouse gas (GHG) intensity of corn ethanol the consequences of feeding by-products from ethanol production (DDGS) must be taken into account. Current LCA approaches assume that there are fixed ratios for substituting by-products for a few feed ingredients. This assumption is only partially correct due to the dynamics of the animal feeding industry.
Animal diets are formulated to contain minimum amounts of 15-40 different nutrients, depending on the species in order to maximize production of meat, milk or eggs. The price of feed dominates the cost of the production of animal products. For example, in 2008 feed ingredient costs were 68.7% of live production costs of broiler chickens (Donohue & Cunningham, 2009). Because of the prevailing role of feed costs as determinants of profitability, animal nutritionists utilize optimization software to determine the proportions of available feed ingredients (i.e. feedstuffs) that minimize costs while still providing dietary nutrient levels that maximize production rates and product quality.
Over 2,000 different feedstuffs are fed to animals in North America (Ensminger, Oldfield, & Heinemann, 1990). These feedstuffs range from crops grown purposefully for animals, such as alfalfa or corn, to refuse from human food or fiber production such as rice bran, wheat middlings or cotton seeds. If price is not considered, many of these diverse feedstuffs can be substituted for each other without compromising the performance of livestock. Among this gamut of potential combinations of feedstuffs, the cheapest solution (least-cost feed) is entirely dependent on the relative price of each feedstuff. When the price of a feedstuff, such as DDGS, becomes low enough relative to competing ingredients it will be included in an animal's diet. Inclusion of DDGS in a least cost formulation displaces a portion of numerous other feedstuffs. This is because DDGS, like all other feedstuffs, contains a unique proportion of energy, lysine, methionine, phosphorus and all of the other nutrients that are balanced simultaneously. For example, when DDGS are included in a least-cost broiler diet, it causes a decrease in the content of several feedstuffs (corn, soymeal, meat meal) and it also causes an increase in the level of several others (lysine, methionine, fat). Displacement or addition of feedstuffs due to inclusion of DDGS will have land use GHG emission implications if production of feedstuffs requires land to produce them, e.g., corn and wheat. Some other feed ingredients displaced such as vitamins do not have land use implications but still have climate change implication due to use of material and fossil fuel inputs in their life cycles. Indirect land use change (iLUC) GHG emissions have become an important consideration in life cycle analysis of biofuels and regulations such as the Low Carbon Fuel Standard in California. Various iLUC models utilize DDGS displacement ratios to capture land avoided as a result of feedstuff displacement. To correctly estimate iLUC emissions, displacement ratios that reflect reality are highly valuable. In addition, one would have to separately tally the GHG values for each of the feedstuffs that changed in the ration that do not have land use implications to estimate Life cycle GHG emissions of biofuels.
Feedstuff prices are highly variable across time as a result of macroeconomics and are also variable across regions of the country due to transportation costs. For this reason, animal nutritionists reformulate diets frequently in order to capture real-time fluctuations in ingredients prices. Diets are also formulated regionally to capture the differing feedstuff prices in different markets. Consequently, the proportion of feedstuffs in a diet is dynamic, changing with time and location. In some parts of the country numerous competing feedstuffs are considered when formulating a feed, whereas other regions have fewer options. For example, nutritionists formulating animal diets in California, which has a very diverse agriculture, will consider dozens of feedstuffs ranging from purpose grown corn and oilseeds to a vast array of byproducts from fruits, vegetables, nuts, wheat, rice, cotton, and ethanol production. The resulting diets often utilize in excess of 10 feedstuffs. Nutritionists in Central and Midwest regions, where corn and soy dominate agriculture, have fewer options and consequently simpler diets. Clearly the displacement ratios that are appropriate for one region of the country are not valid for other regions.
To date, displacement ratios for DDGS have been very simplistic for several reasons. First and most importantly, the research on which these displacement ratios are based was designed for other purposes. Much of this research was done to define the upper limits of DDGS that can be included before animal production rate, efficiency or product quality is impaired (Cromwell et al., 2011; Felix, Zerby, Moeller, & Loerch, 2011; Klopfenstein, Erickson, & Bremer, 2008; Lumpkins, Batal, & Dale, 2004; Masa'deh, Purdum, & Hanford, 2011; Stein & Shurson, 2009). Other research focused on determining the digestibility of the nutrients in DDGS (Adeola & Ileleji, 2009; Peter et al., 2000; Widmer, McGinnis, & Stein, 2007). In each case the experimental diets were not formulated using least cost techniques, but were purposely designed very simply in order to allow repeatable and publishable interpretations related to the nutritional value of DDGS. Second, most of the research was done in the Midwest region where feedstuff options are relatively limited and animal diets are correspondingly simple. Applying research results from one region to distant regions that use very different feedstuffs is misleading and likely results in low accuracy of current displacement ratios used for calculating GHG emissions of the ethanol industry.
The objective of this study is to determine the shifts in feedstuff usage that occur when regionally-specific "least-cost" diets are provided to animals throughout the US as a result of including DDGS at typical levels. This was done by using a realistic range of feedstuff prices to formulate least cost diets according to industry standards. This process was replicated across the primary production regions for a given species. A "US composite" was then tallied by weighting the different least cost solutions according to the actual animal production rates in each region. This process was done for each the major livestock groups: beef cattle, dairy cattle, broilers, egg laying chickens, turkeys and swine.
METHODS
The digestible nutrient profiles of feedstuffs and the nutrient requirements of target species generally conformed to the recommendations of the National Research Council (NRC Nutrient Requirement Series; http://www.nap.edu/topics.php?topic=296) for each species, but were amended to reflect current industry data and practices. This was done by surveying existing practices of consulting and industry nutritionists experienced for each of the target species in each of the target regions.
Feedstuff prices for each region were obtained from the USDA Market Data Reports (http://www.ams.usda.gov/AMSv1.0/ams.fetchTemplateData.do?template=TemplateP&navID=MarketNewsAndTransportationData&leftNav=M arketNewsAndTransportationData&page=LSMarketNewsPageFeedstuffs) in the summer of 2011. For feedstuffs not covered by USDA, data compiled in the publication "Feedstuffs" was utilized (http://fdsmagissues.feedstuffs. com/fds/Reference_issue_2012/ReferenceIssue2011. html). Because commodity feedstuff prices are strongly linked to the highly volatile crude oil prices (Donohue & Cunningham, 2009), most large animal and feed producing companies lock in commodity prices in order to buffer price shocks. Integrators and compounders were surveyed for actual commodity prices and prices were modified as necessary to reflect true costs to feed compounders. Additionally, the broiler, swine, and beef feedlot industries are highly concentrated and the small numbers of very large producers have considerable bargaining power and often pay less for feedstuffs. Thus prices were adjusted as appropriate for this market leverage.
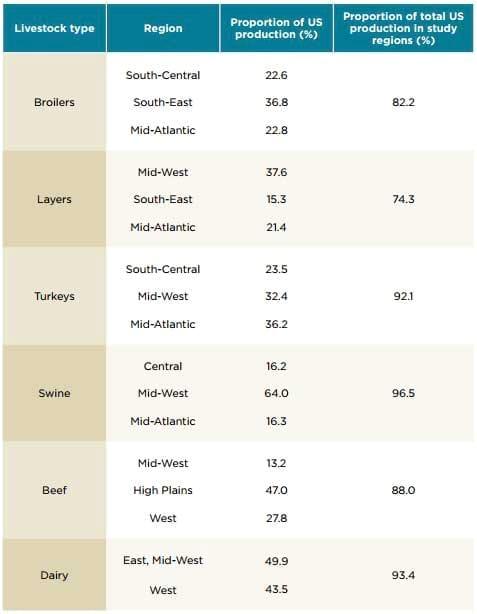
For poultry, swine, and beef cattle three complete feeds (diets) were formulated for three different regions in the US (Table 1). For dairy cattle, only two regions were considered. Commercial least cost software, specifically designed for each species was utilized to formulate each diet. Mixit Win4 software program (Agricultural Software Consultants, Mixit-Win version 3, 2004) was used for poultry and swine diets. PCDairy (Robinson & Ahmadi, 2005) and Taurus (Oltjen, Dunbar, & Ahmadi, 2006) were used for dairy and beef cattle diets, respectively. In practice, production animals are fed several different diets in order to match dietary nutrient levels to their changing nutrient requirements (e.g., starter, grower, finisher, withdrawal). For this study a typical grower-finisher diet of poultry and swine was the focus because it is consumed in the greatest amount and also contains higher levels of DDGS than starter diets. Diets fed to finishing beef cattle are much less variable so only one "typical" diet was considered. In the case of dairy cattle, two diets were formulated in order to capture the large differences between diets fed for a mid-level versus high-level of milk production. Three diet types were formulated for each species: 1) Diet without DDGS; 2) Diet containing DDGS at the maximal level that does not decrease animal performance or product quality 3) Diet containing DDGS at a half-maximal level. Each or these 3 diet types were repeated in 3 regions (9 formulations per species) for layers, turkeys, broilers, swine, and beef. For dairy, each of the three diet types was repeated for cows at mid and high-production levels and in two different regions (12 formulations). Thus the total number of formulations (computer runs) was 57
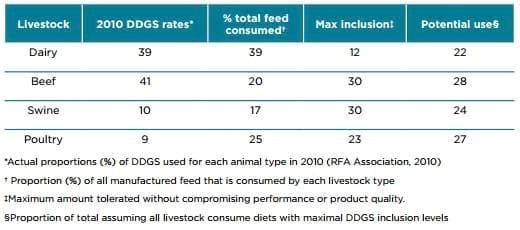
The maximal level of DDGS that can be fed without causing decreases in animal performance or product quality is a matter of great debate. In a formal survey of mid-west livestock producers (U.S. Department of Agriculture, June 29, 2007), DDGS were being included in diets at the following levels: Dairy cattle, 8%; Cattle on feed, 11%; Beef cattle, 28%, Hogs, 11%. These levels are well below the maximal levels found in literature reviews (Klopfenstein, Erickson, & Bremer, 2007; Schingoethe, Kalscheur, Hippen, & Garcia, 2009; Stein & Shurson, 2009). This is likely due to several reasons including experience with their use and issues with product quality (Hoffman & Baker, 2011; Kleinschmit, Schingoethe, Kalscheur, & Hippen, 2006; Liu, 2011; Shim, Pesti, Bakalli, Tillman, & Payne, 2011; Stein & Shurson, 2009; Tedeschi, Kononoff, Karges, & Gibson, 2009). DDGS and similar products from the brewing industry have been used for many decades in ruminant diets and their nutritional characteristics are well known; consequently actual industry inclusion levels are closer to theoretical maximums. This is not the case for hogs and poultry, where industry levels in 1996 were considerably below theoretical maximums. Additionally hogs and poultry are more sensitive to product quality issues than ruminants. The DDGS used by academic researchers is often "best quality" product that, when available to producers, commands a higher price than average quality product. With increasing experience using DDGS and improving product quality, DDGS inclusion rates have increased markedly in hog and poultry diets since 2006. The maximal inclusion levels selected for each species for this current study reflect these conflicting issues.
Maximal inclusion constraints were placed on most feedstuffs at the maximal tolerable level that does not decrease production rate, efficiency, or quality. In some cases, maximum constraints were placed because of limiting amounts of regional availability. This was done to ensure that diets formulated were realistic and did not include more of a feedstuff than is available within a specific region. Minimum constraints were placed on home-produced ingredients such as silages. Waste products from bakeries, food processors and restaurants are extremely heterogeneous and are represented by the generic name "bakery waste products". The regional formulations were ground truthed by comparison with actual diets currently and historically fed by large commercial confinement production companies and appropriate adjustments were made.
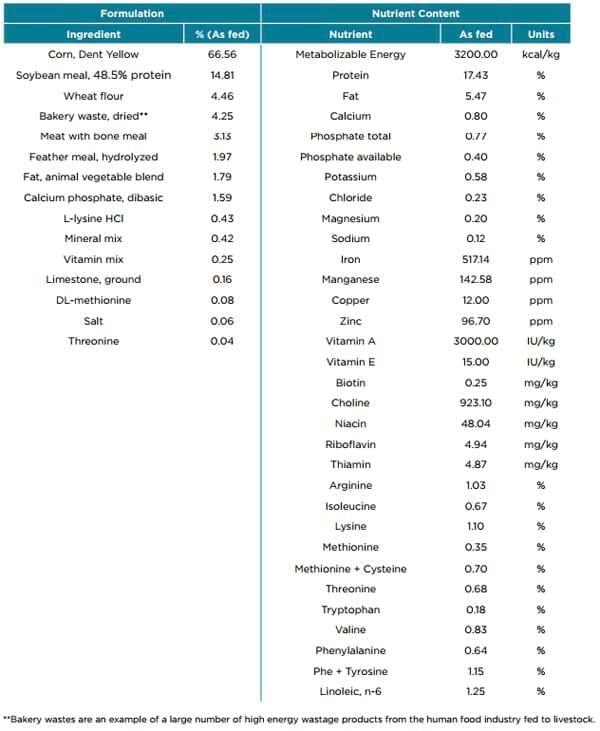
Poultry and swine diets were formulated to meet required levels of metabolizable, digestible amino acids, bioavailable minerals and vitamins. Ruminant diets were formulated to meet minimum levels of net energy, acid detergent fiber, crude protein and minerals. A typical diet formulated without DDGS is shown in Table 2.
To calculate a composite displacement ratio across all six livestock types, the displacement ratios for each individual livestock type was corrected for proportion of the total diet consumed by all species. To calculate feed consumption for each livestock type, the total pounds of animal production reported for 2010 (World Agricultural Supply and Demand Estimates, USDA; http://www.usda. gov/oce/commodity/wasde/) were multiplied by the feed conversion efficiency of each livestock type (Arora, M., & Wang, 2010). In the case of beef cattle, the total weight produced was corrected for the proportion that would be expected to be gained in feed lots, since about 60% of weight gain occurs prior to entering the feedlot. The calculated proportions of total diet consumed were: broilers, 18.6%; turkeys, 4.3%; layers, 1.7%; swine, 16.9%; beef, 19.9%; dairy, 38.6%. The values for ruminants include the roughage components (hay and silage) because these are typically adjusted when DDGS are added.
RESULTS
Species differences:
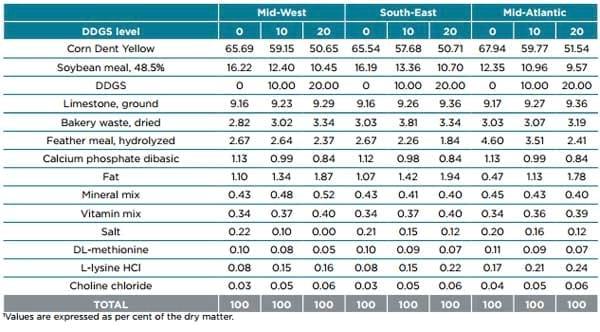
Amounts of DDGS that poultry and swine producers are currently willing to use has increased considerably these past several years due to increased protein quality (digestibility) resulting from better DDGS processing (Almeida, Petersen, & Stein, 2011; Kim, Parsons, Srinivasan, & Singh, 2010) and due to increased prices of corn and soymeal. Levels for beef have been stable but levels for dairy have decreased somewhat recently because of problems with milk fat (Schingoethe, et al., 2009). Thus, the inclusion levels for non-ruminants were higher than those suggested in the peer reviewed literature, while those for dairy were similar or somewhat lower (Tables 3-8).
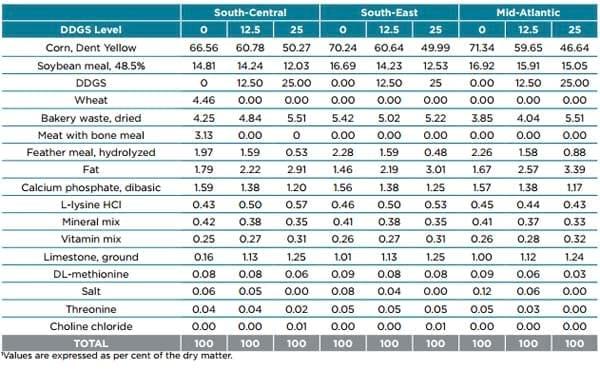
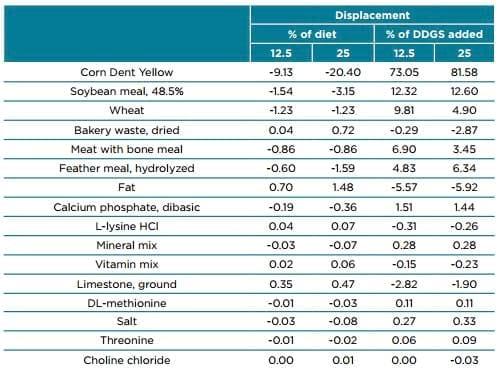
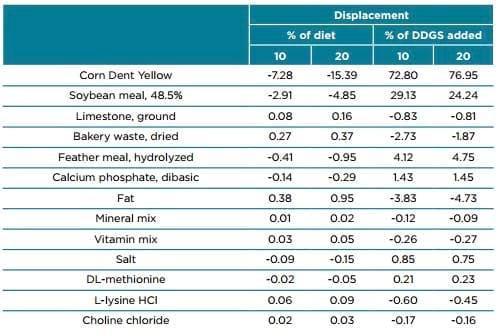
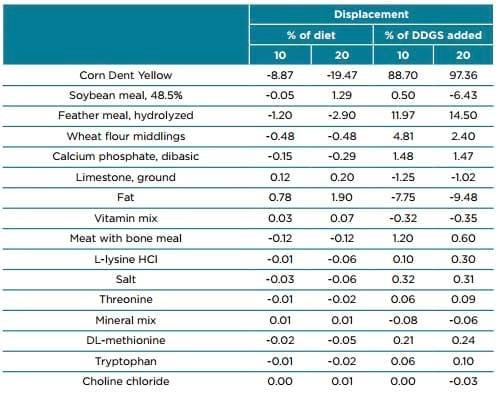
In poultry and swine diets, DDGS displaced mostly corn, feathermeal and soymeal, but increased the use of fat and bakery waste in all regions. This displacement pattern reflects the high protein but low energy properties of DDGS for non-ruminants. Thus, additional high energy sources, such as fat and bakery waste, are enriched in the diet as DDGS levels increase.
Displacement ratios for DDGS in ruminant diets are hard to generalize because of the plethora of regionally specific high fiber feedstuffs that are used. In general DDGS displace much less corn and soymeal in ruminant diets than in non-ruminants, but they displace much higher amounts of byproducts of human food and fiber production such as rice bran, wheat mill run, and cotton seed meal. Animal fats are also displaced because ruminants can use the high fiber content of DDGS for energy; this is the opposite of the case for non-ruminants.
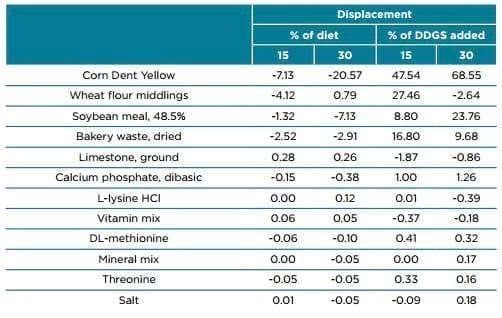
In practice, the amount of DDGS that would be included in any diet is dependent on several factors, the most important of which is price. The highest price at which DDGS would continue to be included in a diet at the maximal tolerable level differs for each species because of their ability to digest the fiber in DDGS and also their differing dietary requirements for amino acids, especially lysine and methionine. We calculated that the maximal price is highest for swine > layers > beef > dairy = broilers = turkeys. This calculation assumes high quality DDGS; low quality DDGS have poorly digestible amino acids, which greatly diminishes their value for poultry and swine. In the case of non-ruminants the DDGS price for maximal inclusion is extremely sensitive to the price of soymeal, fat and amino acids. For ruminants, the maximal price of DDGS is highly sensitive to the price of "on farm produced" silages. However, estimating the price of silage is difficult because there is not an extensive market for this commodity so the confidence interval surrounding the maximal price of DDGS for ruminants, especially dairy cows, is broad.
Regional Differences:
The differences in least cost diets across major production regions were much greater for ruminants than nonruminants (Tables 3-8). For example, the corn content of broiler diets devoid of DDGS varied from 66.6% to 71.3% across the 3 regions. The corn content of beef diets devoid of DDGS varied from 52.9 to 80.5%. This is due to the fact that there are few alternatives to corn as a source of metabolizable energy for monogastrics, but ruminants can use a variety of silages and somewhat high fiber byproducts in place of corn (e.g., rice bran, canola meal, cotton seed meal).
There are also large regional differences in the ingredients displaced by DDGS. Again, there are larger differences for ruminant diets than non-ruminant. For example, in beef diets adding 30% DDGS displaced 23.4% corn (i.e. displacement ratio of 0.78) in the high plains where few other ingredient options exist, but they displaced only 1.5% corn in the more complex diets of the West. In broiler diets, adding 25% DDGS displaced 24.7% corn in the MidAtlantic but only 16.29% corn in the South Central region. This is largely due to presence of wheat and other high energy ingredients in diets in the South Central region.
Composite Displacement values:
Species-specific displacement values (% of DDGS added) across all regions, corrected for the proportion of US production in each region, are shown in Tables 9-14. When DDGS were formulated at maximal inclusion levels for each livestock type, DDGS displacement values for corn ranged from 40% for dairy cows to 97% for turkeys. For soybean meal, displacement values ranged from 24% for laying hens and swine to -6% for turkeys. A negative displacement value suggests the use of DDGS requires additional use of a particular feedstuff. DDGS displacement values (% of DDGS added) were relatively similar between inclusion rates at maximal amounts and at half maximal amounts for poultry and beef diets. However, the two different levels of inclusion rates resulted in very different displacement values for swine and dairy diets.
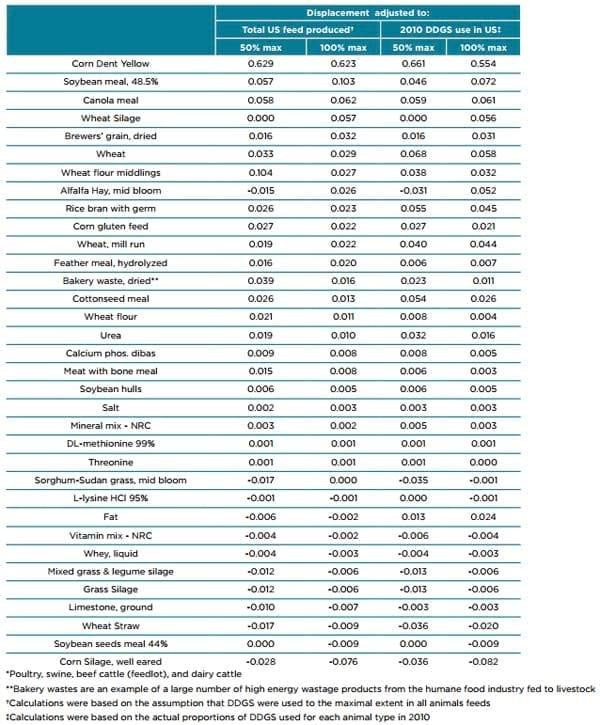
The total amount of DDGS that was actually consumed by each livestock type in the US during the 2010 year is shown in Table 15. A US composite displacement ratio was calculated by using the consumption rates in Table 15 to adjust the DDGS displacement ratios for each livestock type (Table 16; last two columns). If all of the DDGS fed in 2010 were included in the diets at maximum tolerable levels, the US displacement ratio is 0.55 for corn, 0.07 for soymeal, and 0.06 for canola meal. In a scenario where all of the DDGS being fed were included in diets at a level of half the maximal level (i.e. twice as many producers feeding half as much) the displacement ratios for corn increases to 0.66 and that for soymeal decreases to 0.05. Thus, the exact displacement ratio for a given amount of DDGS depends partly on the number of producers using it.
Looking to a future when more DDGS are produced and pricing and quality will allow full penetration of the poultry and swine markets in addition to the ruminant markets the proportional consumption of DDGS will become somewhat similar across livestock sectors (Table 15). Under this scenario poultry and swine consume a higher proportion of the DDGS and the US composite displacement ratio changes somewhat from the 2010 scenario. At maximal consumption by all livestock types (first two columns of Table 16), the displacement ratio is 0.62 for corn and 0.10 for soymeal. Interestingly the displacement ratio for fat goes from positive for the 2010 scenario to negative for the future scenario, which is due to the fact that DDGS have a high energy ratio for ruminants and displace fat but they have a low energy ratio for nonruminants and require the addition of additional fat. Thus as more DDGS are consumed by non-ruminants relative to ruminants, more fat is added to the composite diet. However, in either case, the total displacement ratio for corn and soybean combined does not exceed 0.72. This is a lower ratio than suggested by earlier studies (Anderson, Schingoethe, Kalscheur, & Hippen, 2006; Hoffman & Baker, 2011; Klopfenstein, et al., 2008; Whitney, Shurson, Johnston, Wulf, & Shanks, 2006).
Differences compared to other studies:
Most previous studies on displacement ratio of DDGS (Anderson, et al., 2006; Hoffman & Baker, 2011; Klopfenstein, et al., 2008; Whitney, et al., 2006) relied on the diets used in the peer reviewed literature for estimating displacement ratios. Though this is an obvious and laudable first step, the diets used in the peer reviewed literature are not often similar to those used in the industry. Often only three or four ingredients were adjusted when DDGS were included (corn, soymeal, phosphate, urea). As discussed above, most scientific research employs only common ingredients that allow for easy formulation of diets that vary in as few feedstuffs as possible while keeping the levels of essential nutrients constant across various experimental diets. This allows for greater experimental control and publishability because changes in DDGS are confounded with as few dietary factors as possible. This approach is useful to academicians for understanding the nutritional value of DDGS but is not representative of the way nutrition is actually done in the industry (i.e. least cost formulation), where large numbers of potential feed ingredients are considered and the cheapest combination of feed ingredients are utilized. The recent publication by Hoffman and Baker (Hoffman & Baker, 2011) provides the most extensive estimate of displacement ratios for major production species: Beef cattle - corn, 1.0 and soymeal, 0; Dairy cattle – corn 0.45, soymeal, 0.55; Swine – corn 0.89, soymeal, 0.10; poultry – corn 0.51, soymeal, 0.50. The difference between DDGS displacement ratios from previous studies and this current analysis are somewhat subtle for poultry and swine but are large for ruminants, which are typically fed a wide variety of different byproducts from the human food and fiber industries (e.g. rice bran, almond hulls, cotton seed meal) as well as silage.
Another important difference between this current analysis and previous studies is the use of a "bonus" for improved growth rates and feed efficiency for feedlot beef cattle fed DDGS. In some locations, such as parts of the high plains, feeding wet DGS can increase feed efficiency and growth rate as a result of increased palatability and fiber quality compared to simple diets containing mostly corn, soymeal and urea. This increased performance is not seen in studies that use more complex diets or if DDGS are used. In fact, anecdotal observations of some consulting nutritionists indicate that growth rate and efficiency are decreased with increasing DDGS in regions where diets rely more on byproducts and wheat, but less on corn and soymeal. Though the bonus often attributed to DDGS is likely to be real in much of the high plains, it is not real in many areas of beef production and should not be applied uniformly across the country. This issue deserves further study because it is likely that areas where DDGS have negative effects on poultry, swine, feedlot cattle and dairy cattle cancel much of the positive value seen for DDGS in feedlots on the high plains.
A recent study by Hazzledine et al. (2011) used similar cost optimization software as this current study for estimating wheat DDGS displacement ratios. Comparing the results of these studies is confounded by several factors: 1. Wheat DDGS differ from corn DDGS in having slightly higher levels of protein; 2. The feedstuffs available differ greatly between Great Britain (GB) and US; 3. The prices of high protein meals are considerably higher in GB than the US; and 4. The rate of production (growth, milk yield, egg yield) is lower in GB than the US and consequently nutrient requirements are also lower. Although it is likely that all of these factors contribute to the difference in the general profile of displacement ratios for wheat and corn DDGS, the largest factor is likely the high cost of protein meals in GB. In GB, protein dominates the cost of a diet whereas in the US, metabolizable energy is often the most expensive component. Thus in the US, DDGS displace predominantly high energy feeds like corn, whereas in GB DDGS displace a much greater proportion of high protein feedstuffs.
There are many other co-products from corn ethanol production including wet DGS, DDG, corn gluten feed, corn gluten meal, defatted-DDGS, etc. On a dry matter basis, wet DGS have a similar nutritional value as DDGS and are cheaper if transportation distances are short. Additionally wet DGS increase the palatability and feed intake of beef cattle when fed some types of diets and this results in faster growth. De-fatted DDGS can be fed at a much higher rate to dairy cows than conventional DDGS because the maximal inclusion rate of conventional DDGS is limited by the high level of polyunsaturated fatty acids. Currently DDGS is the dominant form fed but the alternative co-products are increasing and eventually should be considered in calculating the displacement ratios for the composite co-products of the corn-based ethanol industry.
Table 1. Regions used for calculating least-cost diets for each livestock type
Table 2. Broiler, grower-finisher diet without DDGS
Table 3. Summary of broiler grower-finisher diets with 0, 12.5 or 25% DDGS in the three major production regions1 .
Table 4. Summary of layer diets with 0, 10 or 20% DDGS in the three major production regions1
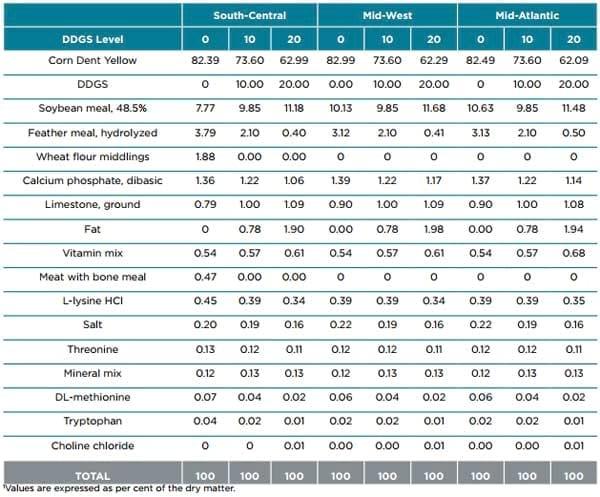
Table 5. Summary of turkey grower-finisher diets with 0, 10 or 20% DDGS in the three major production regions1.
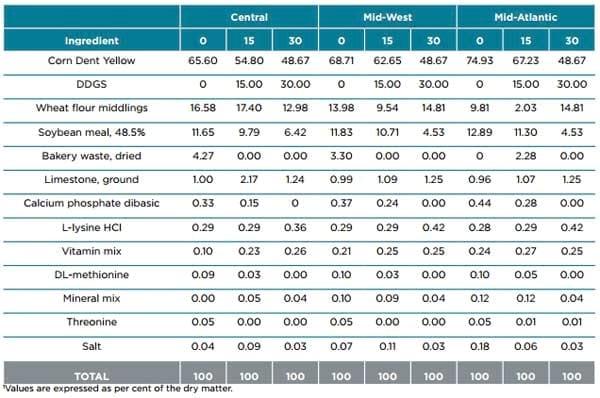
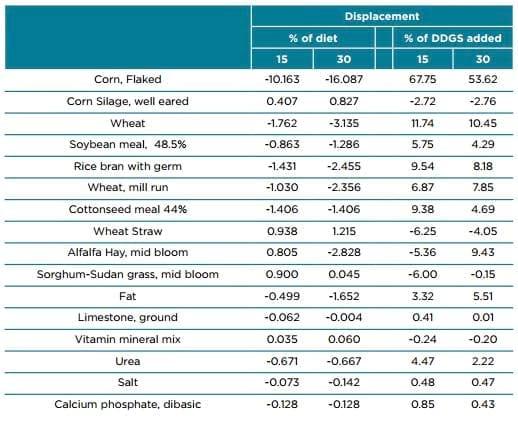
Table 6. Summary of swine grower-finisher diets with 0, 15 or 30% DDGS in the three major production regions1.
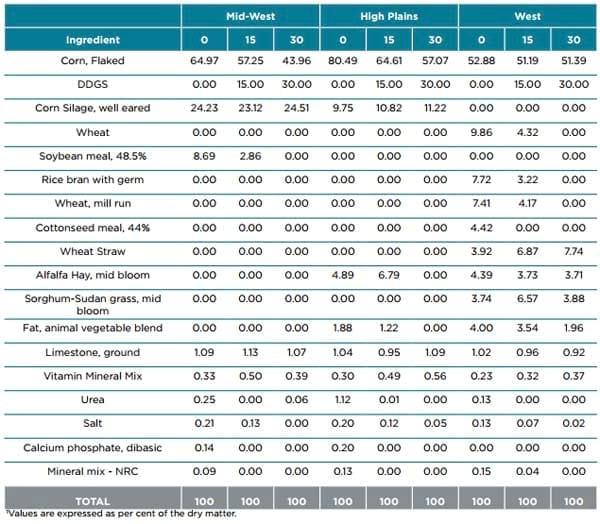
Table 7. Summary of beef diets with 0, 15 or 30% DDGS in the three major production regions1.
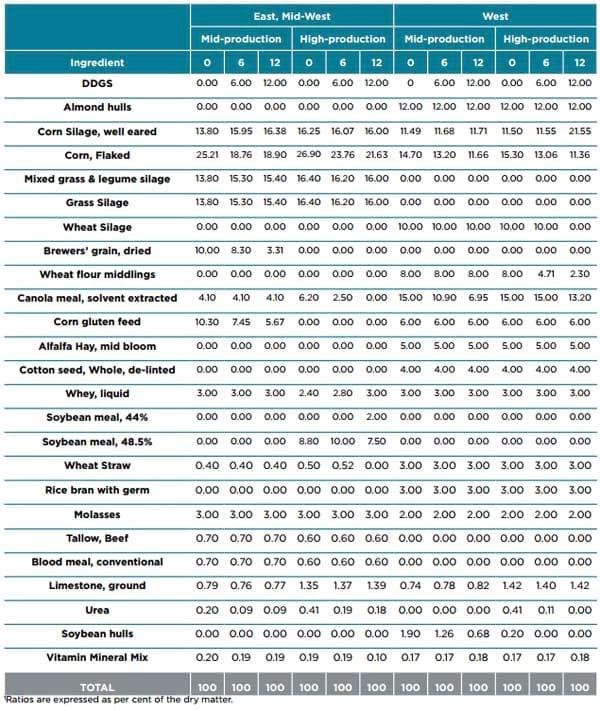
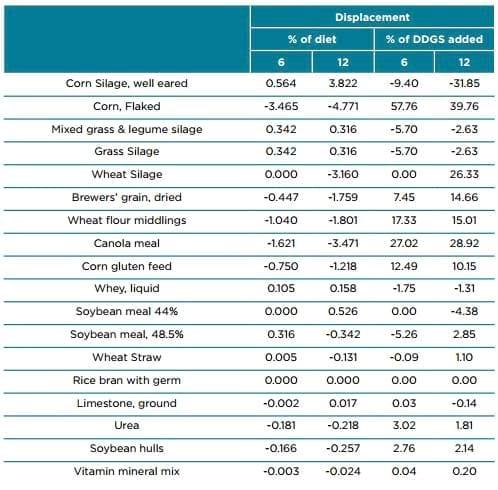
Table 8. Summary of dairy diets with 0, 6 or 12% DDGS in the three major production regions.
Table 9. Displacement values for adding either 12.5 or 25% DDGS to broiler diets in the major US growing regions.
Table 10. Displacement values for adding either 10 or 20% DDGS to layer diets in the major US growing regions
Table 11. Displacement values for adding either 10 or 20% DDGS to turkey diets in the major US growing regions.
Table 12. Displacement values for adding either 15 or 30% DDGS to swine diets in the major US growing regions
Table 13. Displacement values for adding either 15 or 30% DDGS to beef diets in the major US growing regions.
Table 14. Displacement values for adding either 6 or 12% DDGS to dairy diets in the major US growing regions.
Table 15. DDGS Usage (%) by species at current and at maximal inclusion rates.
Table 16. DDGS displacement ratios across all animal types*.
References:
Adeola, O., & Ileleji, K. E. (2009). Comparison of two diet types in the determination of metabolizable energy content of corn distillers dried grains with solubles for broiler chickens by the regression method. Poultry science, 88(3), 579-585. doi: 10.3382/ps.2008-00187.
Agricultural Software Consultants, Mixit-Win version 3. (2004). San Diego.
Almeida, F. N., Petersen, G. I., & Stein, H. H. (2011). Digestibility of amino acids in corn, corn coproducts, and bakery meal fed to growing pigs. Journal of animal science, 89(12), 4109-4115. doi: 10.2527/jas.2011-4143
Anderson, J. L., Schingoethe, D. J., Kalscheur, K. F., & Hippen, A. R. (2006). Evaluation of Dried and Wet Distillers Grains Included at Two Concentrations in the Diets of Lactating Dairy Cows. Journal of Dairy Science, 89(8), 3133–3142.
Arora, S., M., W., & Wang, M. (2010). Estimated displaced products and ratios of distillers' co-products from corn ethanol plants and the implications of lifecycle analysis. Biofuels, 1, 911-922.
Cromwell, G. L., Azain, M. J., Adeola, O., Baidoo, S. K., Carter, S. D., Crenshaw, T. D., . . . Shannon, M. C. (2011). Corn distillers dried grains with solubles in diets for growing-finishing pigs: a cooperative study. Journal of animal science, 89(9), 2801-2811. doi: 10.2527/jas.2010-3704
Donohue, M., & Cunningham, D. L. (2009). Effects of grain and oilseed prices on the costs of US poultry production. J. Appl. Poult. Res., 18, 325-337.
Ensminger, M. E., Oldfield, J. E., & Heinemann, W. W. (1990). Feeds & Nutrition. Clovis, CA: Ensminger publishing company.
Felix, T. L., Zerby, H. N., Moeller, S. J., & Loerch, S. C. (2011). Effects of increasing dried distillers grains with solubles on performance, carcass characteristics, and digestibility of feedlot lambs. Journal of animal science. doi: 10.2527/ jas.2011-4373
Hazzledine, M., Pine, A., Mackinson, I., Ratcliffe, J., & Salmon, L. (2011). Estimating Displacement Ratios of Wheat DDGS in Animal Feed Rations in Great Britain. Working Paper 2011-8, Washington DC: ICCT.
Hoffman, L. A., & Baker, A. (2011). Estimating the substitution of distillers grains for corn and soymeal in the U. S. Feed Complex. FDX-11-1-01.
Kim, E. J., Parsons, C. M., Srinivasan, R., & Singh, V. (2010). Nutritional composition, nitrogen-corrected true metabolizable energy, and amino acid digestibilities of new corn distillers dried grains with solubles produced by new fractionation processes. Poultry science, 89(1), 44-51. doi: 10.3382/ps.2009-00196
Kleinschmit, D. H., Schingoethe, D. J., Kalscheur, K. F., & Hippen, A. R. (2006). Evaluation of various sources of corn dried distillers grains plus solubles for lactating dairy cattle. Journal of Dairy Science, 89(12), 4784-4794. doi: 10.3168/jds.S0022-0302(06)72528-0
Klopfenstein, T. J., Erickson, G. E., & Bremer, V. R. (2007). Feeding corn milling byproducts to feedlot cattle. [Review]. The Veterinary clinics of North America. Food animal practice, 23(2), 223-245, vi. doi: 10.1016/j. cvfa.2007.05.005
Klopfenstein, T. J., Erickson, G. E., & Bremer, V. R. (2008). BOARD-INVITED REVIEW: Use of distillers by-products in the beef cattle feeding industry. Journal of animal science, 86(5), 1223-1231. doi: 10.2527/jas.2007-0550
Liu, K. (2011). Chemical composition of distillers grains, a review. [Review]. Journal of agricultural and food chemistry, 59(5), 1508-1526. doi: 10.1021/jf103512z
Lumpkins, B. S., Batal, A. B., & Dale, N. M. (2004). Evaluation of distillers dried grains with solubles as a feed ingredient for broilers. [Clinical Trial. Poultry science, 83(11), 1891-1896.
Masa'deh, M. K., Purdum, S. E., & Hanford, K. J. (2011). Dried distillers grains with solubles in laying hen diets. Poultry science, 90(9), 1960-1966. doi: 10.3382/ps.2010-01184
Oltjen, J. W., Dunbar, J. R., & Ahmadi, A. (2006). TAURUS. Davis: Department of Animal Science, University of California. Peter, C. M., Faulkner, D. B., Merchen, N. R., Parrett, D. F., Nash, T. G., & Dahlquist, J. M. (2000). The effects of corn milling coproducts on growth performance and diet digestibility by beef cattle. Journal of animal science, 78(1), 1-6.
Robinson, P. H., & Ahmadi, A. (2005). PCDAIRY WIN05. Davis: Department of Animal Science, University of California. Schingoethe, D. J., Kalscheur, K. F., Hippen, A. R., & Garcia, A. D. (2009). Invited review: The use of distillers products in dairy cattle diets. Journal of Dairy Science, 92(12), 5802-5813. doi: 10.3168/jds.2009-2549
Shim, M. Y., Pesti, G. M., Bakalli, R. I., Tillman, P. B., & Payne, R. L. (2011). Evaluation of corn distillers dried grains with solubles as an alternative ingredient for broilers. Poultry science, 90(2), 369-376. doi: 10.3382/ps.2010-00727
Stein, H. H., & Shurson, G. C. (2009). Board-invited review: the use and application of distillers dried grains with solubles in swine diets. Journal of animal science, 87(4), 1292-1303. doi: 10.2527/jas.2008-1290
Tedeschi, L. O., Kononoff, P. J., Karges, K., & Gibson, M. L. (2009). Effects of chemical composition variation on the dynamics of ruminal fermentation and biological value of corn milling (co)products. Journal of Dairy Science, 92(1), 401-413. doi: 10.3168/jds.2008-1141
U.S. Department of Agriculture, N. A. S. S. (June 29, 2007). Ethanol Co-Products Used for Livestock Feed, Sp Sy 6-1(6-07).
Whitney, M. H., Shurson, G. C., Johnston, L. J., Wulf, D. M., & Shanks, B. C. (2006). Growth performance and carcass characteristics of grower-finisher pigs fed high-quality corn distillers dried grain with solubles originating from a modern Midwestern ethanol plant. Journal of animal science, 84(12), 3356-3363. doi: 10.2527/jas.2006-099
Widmer, M. R., McGinnis, L. M., & Stein, H. H. (2007). Energy, phosphorus, and amino acid digestibility of high-protein distillers dried grains and corn germ fed to growing pigs. Journal of animal science, 85(11), 2994-3003. doi: 10.2527/ jas.2006-840


.jpg&w=3840&q=75)