Implications
Fluctuations in the milk fat market are driving demands from farmers for ways to control milk fat production and composition in dairy cows. The current models used to estimate dairy cow requirements and formulate diets cannot predict changes in milk fat. These models are based on energy and protein intake and do not consider the pattern of individual nutrients derived from digestion. Using published infusion studies, this meta-analysis quantifies and compares the effects on milk fat secretion of several nutrients derived from digestion. It is a first step toward a model to estimate variations in milk fat based on variations in nutrient supply.
Introduction
The modulation of milk fat production is a concern for dairy farmers wanting to adapt to market demands, and has long been studied by ruminant physiologists. Dietary modifications are a simple way to modulate milk fat concentration (MFC) and yield (MFY), as these effects are rapid (e.g. Roy et al., 2006) and reversible. Milk fat depression (MFD) is an extreme example of nutritional modulation of milk fat, with reductions in MFC of up to 50% (Bauman and Griinari, 2001). In the last 50 years, several theories have been advanced to explain this phenomenon (reviewed in Bauman and Griinari, 2001 and 2003). Currently, the mainstream theory is the biohydrogenation theory: diets inducing MFD cause a change in ruminal lipid metabolism, leading to an increased formation of specific trans fatty acids (FA) that - inhibit lipid synthesis in the mammary gland (Bauman and Griinari, 2001). Using abomasal or duodenal infusions, it has been shown that the isomer t10,c12-conjugated linoleic acid (CLA) and a few other CLA isomers are indeed inhibitors of mammary lipogenesis (Bauman and Griinari, 2003; Shingfield and Griinari, 2007; Harvatine et al., 2009). However, most authors acknowledge that the quantities of these isomers produced in vivo in the rumen are insufficient to fully explain the milk fat reductions observed during MFD (Roy et al., 2006; reviews in Harvatine et al., 2009; Shingfield and Griinari, 2007). Two explanations have been suggested: either there are additional FA isomers (still unidentified) that inhibit milk fat secretion and contribute to MFD (Shingfield and Griinari, 2007; Harvatine et al., 2009; Shingfield et al., 2010), or other nutrients or mechanisms are also involved in MFD (Shingfield et al., 2010), as the diets inducing MFD generally disrupt the ruminal fermentation process and thereby alter the supplies of numerous nutrients to the cows.
With this second hypothesis in mind, the aim of this study was to quantify the effects of several nutrients derived from digestion on MFC and MFY, in order to assess whether they could have a significant effect on MFD. A preliminary study had been conducted by Rulquin et al. (2007) on the overall effects of energy nutrients on MFC and MFY. This study refines and extends their study, both on the nutrients and variables studied. If the responses of MFC and MFY to these nutrients were determined, they could be used to estimate milk fat changes after dietary modifications, provided that the changes in nutrient supply following dietary modifications can be predicted.
To study the effects of changes in one nutrient without interference from the others, we looked at studies using digestive infusions of nutrients. The response equations were generated by a meta-analysis run from these studies, and the putative interfering factors (stage of lactation, experimental procedures, diet composition, initial milk fat, etc.) on these equations were systematically explored. When enough data were available, we also studied the responses of the milk FA composition to changes in the supply of these nutrients. We established the equations describing the response of milk fat to changes in the supply of seven nutrients derived from digestion for which enough published infusion studies were available: the volatile FA (VFA; acetic (C2), propionic (C3) and butyric (C4) acids), glucose, t10,c12- CLA, long-chain FA (LCFA) and proteins.
Material and methods
Data inclusion
A database was compiled from published studies on dairy cows, reporting the individual effects of seven nutrients derived from digestion: C2, C3, C4, glucose, t10,c12-CLA, LCFA and proteins. Studies were included in the database only when they met two criteria: (i) they used continuous ruminal infusions of individual VFA, duodenal infusions of glucose, proteins, animal or plant lipids (for LCFA) and t10,c12-CLA and (ii) they included a control treatment (unsupplemented). For t10,c12-CLA experiments, the lipid supplement was pure t10,c12-CLA or a FA mixture, but only studies with at least 30% of t10,c12-CLA in the FA mixture supplement were selected. The sources of infused proteins were casein (80% of the experiments) or plant proteins (soy or cotton, 20% of the experiments). Infusions with only one or a few amino acids (AA) were not included, as they could induce an AA imbalance. The lipids infused in the LCFA studies were high-oleic sunflower oil (n 53), rapeseed oil (n 52), pure FA (n 55), tallow (n 52), olive oil (n 52) and other plant oils (n 52).
From these published studies, we then excluded the experimental treatments for which the amount of nutrients supplied was outside the range of physiological variations, in order to study only those modifications in milk fat secretion that were similar to those induced by dietary changes. The supply of quantities higher than physiological could trigger different biological mechanisms and therefore not be relevant for nutritional applications. The upper limits for the amount supplied were estimated from publications studying changes in nutrients supply following dietary changes. They were set at 1600 g/day for C2, 1000 g/day for C3 and 800 g/day for C4 (values from a database of measured VFA productions, Nozie` re et al., 2007); 800 g/day for proteins (Ipharraguerre et al., 2005), 1000 g/day for lipids (Christensen et al., 1998) and 5 g/day for t10,c12-CLA. Although the highest reported in vivo t10,c12-CLA flows at the duodenum do not exceed 1.5 g/day (reviewed in Shingfield and Griinari, 2007), infusions up to 5 g/day of t10,c12-CLA were selected to have a sufficient number of data (only one publication was available with ,1.5 g/day). For the effects of LCFA on milk fat, we used duodenal infusions of animal or plant lipids and excluded treatments with a change in dry matter (DM) intake higher than 1 kg/day following infusions, in order to avoid large changes in the supply of the other nutrients. The maximal change for duodenal glucose was set up at 1500 g/day (estimated from a maximal duodenal starch change of 2.6 kg/day (Overton et al., 1995) and a small intestine starch digestibility of 60%).
There were 9, 11, 3, 14, 7, 8 and 10 publications for C2, C3, C4, glucose, proteins, LCFA and t10,c12-CLA (list in supplementary material).
Databases and statistical analyses
The database was divided into seven sub-databases, one for each nutrient studied. In each sub-database, data were encoded according to studies. Descriptive statistics (the mean, s.d. and ranges of values) were generated for the main characteristics of the studies in each nutrient sub-database, together with the correlations between these characteristics. The differences between sub-databases concerning these characteristics were tested with GLM models.
We had two options for data statistical analysis: either study the absolute values of MFC and MFY before and after the infusions, using mixed models (St-Pierre, 2001); or study the response of MFC and MFY to the infusions. With a view to study the milk fat responses to dietary modifications, we chose to focus on the responses to the nutrient infusions.
The response to the infusions was thus chosen as the dependent variable and was calculated from the MFC and MFY of the infused cows and those of their respective controls. Thus, MFC and MFY responses were given by:
However, for comparison purposes, we also run mixed models on the raw data (with study as a random effect, as recommended by St-Pierre, 2001).
The amount of nutrients supplied was expressed in kilograms per day, except for t10,c12-CLA, which was expressed in grams per day. It was not possible to express the amount of nutrients supplied relative to intake or body weight (BW), as several publications did not report BW or DM intake. No data on milk FA composition were available in the C2 and C4 sub-databases, which prevented us from determining the effects of these two nutrients on the milk FA composition. For lipid infusions, the resulting milk FA composition is directly dependent on the composition of the lipids infused, and thus is meaningless when averaged over different lipid sources. For this reason, milk FA responses are not reported for LCFA supplies. The percentages of 18:3 or odd-chain FA in milk were often unreported and therefore could not be studied for all the nutrients. In addition, because of the heterogeneity among studies in how milk FA were reported, certain data had to be reconciled, especially for C18 FA. Thus, for 18:1, 18:2 and 18:3, the values used were either reported overall values or the sums of the corresponding isomers when more detailed FA compositions were provided.
For each study, we thus had a response in MFC and MFY (Y), an amount of nutrient infused (X), and several variables describing the animals, diets, experimental design, etc. used in the study. Statistical analyses (GLM models in Minitab�R Statistical Software, version 15 – Minitab Inc., 2007) were performed in two steps. First, the relationships between Y (responses of MFC, MFY or milk FA percentage) and the explanatory variable X (amount of the nutrient supplied) were studied with GLM models without intercept: Y5b3X, where b is the slope of the relationship. Quadratic models were also tested and compared with the linear models. The normality of the residuals was verified using the Shapiro– Will test. Outliers were identified on the basis of residuals, HI leverage and Cook's distance. Graphical examinations were also used at each stage of the meta-analysis process to check that the statistical results were not distorted by some extreme data.
Second, the residuals of these models were regressed on the other variables describing the study, the major potential quantitative interfering factors. The interfering factors are variables that could modify the mean responses to the nutrient supplied. The tested interfering factors were variables describing animals (BW, DM intake (DMI), stage of lactation, milk yield (MY), milk protein and lactose concentrations, etc.), diet composition (proportion of concentrates, dietary concentrations of protein, fat and NDF, etc.), duration of the experimental period, MFC and MFY of the respective control treatment (MFCcontrol and MFYcontrol ) and milk FA percentage of the control treatment (%FAcontrol ). For qualitative interfering factors, ANOVA were run on the residuals to test for the influence of breed, addition of buffers (only for VFA infusion), main forage, type of infusions (isoenergetic or not), CLA supplement form (pure FA or FA mixture) and type of proteins infused (form of casein or plant protein). When a significant interfering factor was detected on the residuals, it was included as an additional variable in the model, in order to establish whether its inclusion improved or not the residual mean square errors (RMSE) and the adjusted R2 (R2adj).
We also run mixed models on the raw data, using the 'Mixed' procedure of SAS (Statistical Analysis Systems Institute, 2000), with study as a random effect. In these models, the nutrient supplies for the control treatments were set up at zero (they were neither reported nor calculable from the publications).
All model parameters and correlations were considered significant at P ,0.05, whereas P ,0.10 indicated a trend.
Results
Meta-design and description of the sub-databases
All the experiments investigated the effects of the nutrient infusions on MY and composition. Within an experiment, diet and dietary parameters (proportion of concentrates, type of forage, crude protein and NDF concentration) were similar between treatments. Most of the experiments were designed as Latin squares (79% of the designs) and used Holstein cows (77% of the experiments). In all the experiments, cows were milked twice daily. On average, milk composition was determined on 5 days or on 10 consecutive milkings.
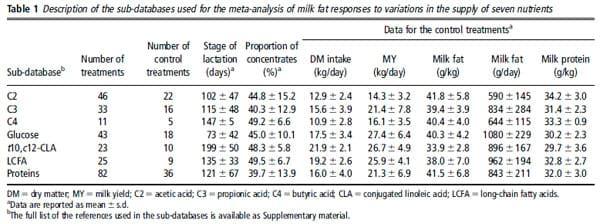
Table 1 presents, for each nutrient sub-database, the means and the s.d. of the main characteristics of the control treatments. The proportion of concentrates in the diet was on average 43.9% with no difference between the sub-databases. The stage of lactation differed between subdatabases: the cows used for glucose studies were in early lactation (73 days); for VFA, LCFA and protein studies, they were in mid-lactation and for t10,c12-CLA in late lactation (199 days). The duration of treatments ranged from 4 to 28 days; the experimental periods for t10,c12-CLA studies were significantly shorter (6 days on average) than for the other nutrients (12 to 20 days on average). The DMI, MYand MFY of the control treatments differed between the subdatabases: they were lower in the C2 and C4 sub-databases than for the other nutrients. This is presumably due to the earlier dates of publication for these two nutrients (mostly before 1975). Control MFC was about 40.0 g/kg milk for the VFA, glucose, LCFA and protein studies, but was significantly lower for the t10,c12-CLA sub-database (33.9 g/kg). These differences also appeared in the intercepts of the mixed models (Table A in Supplementary material).
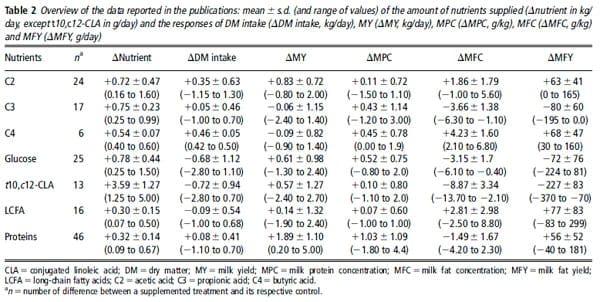
Table 2 presents, for each nutrient, the means, the s.d. and ranges of the amounts of nutrient supplied and the responses of DMI, MY, milk protein concentration, MFC and MFY reported in the publications. The amount of nutrients supplied was well distributed over the ranges studied, except for the C3 and t10,c12-CLA sub-databases in which there were few responses with small quantities supplied. Only six data were available for C4.
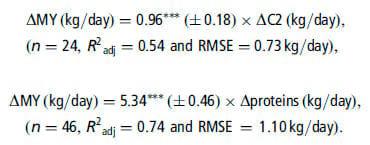
C2 and protein infusions significantly increased MY:
The other nutrients did not modify the MY. Milk protein concentration increased with protein infusions (12.97 g/kg per kg of added protein, P ,0.001, n 546 and RMSE5 1.07 g/kg) and glucose infusions (10.77 g/kg per kg of added glucose, P ,0.001, n 523 and RMSE5 0.57 g/kg).
Milk fat responses to the nutrients
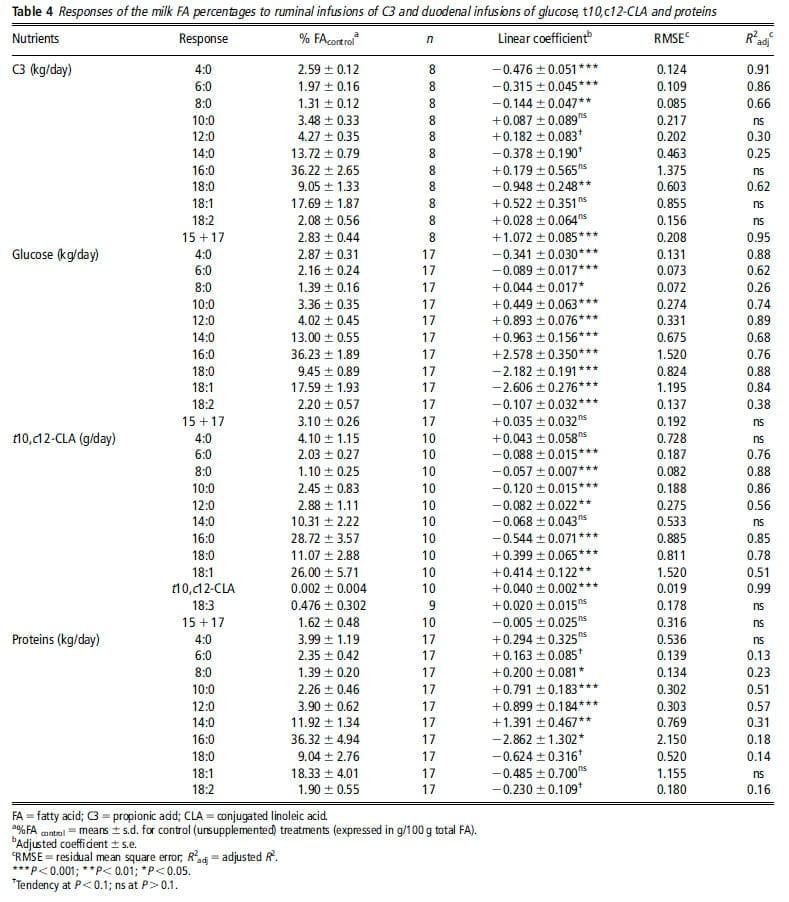
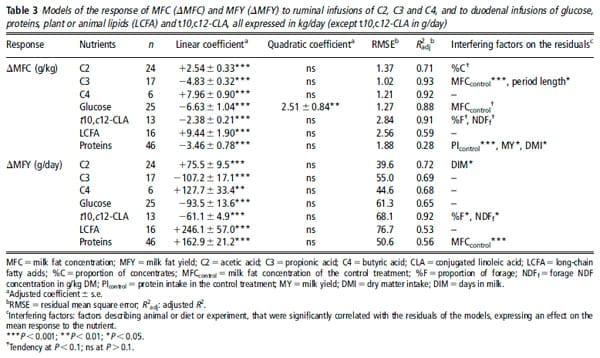
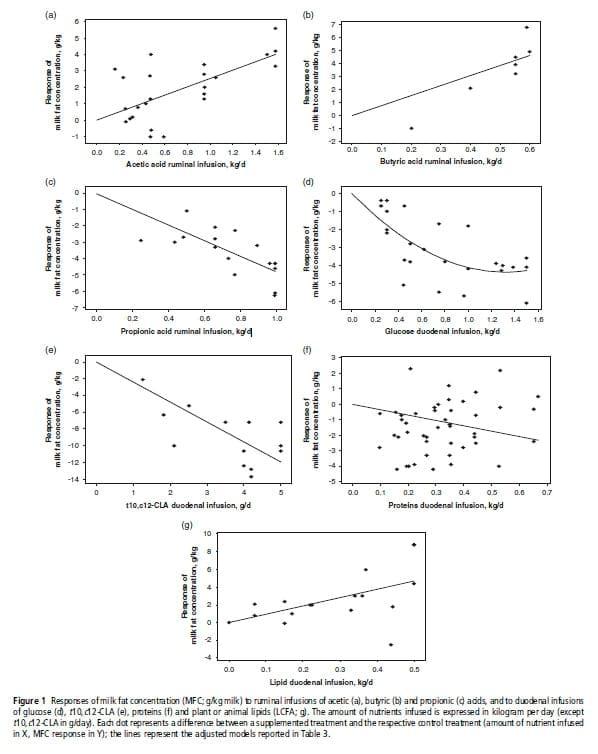
Table 3 presents, for each nutrient, the adjusted models of the MFC and MFY responses, R2adj and RMSE, and indicates the number of data used and the significant interfering factors. Very few outliers were excluded (one each in the C2, C4 and glucose sub-databases). Figure 1 presents the individual responses (within-study differences) and the adjusted models of MFC responses to the supply of each nutrient. The models of absolute values of MFC and MFY following nutrient infusions, adjusted with mixed models (random study effect), are provided in Table A in Supplementary material. The linear coefficients adjusted with these models were very similar to those of the responses to infusions (Table 3), and accordingly only the response of MFC to glucose presented a significant quadratic coefficient. However, the RMSE of the mixed models were lower than those of the within-experiment responses. Table 4 shows the adjusted models of the responses of the milk FA percentages.
Responses to C2 and C4. The ruminal infusions of C2 and C4 significantly increased MFC and MFY. The effects of C4 on MFC and MFY were higher than those of C2 (on a kg/day basis). The MFC response models presented no significant interfering factors on the residuals. However, the proportion of concentrates in the diet tended to increase the response of MFC to C2 (P 50.08, 10.036 g/kg per kg of C2, for each % concentrate). The stage of lactation had a slight effect on the residuals of the MFY response to C2 (P 50.05): the cows in late lactation tended to have a lower response.
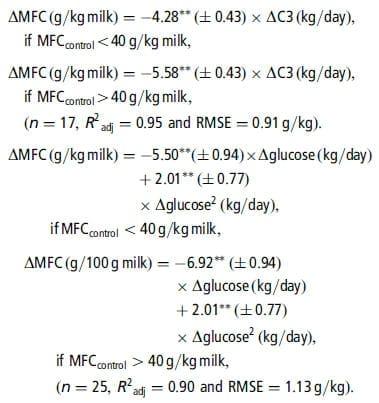
Responses to C3 and glucose. The infusions of C3 and glucose decreased MFC and MFY (P ,0.001). These reductions were linear except for the MFC response to glucose, which was curvilinear. The MFC response to glucose was linear up to 1.0 kg/day with a mean slope of 24.7 g/kg per kg of added glucose. The MFCcontrol had an effect on the residuals of the MFC models (C3: P 50.004; glucose: P 50.09): the reduction in MFC was higher when MFCcontrol was high (i.e. .40.0 g/kg milk). We thus adjusted a new model with two response coefficients to these nutrients, which improved the RMSE values and R2adj.
The length of the experimental period also had an effect on the residuals of the MFC response to C3 (P 50.031): the reduction in MFC response with C3 was lower for the longer periods.
The effects of the two nutrients on milk FA composition were different. C3 decreased or tended to decrease the percentage of several even-chain FA (4:0, 6:0, 8:0, 12:0, 14:0 and 18:0, P ,0.1, n 58), whereas glucose decreased the percentage of short-chain FA (SCFA; 4:0 and 6:0, P ,0.001, n 517) and LCFA (all C18, P ,0.001, n 517) and increased the percentage of medium-chain FA (MCFA; 10:0 to 16:0, P ,0.05, n 517). C3 increased the percentage of the odd-chain FA (11.07% of C151C17 per kg/day of C3, P ,0.001, n 58), but glucose did not alter them. No interfering factors had an effect on the milk FA responses to C3. The responses of 4:0, 14:0, 16:0 and C18 FA to glucose were influenced by their percentage with the control treatment (P ,0.05). The increases were higher when the initial percentage was low, and conversely, the reductions were higher when the initial percentage was high.
Response to LCFA. The infusions of animal or plant lipids linearly increased MFC and MFY. These models had higher RMSE and lower adjusted R2 compared with the VFA, glucose and CLA models. No significant interfering factor was identified on the MFC and MFY response models.
Response to t10,c12-CLA. The MFC and MFY decreased linearly with t10,c12-CLA infusions (up to 5 g/day). No interfering factors had a significant effect on the residuals of the MFC response. However, a high proportion of forage (P 50.084,20.25 g/kg per %forage) and a high forage NDF concentration (P 50.082, 20.04 g/kg per g/kg DM) tended to promote the decrease in MFC caused by t10,c12-CLA. Similarly, the proportion of forage (P 50.012, n 512) and the forage NDF concentration (P 50.021, n 512) had a significant effect on the residuals of the MFY response. However, these two variables were not significant when introduced as covariables in the initial model. The infusions of t10,c12-CLA significantly decreased the percentage of all de novo synthesized FA (P ,0.01, n 510) except for 4:0 and 14:0, and increased the percentage of the preformed FA (18:0 and 18:1, P ,0.001, n 510). The percentage of milk t10,c12-CLA increased linearly with t10,c12-CLA infusions, by 0.04% per gram of t10,c12-CLA infused. No interfering factors influenced the milk FA responses to t10,c12-CLA.
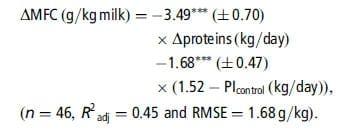
Response to proteins. The duodenal infusions of proteins increased MFY and decreased MFC. Although these models were significant, they had low R2adj, which were 56% and 28%, respectively. Several interfering factors had a significant effect on the residuals of MFC response: the amount of protein intake of control treatment (PIcontrol, P ,0.001), DM intake (P 50.016) and MY (P 50.014). The reduction in MFC was lower for high PIcontrol, MY or DM intake. All these factors were correlated (P ,0.05). Inclusion of PIcontrol as a covariate in the model (centered on the overall mean 1.52 kg/day) was the model that best improved RMSE and R2adj:
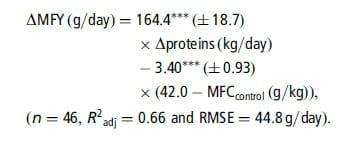
The MFY response to proteins was affected by MFCcontrol (P ,0.001): the increase in MFY was lower for the low MFCcontrol. Inclusion of the MFCcontrol as a covariable in the model (centered on the overall mean of 42.0 g/kg milk) improved the RMSE and R2:
The percentage of SCFA and MCFA increased or tended to increase (6:0 to 14:0, P ,0.1) with protein infusions, whereas the percentage of 16:0, 18:0 and 18:2 tended to decrease. However, these models explained ,50% of the observed variability in the milk FA composition.
Discussion
Individual effects of the nutrients on milk fat
This study provides equations to estimate the responses of milk fat production and composition to changes in the supply of seven nutrients derived from digestion: C2, C4, C3, glucose, t10,c12-CLA, protein and LCFA. Very few interfering factors had a significant effect on the residuals. The RMSE of the models were similar to the inherent variability of milk fat measurements: they were lower than the day-to-day variations in milk fat measured in vivo (Syrstad, 1977; Forsback et al., 2010) and were similar to the residual variations (r.s.d.) calculated from the publications included in the database (the r.s.d. were calculated from the s.e.m. reported in the publications and the number of animals in the experimental groups): between 1.21 and 7.8 g/kg for MFC, and between 35 and 360 g/day for MFY. The nutrients differed in their effects on MFC and MFY.
Ruminal infusions of C2 and C4 linearly increased MFC and MFY. This positive effect of C2 and C4 stems from their role of substrate for the mammary FA synthesis (Bauman and Davis, 1974; Barber et al., 1997). Our models showed that the effects of C2 on milk fat secretion were lower than those of C4. This finding could be explained by the specific role of b-hydroxybutyrate (synthesized from C4) as a precursor to initiate de novo FA elongation (Palmquist et al., 1969; McCarthy and Smith, 1972). However, the effect of C2 on MFC could be slightly underestimated because C2 significantly increased MY (dilution effect), unlike C4. In the database, most C2 infusions represented an energy supplement compared with the controls, which could explain this increase in MY. Owing to a lack of published data, the milk FA composition responses to C2 and C4 could not be quantified. However, Storry and Rook (1965) observed an increase in the percentage of all FA from 4:0 to 16:0 and a decrease in C18 FA after ruminal infusions of C2 and C4.
C3 and glucose infusions decreased MFC and MFY. The observed milk fat reduction used to be explained by an increase in insulin secretion, causing FA to be preferentially used by adipose tissues rather than the mammary gland (review in Bauman and Griinari, 2001). However, experiments using hyperinsulinemic–euglycemic clamps (Griinari et al., 1997; Corl et al., 2006) showed that insulin could not be fully responsible for the observed milk fat reduction. Thus, the mechanisms involved in milk fat reduction with C3 and glucose remain unclear, but seem to differ, as the resulting milk FA compositions are different. The reduction in milk fat with glucose is mainly due to a decrease in the yield of LCFA, whereas with C3 the reduction in milk fat is associated with a decrease in the yield of all even-chain FA. Both nutrients decreased the plasma concentrations of milk fat precursors: C2, b-hydroxybutyrate, non-esterified FA and total glycerides (Rigout et al., 2003; Lemosquet et al., 2009a). Hurtaud et al. (1998) and Rigout et al. (2002) proposed that the reduction in LCFA with glucose could also be due to a specific inhibiting effect of glucose on adipose tissues mobilization, leading to a lower contribution of LCFA to milk fat, or a decrease in lipoprotein lipase activity and mammary FA esterification. The responses of MFC to C3 and glucose were dependent on MFCcontrol: the reductions were lower when MFCcontrol was low. In our database, the low MFCcontrol values were associated with starch-rich diets, which induced high digestive flows of C3 or glucose, and possibly FA biohydrogenation products. The effects of C3 and glucose may thus be saturable: less effect would be observed with diets inducing high digestive flows of these nutrients.
To estimate the positive effects of LCFA on milk fat (LCFA are a substrate for milk fat synthesis), we used duodenal infusions of animal and plant lipids, in order to avoid the effects of dietary lipids on rumen fermentations. The responses of MFC and MFY were the highest of the nutrients studied: 19.4 g/kg and 1246.1 g/day per kg, respectively, of added lipids. In a preliminary study of dietary protected tallow supplementation (as a proxy of LCFA supply, data not shown), the responses were significantly lower than those of duodenal infusions (14.35 g/kg and 1159.2 g/day per kg/day, respectively, of added tallow for MFC and MFY). The figures for duodenal infusions are also much higher than what is reported for dietary plant lipid supplementation (e.g. Glasser et al., 2008). The higher responses found in this study probably result from the fact that duodenal infusions avoid the detrimental effects of dietary lipids on rumen fermentations, diet digestibility and milk fat synthesis (through the production of trans FA in the rumen) and also from the selection of infusion studies in which lipid infusions did not depress DMI to a large extent. The intestinal absorption of the lipids infused (mainly as triglycerides) was probably not limiting in this data set, given the magnitude of the response. Moreover, most lipid sources used in the subdatabase were rich in saturated and cis monounsaturated FA, which are highly incorporated in milk lipids (unlike some trans or polyunsaturated FA that can inhibit mammary lipogenesis). These responses obtained with duodenal infusions thus correspond to a maximum positive effect of LCFA supply on milk fat synthesis (which was our objective), without the side effects observed with diet supplementation (decrease in DMI and sometimes diet digestibility, rumen production of FA biohydrogenation isomers that inhibit mammary lipogenesis, etc.). The data set used was relatively limited, and did not enable a detailed study of interfering factors. The stage of lactation, for example, is known to have an effect on the response to lipid infusion, cows in early lactation being less responsive to lipid supplementation (Gagliostro and Chilliard, 1991). The effects of lipid supplements on milk FA composition have been extensively reviewed (e. g. Chilliard et al., 2001 and 2007). They generally increase the percentage of C18 FA in milk and decrease the SCFA and MCFA. The reduction in de novo synthesized FA could be linked to an inhibition of de novo synthesis by LCFA (Barber et al., 1997) or a substitution of the SCFA and MCFA by LCFA on milk triglycerides (Hansen and Knudsen, 1987). Within this general frame, their precise effects depend on the source and presentation of the supplement, and will not be detailed here.
Duodenal infusions of t10,c12-CLA linearly decreased MFC and MFY. This isomer is naturally present in duodenal contents, but in low amounts (in vivo data do not exceed 1.5 g/day, Shingfield and Griinari, 2007). It is considered as one of the isomers responsible for diet-induced MFD, and the only one for which extensive data are available (Shingfield et al., 2010). De Veth et al. (2004) and Shingfield and Griinari (2007) found an exponential decay model to describe the relationship between the changes in MFY and the duodenal infusions of t10,c12-CLA. However, these authors included very high doses of t10,c12-CLA in their models (i.e. .5g/day). In this study, the highest doses of t10,c12-CLA were excluded and the relationships were linear, and thus are likely applicable to the range of values of duodenal flows measured in vivo. The t10,c12-CLA infusions reduced the secretion of all FA, the reduction being generally greater for the de novo synthesized FA. Several recent publications (Harvatine and Bauman, 2006; Gervais et al., 2009) have shown that t10,c12-CLA decreases milk fat through a transcriptional downregulation of enzymes and proteins involved in mammary lipid synthesis (see also Shingfield et al., 2010).
Duodenal infusion of proteins increased MFY and decreased MFC. We are not aware of any meta-analysis on the effects of dietary protein intake on milk fat, which could be used for comparison. The supply of proteins increased mammary lipid synthesis, but this increase was proportionally smaller than the increase in MY, so that MFY increased, whereas MFC decreased. The mechanism explaining the increase in milk fat synthesis after protein supplementation is unclear. Proteins seem to stimulate the de novo FA synthesis, as suggested by the increase in the percentages of SCFA and MCFA (and the consecutive decrease in LCFA percentages). This increase in SCFA and MCFA could be linked to an increase in arterial concentrations or extraction rates of some mammary FA synthesis precursors (C2 and non-esterified FA: Guinard et al., 1994; b-hydroxybutyrate: Vanhatalo et al., 2003; Lemosquet et al., 2009b). The hypothesis of dietary protein stimulating lipomobilization is not consistent with the observed decrease in LCFA percentages. The models of milk fat responses to proteins showed the lowest R2adj and were influenced by numerous interfering factors in comparison with the other nutrients. This underlines the fact that proteins have only an indirect effect on milk fat secretion.
Compared effects of the nutrients on milk fat
The data used to establish the response equations were different between nutrient sub-databases. However, we checked many putative interfering factors (including animal, diet and other experimental characteristics), and included them in the models when they were significant. This, plus the fact that the models are based on within-experiment responses, ensures that our models are generic. Thus, it is coherent to compare the responses between nutrients, or even use them together if necessary. However, it is not relevant to compare directly the coefficients of the response models, because the in vivo flows of the nutrients differ greatly. To compare their potential in vivo effects following dietary changes, the equations had to be adjusted to the digestive flows of each nutrient. To this end, the maximal changes of these flows following dietary changes were estimated from published experiments studying the changes in nutrient production: 1.5 kg/day for C2, 1.0 kg/day for C3, 0.5 kg/day for C4, 1.5 kg/day for glucose, 0.8 kg/day for proteins, 1.5 g/day for CLA and 1.0 kg/day for LCFA. By applying our response equations to these maximal changes in digestive flows, the maximal responses of MFC (in g/kg milk) would be13.8 for C2,24.8 for C3,14.0 for C4, 24.3 for glucose, 22.7 for proteins, 23.6 for t10,c12-CLA and 19.4 for LCFA, respectively. These maximal effects are moderate (all lower than 5 g/kg except for LCFA, when reductions up to 15 g/kg are observed following dietary changes). Proteins have the lowest effect, consistent with an indirect effect of proteins on milk fat. These results imply that none of these nutrients alone can fully explain MFD. Hence, several of these nutrients must be contributing simultaneously to the changes in milk fat observed following dietary changes, or additional nutrients must also be acting, or there are some synergistic interactions between nutrients (or some combination of these mechanisms).
Potential effect of additional nutrients
Some other nutrients, not studied here, could be involved in milk fat changes after dietary modification. Two other CLA isomers have been identified as inhibitors of milk fat synthesis in dairy cows: t9,c11-CLA, with less potent effects than t10,c12-CLA (Perfield et al., 2007); possibly c10,t12-CLA (Saebø et al., 2005), but with indirect proofs and despite any increase of this isomer with MFD diets (Shingfield et al., 2010). These two CLA isomers have been examined in only one study at one dose and therefore their effects remain to be confirmed.
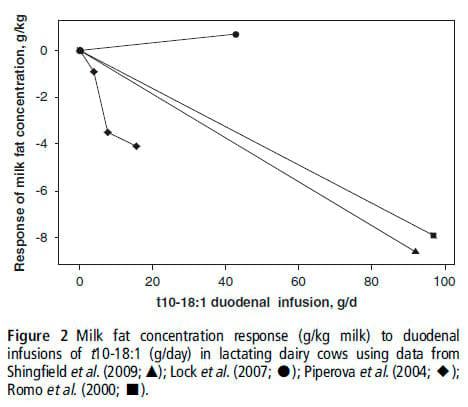
The inhibiting role of some trans-18:1 isomers is also suspected, but it has not been thoroughly studied owing to the technical difficulty of obtaining pure preparations of these isomers. Among these trans FA, some authors have suggested that t10-18:1 was the most probable candidate responsible for the inhibitory effects on milk fat synthesis (Griinari et al., 1998; Piperova et al., 2004, Roy et al., 2006). Only four infusion studies are available for t10-18:1, and they report inconsistent effects (Figure 2 shows the relationship between the changes in MFC and the amount of t10-18:1 infused): the postruminal infusion of a relatively pure (95%) t10-18:1 preparation (Lock et al., 2007) had no effect on MFC and MFY; the other experiments (Romo et al., 2000; Piperova et al., 2004; Shingfield et al., 2009) observed a reduction in milk fat secretion. However, these three experiments used FA mixtures in which t10-18:1 represented only between 9% to 37% of the total FA supplied. The effect of t61718-18:1 has been suspected in cows (Kadegowda et al., 2008) and an inhibition of mammary lipogenesis by t7-18:1 has been recently shown in mice (Kadegowda et al., 2010). The isomers t61718-18:1 are present in the FA mixtures used by Piperova et al. (2004) and Romo et al. (2000) and could contribute to the observed inhibition. Further studies are required to confirm the putative effects of t10-18:1 and t61718-18:1 on milk fat synthesis.
Correlations between individual milk FA and MFC suggest that several other trans or CLA isomers may be involved in MFD (Loor et al., 2005; Roy et al., 2006; Kadegowda et al., 2008). However, their direct effects on milk fat secretion remain to be established.
Interactions between the nutrients
This study quantified the individual effects of nutrients on milk fat secretion. However, these nutrients vary simultaneously after dietary changes. They have a combined action on milk fat synthesis and it is not known whether they have additive or interactive effects. There are very few reports of simultaneous infusions of several of these nutrients into dairy cows. Rook et al. (1965) studied, in the same experimentation, the effects of VFA infused separately or simultaneously into dairy cows. Their results show that the effects of C2, C3 and C4 on MFC and MFY are additive. Maxin et al. (2010) also observed additive effects of C3 and t10,c12-CLA on milk fat and FA concentration and yield. The linearity of the responses to each nutrient (except for glucose) also reflects a form of 'additivity' of the amounts supplied within each nutrient. If these findings were validated for other nutrients, they could be used to estimate the total milk fat changes following dietary modification, based on the additivity of the effects of the nutrients.
Conclusions and perspectives
This study gives equations to estimate milk fat production and composition responses to changes in the supply of seven nutrients derived from digestion. Very few interfering factors had a significant effect on residuals and RMSE were similar to the inherent variability in the in vivo measurement of milk fat. In addition, data are very scarce or old for C2 and C4: more recent data, if they were available, would help to improve the models. This study is a first step toward predicting overall milk fat responses to dietary changes, provided that the changes in nutrient supply following dietarymodifications can be predicted.
Acknowledgments
The authors thank L. Delaby, C. Hurtaud, J. L. Peyraud, F. Garreau and T. Aubert for their help. They also thank Arrive´, BNA Nutrition Animale, CCPA, Evialis, Inzo, Glon-Sanders, Primex, Provimi France, as well as the ANRT (Association Nationale de la Recherche et la Technologie) for financial support of this research in the form of a doctoral fellowship for G. Maxin.
References
Barber MC, Clegg RA, Travers MTand Vernon RG 1997. Lipid metabolism in the lactating mammary gland. Biochimica et Biophysica Acta (BBA) – Lipids and Lipid Metabolism 1347, 101–126.
Bauman DE and Davis CL 1974. Biosynthesis of milk fat. In Lactation, a comprehensive treatise (ed. BL Larson and VR Smith), vol. 2, pp. 31–75. Academic Press, New York, USA.
Bauman DE and Griinari JM 2001. Regulation and nutritional manipulation of milk fat: low-fat milk syndrome. Livestock Production Science 70, 15–29.
Bauman DE and Griinari JM 2003. Nutritional regulation of milk fat synthesis. Annual Review of Nutrition 23, 203–227.
Chilliard Y, Ferlay A and Doreau M 2001. Effect of different types of forages, animal fat or marine oils in cow's diet on milk fat secretion and composition, especially conjugated linoleic acid (CLA) and polyunsaturated fatty acids. Livestock Production Science 70, 31–48.
Chilliard Y, Glasser F, Ferlay A, Bernard L, Rouel J and Doreau M 2007. Diet, rumen biohydrogenation and nutritional quality of cow and goat milk fat. European Journal of Lipid Science and Technology 109, 828–855.
Christensen RA, Clark JH, Drackley JK and Blum SA 1998. Fatty acid flow to the duodenum and in milk from cows fed diets that contained fat and nicotinic acid. Journal of Dairy Science 81, 1078–1088.
Corl BA, Butler ST, Butler WR and Bauman DE 2006. Short communication: Regulation of milk fat yield and fatty acid composition by insulin. Journal of Dairy Science 89, 4172–4175.
De Veth M, Griinari JM, Pfeiffer AM and Bauman DE 2004. Effect of CLA on milk fat synthesis in dairy cows: comparison of inhibition by methyl esters and free fatty acids, and relationships among studies. Lipids 39, 365–372.
Forsback L, Lindmark-Mansson H, Andren A, Akerstedt M, Andree L and Svennersten-Sjaunja K 2010. Day-to-day variation in milk yield and milk composition at the udder-quarter level. Journal of Dairy Science 93, 3569–3577.
Gagliostro G and Chilliard Y 1991. Duodenal rapeseed oil infusion in early and midlactation cows. 2. Voluntary intake, milk production, and composition. Journal of Dairy Science 74, 499–509.
Gervais R, McFadden JW, Lengi AJ, Corl BA and Chouinard PY 2009. Effects of intravenous infusion of t10,c12 18:2 on mammary lipid metabolism in lactating dairy cows. Journal of Dairy Science 92, 5167–5177.
Glasser F, Ferlay A and Chilliard Y 2008. Oilseed lipid supplements and fatty acid composition of cow milk: a meta-analysis. Journal of Dairy Science 91, 4687–4703.
Griinari JM, McGuire MA, Dwyer DA, Bauman DE and Palmquist DL 1997. Role of insulin in the regulation of milk fat synthesis in dairy cows. Journal of Dairy Science 80, 1076–1084.
Griinari JM, Dwyer DA, McGuire MA, Bauman DE, Palmquist DL and Nurmela KVV 1998. Trans-octadecenoic acids and milk fat depression in lactating dairy cows. Journal of Dairy Science 81, 1251–1261.
Guinard J, Rulquin H and Verite R 1994. Effect of graded levels of duodenal infusions of casein on mammary uptake in lactating cows. 1. Major nutrients. Journal of Dairy Science 77, 2221–2231.
Hansen HO and Knudsen J 1987. Effect of exogenous long-chain fatty acids on lipid biosynthesis in dispersed ruminant mammary gland epithelial cells: esterification of long-chain exogenous fatty acids. Journal of Dairy Science 70, 1344–1349.
Harvatine KJ and Bauman DE 2006. SREBP1 and thyroid hormone responsive spot 14 (S14) are involved in the regulation of bovine mammary lipid synthesis during diet-induced milk fat depression and treatment with CLA. Journal of Nutrition 136, 2468–2474.
Harvatine KJ, Boisclair YR and Bauman DE 2009. Recent advances in the regulation of milk fat synthesis. Animal 3, 40–54.
Hurtaud C, Rulquin H and Ve´ rite´ R 1998. Effects of level and type of energy source (volatile fatty acids or glucose) on milk yield, composition and coagulating properties in dairy cows. Reproduction Nutrition Development 38, 315–330.
Ipharraguerre IR, Clark JH and Freeman DE 2005. Varying protein and starch in the diet of dairy cows. I. Effects on ruminal fermentation and intestinal supply of nutrients. Journal of Dairy Science 88, 2537–2555.
Kadegowda AKG, Piperova LS and Erdman RA 2008. Principal component and multivariate analysis of milk long-chain fatty acid composition during dietinduced milk fat depression. Journal of Dairy Science 91, 749–759.
Kadegowda AKG, Connor EE, Teter BB, Sampugna J, Delmonte P, Piperova LS and Erdman RA 2010. Dietary trans fatty acid isomers differ in their effects on mammary lipid metabolism as well as lipogenic gene expression in lactating mice. Journal of Nutrition 140, 919–924.
Lemosquet S, Delamaire E, Lapierre H, Blum JW and Peyraud JL 2009a. Effects of glucose, propionic acid, and nonessential amino acids on glucose metabolism and milk yield in Holstein dairy cows. Journal of Dairy Science 92, 3244–3257.
Lemosquet S, Raggio G, Lobley GE, Rulquin H, Guinard-Flament J and Lapierre H 2009b. Whole-body glucose metabolism and mammary energetic nutrient metabolism in lactating dairy cows receiving digestive infusions of casein and propionic acid. Journal of Dairy Science 92, 6068–6082.
Lock AL, Tyburczy C, Dwyer DA, Harvatine KJ, Destaillats F, Mouloungui Z, Candy L and Bauman DE 2007. Trans 10 octadecenoic acid does not reduce milk fat synthesis in dairy cows. Journal of Nutrition 137, 71–76.
Loor JJ, Ueda K, Ferlay A, Chilliard Y and Doreau M 2005. Intestinal flow and digestibility of trans fatty acids and conjugated linoleic acids (CLA) in dairy cows fed a high-concentrate diet supplemented with fish oil, linseed oil, or sunflower oil. Animal Feed Science and Technology 119, 203–225.
Maxin G, Glasser F and Rulquin H 2010. Additive effects of trans-10,cis-12 conjugated linoleic acid and propionic acid on milk fat content and composition in dairy cows. Journal of Dairy Research 77, 295–301.
McCarthy S and Smith GH 1972. Synthesis of milk fat from b-hydroxybutyrate and acetate by ruminant mammary tissue in vitro. Biochimica et Biophysica Acta 260, 185–196.
Minitab Inc. 2007. Meet Minitab 15: user's guide. Minitab Inc., State College, PA, USA.
Noziére P, Glasser F, Martin C and Sauvant D 2007. Predicting in vivo production of volatile fatty acids in the rumen from dietary characteristics by meta-analysis: description of available data. In Energy and protein metabolism and nutrition, EAAP Publication no. 124 (ed. I Ortigues-Marty, N Miraux andWBrand-Williams), pp. 585–586. Wageningen Academic Publishers, Wageningen, The Netherlands.
Overton TR, Cameron MR, Elliottt JP, Clark JH and Nelson DR 1995. Ruminal fermentation and passage of nutrients to the duodenum of lactating cows fed mixtures of corn and barley. Journal of Dairy Science 78, 1981–1998.
Palmquist DL, Davis CL, Brown RE and Sachan DS 1969. Availability and metabolism of various substrates in ruminants. V. Entry rate into the body and incorporation into milk fat of b-hydroxybutyrate. Journal of Dairy Science 52, 633–638.
Perfield JW, Lock AL, Griinari JM, Saebø A, Delmonte P, Dwyer DA and Bauman DE 2007. Trans-9, cis-11 conjugated linoleic acid reduces milk fat synthesis in lactating dairy cows. Journal of Dairy Science 90, 2211–2218.
Piperova LS, Moallem U, Teter BB, Sampugna J, Yurawecz MP, Morehouse KM, Luchini D and Erdman RA 2004. Changes in milk fat in response to dietary supplementation with calcium salts of trans-18:1 or conjugated linoleic fatty acids in lactating dairy cows. Journal of Dairy Science 87, 3836–3844.
Rigout S, Lemosquet S, Bach A, Blum JW and Rulquin H 2002. Duodenal infusion of glucose decreases milk fat production in grass silage-fed dairy cows. Journal of Dairy Science 85, 2541–2550.
Rigout S, Hurtaud C, Lemosquet S, Bach A and Rulquin H 2003. Lactational effect of propionic acid and duodenal glucose in cows. Journal of Dairy Science 86, 243–253.
Romo GA, Erdman RA, Teter BB, Sampugna J and Casper DP 2000. Milk composition and apparent digestibilities of dietary fatty acids in lactating dairy cows abomasally infused with cis or trans fatty acids. Journal of Dairy Science 83, 2609–2619.
Rook JAF, Balch CC and Johnson VW 1965. Further observations on the effects of intraruminal infusions of volatile fatty acids and of lactic acid on the yield and composition of the milk of the cow. British Journal of Nutrition 19, 93–99.
Roy A, Ferlay A, Shingfield KJ and Chilliard Y 2006. Examination of the persistency of milk fatty acid composition responses to plant oils in cows given different basal diets, with particular emphasis on trans-C18:1 fatty acids and isomers of conjugated linoleic acid. Animal Science 82, 479–492.
Rulquin H, Hurtaud C, Lemosquet S and Peyraud JL 2007. Effet des nutriments e´ nerge´ tiques sur la production et la teneur en matie` re grasse du lait de vache. INRA Productions Animales 20, 163–176.
Saebø A, Saebø PC, Griinari JM and Shingfield KJ 2005. Effect of abomasal infusions of geometric isomers of 10, 12 conjugated linoleic acid on milk fat synthesis in dairy cows. Lipids 40, 823–832.
Statistical Analysis Systems Institute (SAS) 2000. SAS user's guide: statistics, version 8.1. SAS Institute Inc., Cary, NC, USA.
Shingfield KJ and Griinari JM 2007. Role of biohydrogenation intermediates in milk fat depression. European Journal of Lipid Science and Technology 109, 799–816.
Shingfield KJ, Bernard L, Leroux C and Chilliard Y 2010. Role of trans fatty acids in the nutritional regulation of mammary lipogenesis in ruminants. Animal 4, 1140–1166.
Shingfield KJ, Saebø A, Saebø PC, Toivonen V and Griinari JM 2009. Effect of abomasal infusions of a mixture of octadecenoic acids on milk fat synthesis in lactating cows. Journal of Dairy Science 92, 4317–4329.
St-Pierre NR 2001. Integrating quantitative findings from multiple studies using mixed model methodology. Journal of Dairy Science 84, 741–755.
Storry JE and Rook JAF 1965. Effect in the cow of intraruminal infusions of volatile fatty acids and of lactic acid on the secretion of the component fatty acids of the milk fat and on the composition of blood. Biochemical Journal 96, 210–217.
Syrstad O 1977. Day-to-day variation in milk yield fat content and protein content. Livestock Production Science 4, 141–151.
Vanhatalo A, Varvikko T and Huhtanen P 2003. Effects of casein and glucose on responses of cows fed diets based on restrictively fermented grass silage. Journal of Dairy Science 86, 3260–3270.
This article was first published online: 22 February 2011 in animal// Volume 5 / Issue 08 / June 2011, pp 1299 1310, DOI: 10.1017/S1751731111000206