Introduction
In poultry, the net energy (NE) is the sum of the energy retained in the body and lost through heat production. Under its classic definition, the prediction of NE requires precise and accurate determinations of fasting heat production (FHP) and heat increment, which accounts for the energy production due to feeding, digestion, and the associated physical activity (Maharjan et al., 2021c). Then, the NE is indirectly obtained by sequential differences from the gross energy of the diet. Recently, the NE has been proposed as the energy retained in the body (NE gain) determined using Dual-Energy X-ray Absorptiometry (DEXA) and the FHP (NE maintenance) in calorimetry chambers (Arkansas Net Energy; Hilton et al., 2019), with attributes reported elsewhere (Suesuttajit et al., 2022).
Historically, the FHP has been defined as FHP ¼ a BWb , where BWb is called the metabolic BW (MBW) and is assumed to relate the BW with the body surface area. The coefficient b was initially defined as 0.75 by Kleiber (1947), and since then, authors have proposed different exponents without a general consensus.
The MBW has been used to predict the FHP of broilers as a means to determine NE (Cerrate et al., 2019). However, by definition, the MBW concept assumes the active metabolic tissue is a constant function of the BW. However, it has been stated that protein turnover may account for nine to 12% of basal energy expenditure. In contrast, fat turnover accounts for only two to 4% because of its lower turnover rate (Baldwin et al., 1980). Indeed, it has been reported that the heat production of broilers has been increasing through the years, associated with improvements in lean mass and breast yield (Martinez et al., 2019). Therefore, it is reasonable for the body composition to influence the FHP in broilers. If so, understanding its relationship with FHP will be even more relevant as birds continue to produce more lean mass and breast meat (Maharjan et al., 2020a). Consequently, we hypothesize that models predicting FHP may be more reliable, accurate, and long-lasting as genetic lines keep improving if they take into account the body composition of the birds. The objective of this study was to determine the influence of the body protein-to-fat ratio on the fasting heat production of broilers through a modeling approach.
Material and methods
Model development
Animal husbandry Four experiments (Exp 1, 2, 3, and 4) were conducted to obtain the data needed to develop the models, each with 600 day-old male Cobb 500 chicks randomly distributed into 24 floor pens. Each pen (4.65 m2 each; the experimental unit) contained a 5- nipple line, a tube feeder, and built-up top-dressed litter, and was located within a solid-walled, tunnel-ventilated facility. Each of the experiments received treatment diets during different periods: 1–11 (Exp 1; Starter), 12–22 (Exp 2; Grower), 23–33 (Exp 3; Finisher 1), and 34–56 days of age (Exp 4; Finisher 2). In the four experiments, the treatments consisted of diets formulated to reach 87, 100, and 113% of the target digestible lysine requirement (Cobb-Vantress, 2018) by varying the soybean meal inclusion rate at the expense of an inert filler (equal parts of sand and cellulose; Supplementary Table S1). The birds in the four experiments were placed in the pens at day 0. All were fed standard diets satisfying nutritional recommended levels (Cobb-Vantress, 2018) before each experimental period (Supplementary Table S2). All diets were corn-soybean meal based and were pelleted. Feed and water were provided ad libitum, and temperature and lighting programs were automatically controlled following standard practices.
Bird selection
All the birds in the corresponding experiments were group weighed at 8, 11 (Exp 1), 19, 22 (Exp 2), 27, 30 (Exp 3), 38, 41, and 56 (Exp 4) days of age, and the mean treatment BW was calculated. Four of the eight pens per treatment were sampled every time, and two independent sets of birds within the range of ±5% of the treatment mean BW were selected for body composition and heat production determinations. Five (Exp 1; Exp 2), four (Exp 3; Exp 4 on days 38 and 41), or three (Exp 4 on day 56) birds per pen were selected for body composition determinations. The number of birds for heat production determinations reduced progressively as the bird aged (10, 8, 5, 4, 3, 2, or 1 bird per pen, at days 8, 11, 19, 22, 27 and 30, 38, and 41, and 56 days, respectively).
Determination of fasting heat production
Birds selected for heat production determinations were individually weighed and distributed into 12 calorimetry chambers under thermoneutral conditions. All birds from the same pen were placed in the same chamber and were provided water ad libitum but no feed. The calorimetry system (described in Caldas et al., 2018) was used to measure the oxygen O2 consumption and CO2 production during a 24-h period. The heat production was calculated with the Brouwer equation (Maharjan et al., 2021c). At 24 hours, the system was stopped and the birds were individually weighed. Then, the FHP was expressed in kcal/bird per day, and the BW of the birds was adjusted, assuming the BW and the FHP changed linearly in the chambers through the hours, as follows:
Adjusted BWhpi = (BWhpi_0 + BWhpi_24)/2
where BWHPi = mean BW of the birds from the i-th pen used for heat production determination, BWHPi_0 and BWHPi_24 = mean BW of the birds from the i-th pen when placed in the i-th chamber (0 hours) and removed (24 hours). The chamber corresponded to the pen and was considered the experimental unit in all the experiments.
Determination of body composition
All birds selected for body composition determinations were euthanized by CO2 inhalation without fasting. After being weighed, they were scanned using a DEXA machine (GE Healthcare, General Electric Co., Madison, WI) with a small animal body software (Lunar Prodigy from GE enCORE version 12.30). The body protein and fat contents (g/bird) of every bird were determined by applying previously developed equations (Caldas, 2015) and were considered sub-samples. The sample mean protein and fat contents (g/bird) of each pen were adjusted for their mean BW to equal the mean adjusted BW of the birds used for heat production determinations, assuming no change in the percent (%) body protein and fat concentrations, as follows:
Adjusted CCi = (Actual CCi/BWbci) x Adjusted BWhpi
where CCi = mean chemical content (protein or fat; g/bird) of the birds sampled from the i-th pen, BWBCi = mean BW of the birds selected from the i-th pen to determine the body composition, BWHPi = mean BW of the birds selected from the i-th pen to determine the heat production. Then, the mean body protein-to-fat ratio (PFR) was calculated as follows:
PFR= protein content=fat content
where PFR = body protein-to-fat ratio, and protein and fat contents were expressed in g/bird or percentage.
Modeling the fasting heat production
The data from all four experiments were combined, and a dataset containing 108 rows was built. Each row corresponded to one pen and included the age (days), the mean adjusted BW of the birds selected for heat production, the mean adjusted protein and fat contents (g/bird) of the DEXA-scanned birds, mean PFR of the DEXA-scanned birds, and the FHP (kcal/bird per day). The MBW (BW0.75; kg0.75) was calculated and included in the database.
In order to prevent overfitting and determine the predictive ability, an internal procedure was applied by splitting into two sets for training (70%; n = 77) and validation (30%) subsets (Martinez et al., 2022b). Linear regressions were fitted under the following general linear additive model:
where Y = response variable, b0 = intercept, b1 to bp = estimates of each predictor, X1 to Xp = predictors, and e = error. Interaction factors were also tested. Data transformations (e.g., natural log) were applied when convenient to improve linearity among variables, or normal distribution (Martinez et al., 2020) or homoscedasticity (predicted versus residual plot; Martinez, 2021) of residuals. First, a simple linear model was fitted, considering the MBW as the only predictor. The effect of including the PFR and the age in the model was progressively explored. Potential models were screened based on the normal distribution and homoscedasticity of residuals and collinearity among variables (Martinez, 2012). Models were assessed based on their adjusted R2 and RMSE (Inca et al., 2022).
The models were considered able to predict the FHP if they met the regression assumptions (e.g., normality and homoscedasticity of residuals; Inca et al., 2020), the precision (R2) was high enough, and the error (RMSE) low enough. Models were considered able to explain the relationships between predictors and responses if, in addition, collinearity was not an issue. The selected models were tested for overfitting by comparing the training and validation R2 and RMSE, and were internally validated if R2 drop-off was ≤10% (Martinez et al., 2022b). If so, the models were refitted to all the data (n = 108), maintaining the same predictors to optimize the precision of parameter estimates (Martinez et al. (2022b).
Model validation
Validation experiments
To further validate the model under a more rigorous approach (Martinez et al., 2022c), two experiments (Exp 5 and 6) were conducted with male broilers.
In Exp 5, 2 430 chicks (two genetic lines; 50% each) were randomly distributed into 54 flor pens (two of those used in Exp 1– 4 joint), and each of the 27 pens per genetic line was assigned to one of three dietary treatments, provided from day 21 to day 42. Before the experimental period, all birds received standard diets (Supplementary Table S3). All diets were corn-soybean meal based, pelleted, and formulated according to AminoChick (Evonik Nutrition & Care GmbH; Maharjan et al., 2021b). The treatment diets contained 0.8, 1.0, and 1.2 times the digestible lysine requirement (Supplementary Table S4). On day 22, 60 birds (30 per genetic line) were transferred to the calorimetry chambers (five birds in each), and on day 41, similarly, 24 birds (four per each of the six diet genetic line combination) were moved to the chambers (two birds per chamber). Thirty-six and 108 birds were DEXA-scanned on day 22 (18 per genetic line) and day 41 (18 per each of six treatments), respectively.
In Exp 6, 1 440-day-old male Cobb 500 chicks were randomly distributed into 36 pens (the same used in Exp 5), and each of the pens was assigned to one of six treatments, consisting of six inclusion rates of a blind-coded exogenous enzyme, following Martinez et al. (2020). The corn-soybean meal mash treatment diets were formulated following the genetic line recommendations (Cobb-Vantress, 2018) and were provided from day 1 to day 41 under a three-phase feeding program (Supplementary Table S5). Sixty, 36, and 24 birds were selected on days 17, 20, and 41, respectively, and placed in the chambers (five, three, and two birds per chamber at each corresponding age). Five, four, and four birds per pen were selected and DEXA-scanned at 17, 20, and 41 days, respectively.
In Exp 5 and 6, the selection criteria, equipment, facilities, and procedures used to determine body composition, FHP, and the data processing were the same as in Exp 1 to 4. In both Exp 5 and 6, the validation unit was the mean treatment value, obtaining eight data points from Exp 5 (two genetic lines at day 21; six combinations of diet genetic line at day 42) and 18 from Exp 6 (six treatments tested at three ages).
Validation procedure
The dataset built-up to validate the model was equivalent to the one used with the data from Exp 1 to 4. Predicted values were obtained using these data and the refitted model with all the data from Exp 1 to 4. The predicted and observed values were compared with the simple linear regression of the observed values (natural log-transformed) as a function of the predicted ones. The validation R2 and RMSE values were compared to the adjusted R2 and RMSE of the refitted model. The model was externally validated if all the following criteria were met: validation precision (R2) was high enough, R2 reduction from development (refitted model) to validation was ≤25% (Martinez et al., 2022c), and the model prediction error was ≤13% (Inca et al., 2022). The error was defined as the mean deviation of predicted values from observed ones and was calculated as follows:
MPE = (RMSE/MR) x 100
where MPE = model prediction error (%), RMSE = root mean square error, MR = mean of response, and RMSE and MR as reported after fitting the model.
Statistical procedures
Databases were built in Excel (Microsoft Excel 2019; Microsoft Co., Redmond, WA) and JMP (JMP Pro 16; SAS Institute Inc., Cary, NC). Descriptive statistics were calculated in Excel. Plots were obtained from the Fit Model and Graph Builder platforms of JMP and using Excel. Models were fitted to data with the Fit Model platform of JMP. The normality of residuals was evaluated on the Distribution platform (Shapiro-Wilk test; P < 0.05 = non-normal). The heteroscedasticity was assessed on the Residual by Predicted plot in JMP. A test for unequal variances was performed by separating the residuals into two groups (‘‘1” or ‘‘0” if above or below the median predicted value, respectively) and comparing their variances (Brown-Forsythe test; heteroscedastic if P < 0.05). Outliers found by inspecting the Studentized Residuals plot of JMP were removed if considered influential (Cook’s Distance > 1). Collinearity among predictions was assessed with the variance inflation factor (VIF). VIF < 5 and > 10 were considered indications of low and high collinearity, respectively. Finally, the estimates of models’ parameters were compared based on their 95% confidence intervals, and no evidence or no conclusive evidence of difference (P > 0.05) were inferred when both or only one of the estimate means fell within the 95% confidence of its counterpart, respectively (Martinez et al., 2022a).
Results
Widely diverse data were obtained (Table 1; raw data in Supplementary Table S6) from Exp 1, 2, 3, and 4 in all the variables determined (age-wise means: BW, 184 to 4 160 g/bird; MBW, 0.28–2.88 kg0.75/bird; protein, 29–793 g/bird; fat, 6–327 g/bird; PFR, 1.98–8.52; FHP, 36–333 kcal/bird per day). The birds later used to test the models externally were also variable (raw data in Supplementary Table S7). However, their BW was lower at the same age than those used to develop the models, and those from Exp 5 included two genetic lines, providing data truly different.
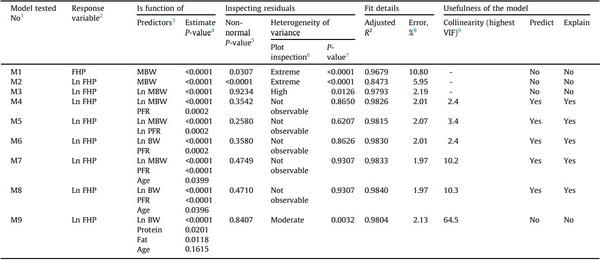
After fitting the models to the data (scripts embedded in Supplementary Table S8; reports as Supplementary Figs. S1 to S20), Table 2 was obtained. The first model tested (M1), predicting the FHP based on the MBW alone, showed residuals with extremely high heteroscedasticity and non-normally distributed. Natural log transforming the FHP alone (M2) did not correct these issues. Natural log transforming also the MBW (M3) made the residuals normally distributed and reduced their heteroscedasticity, but still was high and statistically significant (P < 0.05). The high heteroscedasticity in these three models made them inappropriate for any purpose. The inclusion of the PFR (M4) completely removed the heteroscedastic behavior from the residuals (P > 0.865), maintained them normally distributed, and produced a high adjusted R2 (0.9826) and low error (2.01%), making it suitable to predict the FHP and to explain the relationship among the variables involved. Natural log transforming the PFR (M5) did not add any value to the model and slightly increased the error and collinearity. Compared to model M4, replacing the MBW with the BW (M6) made the residuals even more homoscedastic, slightly increased the R2, and reduced the error. Including the age (M7) in model M4 increased R2 and reduced error, and replacing the MBW with the BW in this model (M8) produced the same effect. Models M8 and M7, including the BW or the MBW, respectively, showed virtually identical in their fit details. Finally, when the PFR was replaced with the actual protein and fat contents (g/bird), the R2 slightly reduced, the error increased, and the collinearity rose dramatically. Finally, all attempts to express FHP in kcal/kg of BW per day or kcal/kg0.75 of MBW per day provided no benefit to the models, and no interaction factor improved their metrics.
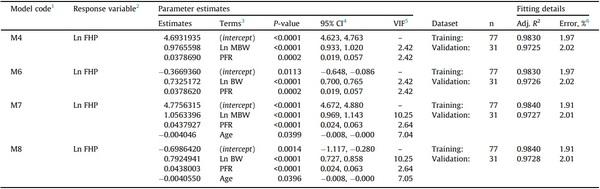
Even though models M7 and M8 showed indications of high collinearity, they were considered suitable to predict the FHP and explain the relationship among the variables involved in the model. The reason was that the degree of overlap of the confidence intervals of the parameter estimates of models M6 and M8 (Table 3) indicated that the estimates of PFR and Ln BW in both models were not statistically different (P > 0.05). The same was found in models M4 and M7. Based on these findings, models M6 and M8 were ranked as the most appropriate; however, models M4 and M7 were also selected. The four fully satisfied regression assumptions and showed high scoring based on established selection criteria.
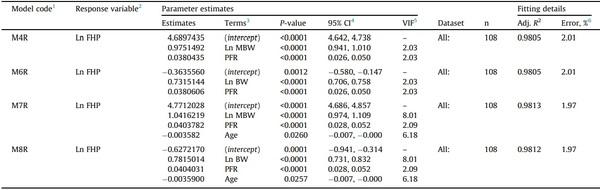
When tested for overfitting on the validation data subset, models M6 and M8 showed R2 reductions of 1.06 and 1.14%, respectively, and still low error (< 3%); therefore, they were internally validated (Table 3). Models M4 and M7 showed the same response as models M6 and M8; therefore, they were also validated internally. The models obtained (M4R, M6R, M7R, and M8R) after refitting the selected models to the whole data (n = 108) are presented in Table 4, showing more precise parameter estimates as the width of all confidence intervals decreased (Table 4).
When tested externally (Fig. 1; raw data in Supplementary Table S7; scripts embedded in Supplementary Table S9; reports as Supplementary Figs. S21–S24), the four refitted models showed high validation R2, low error, and uniform distribution of residuals on the unity line, satisfying the validation criteria. Therefore, they were considered validated externally.
Author’s point of view
-The main outcomes of this study are as follows: (1) The finding that no linear model including the MBW as the sole predictor satisfied the homoscedasticity criterion, invalidating these models, despite their high R2. (2) The demonstration that the body composition influences the FHP. (3) A set of four validated models to predict the FHP considering the body composition. (4) The finding that independent models including the body composition may work virtually identical if the BW is used instead of the MBW. (5) The finding that including other predictors, such as the growth rate, may provide no more relevant precision (actual R2 are high) and accuracy (actual errors are low) improvements if PFR remains included in the model.
-We consider that the positive relationship between PFR and FHP observed in our study aligns with the different turnover rates of lean and fat tissue mass (Baldwin et al., 1980; Maharjan et al., 2020b; Maharjan et al., 2021a). Other researchers have reported no effect of dietary composition on FHP in broilers (MacLeod, 1990); however, recent studies have reported diet effects on body composition (Uculmana et al., 2018) and turnover rates (Maharjan et al., 2020a). Moreover, our data support the influence of body composition on heat production reported in laying hens (Luiting, 1990) and pigs (van Milgen et al., 1998).
-Our results do not confirm the usage of the BW (or MBW) as a single predictor of the FHP in broilers because models failed to comply with the homoscedasticity assumption. We encourage researchers to be cautious and ensure, as possible, that regression assumptions are met. In addition, using the BW as a sole predictor of the FHP assumes the tissue metabolically active is a constant function of the BW (Glazier, 2015). Our data indicate this is not a realistic assumption.
Table 1
Data used to model the fasting heat production of broilers.1
1 Values presented are means and within parenthesis the SD.
2 MBW, metabolic BW. MBW, kg0.75 = (BW, kg)0.75.
3 Body composition: Protein and fat contents are expressed in g/bird.
4 PFR, body protein-to-fat ratio. PFR = (protein, g/bird)/(fat, g/bird).
5 Fasting heat production, expressed per bird (kcal/bird per day), per BW (kcal/kg per day), and MBW (kcal/kg0.75 per day).
Table 2
Screening of models predicting the fasting heat production of broilers.
1 M1 to M9 are the codes of the nine models assessed.
2 FHP, fasting heat production, expressed in kcal/bird per day.
3 MBW, metabolic BW. MBW, kg0.75 = (BW, kg)0.75. PFR, body protein-to-fat ratio. PFR = (protein, g/bird)/(fat, g/bird). BW, in g/bird. Age, in days. Protein, in g/bird. Fat, in g/ bird.
4 If P < 0.05, the estimate is statistically different from zero, meaning the predictor influences the response.
5 If P < 0.05, residuals do not meet the normality assumption needed for regression analysis.
6 The higher the heterogeneity, the more likely the model works differently at different ranges of FHP values.
7 If P < 0.05, residuals are significantly heteroscedastic, and the regression homoscedasticity assumption is not met.
8 Error (%) = (RMSE/mean response) 100.
9 VIF, variance inflation factor. VIF < 5 and > 10 were considered indications of low and high collinearity, respectively.
-We agree that differences in growth rate may determine differences in FHP (Konarzewski et al., 2000) and that including it as a predictor may better explain the variability in FHP, increasing the R2. However, we consider that such improvement will be marginal and that the growth rate itself may explain less than 2% of the variability that other factors do not already explain (100% – R2 < 2%). We also consider the broad spectrum of ages included in our study an indicator of strength (Martinez and Uculmana, 2016). Indeed, our models showed a good prediction ability even in data from birds with very different BW gains (development versus validation data).
Table 3
Internal validation of models selected to predict the fasting heat production of broilers
1 M4, M6, M7, and M8 are the codes of the four models selected.
2 FHP, fasting heat production, expressed in kcal/bird per day.
3 MBW, metabolic BW. MBW, kg0.75 = (BW, kg)0.75. PFR, body protein-to-fat ratio. PFR = (protein, g/bird)/(fat, g/bird). BW, in g/bird. Age, in days.
4 95% confidence interval.
5 VIF, variance inflation factor. VIF < 5 and > 10 were considered indications of low and high collinearity, respectively.
6 Error (%) = (RMSE/mean response) 100.
Table 4
Refitting of models selected to predict the fasting heat production of broilers.
1 Models M4R, M6R, M7R, and M8R were obtained after refitting models M4, M6, M7, and M8, respectively.
2 FHP = fasting heat production, expressed in kcal/bird per day.
3 MBW, metabolic BW. MBW, kg0.75 = (BW, kg)0.75. PFR, body protein-to-fat ratio. PFR = (protein, g/bird)/(fat, g/bird). BW, in g/bird. Age, in days.
4 95% confidence interval.
5 VIF, variance inflation factor. VIF < 5 and > 10 were considered indications of low and high collinearity, respectively.
6 Error (%) = (RMSE/mean response) 100.
-We consider it important to evaluate the possible influence of body composition as a confounding factor (Zhang et al., 2020) in data reported in the literature. The following two cases may be considered: (1) It has been inferred that the growth rate influences the basal metabolic rate of broilers based on the different allometric exponents used to determine the MBW in young or mature birds (Konarzewski et al., 2000). However, the body composition changes at different ages, making that reasoning unsupported. (2) It has been reported that the basal metabolic rate per kg BW in adults is half the one in infants (Rucker, 2007). However, younger individuals show higher PFR (Caldas et al., 2019), and our study shows that the higher the PFR, the higher the FHP.
-Limitations in our study that may have affected the results were the range of ages and BW of the birds used, genetic lines, environmental conditions, and the absence of specific stressing factors (Lyte et al., 2021a; Lyte et al., 2021b).
-The data presented herein will help researchers more accessibly and accurately determine the FHP of broilers, partially removing the dependence on indirect calorimetry systems. Also, it may improve the statistical power of studies as both body composition and FHP may be determined per bird. These models may also be used in longitudinal studies coupled to body composition if the latter is determined using non-destructive methods such as DEXA. Researchers and industry nutritionists may use combinations of these applications to ease the determination of the productive energy (Arkansas Net Energy) of the diet and ingredients.
-The data provided herein may be used to develop new strategies to determine the body composition and, indirectly, estimate the FHP of broilers by using simple measurements such as processing weights. Also, these data may be reused to study the individual variability of energy efficiency of broilers.
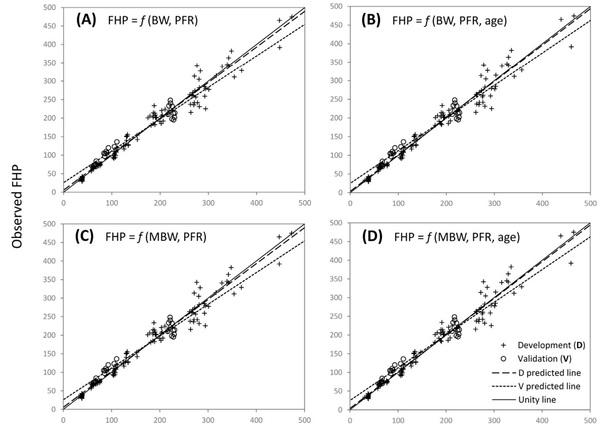
Fig. 1. Validation of models to predict the fasting heat production of broilers. FHP, fasting heat production; BW, body weight; MBW, metabolic BW, (BW, kg)0.75; PFR, body protein-to-fat ratio. f is the mathematical notation for function, where f xð Þ denotes that the response (FHP) is a function of x, and x identifies the set of independent variables (i.e., predictors). The unit and form (transformed or non-transformed) of each variable depend on the specific model, as indicated in Table 4. (A) Model M6R; validation R2 = 0.9265. R2 reduction (from refitted model to validation) = 5.50%; model prediction error = 2.54%. (B) Model M8R; validation R2 = 0.9289; R2 reduction = 5.33%; model prediction error = 2.50%. (C) Model M4R; validation R2 = 0.9265; R2 reduction = 5.50%; model prediction error = 2.54%. (D) Model M7R; validation R2 = 0.9289; R2 reduction = 5.34%; model prediction error = 2.50%. For A, B, C, and D, n = 25. All four models met the required criteria and were validated.
In conclusion, the models validated in this study showed that birds of the same age and BW have higher FHP if the PFR is also higher. This finding may encourage researchers to be cautious when building inferences on possible explanations for differences in heat production if the body composition has not been assessed. Assumptions in this study may also be taken into account, such as the range of ages, health status, and the absence of specific stress, among other factors that may influence the predictive ability of the models developed. Finally, the models presented may be used to predict the FHP of broilers, support the calculation of the net energy for maintenance value of feeds, and ease the determination of the Arkansas Net Energy value of diets and ingredients for broilers.
This article was originally published in Animal - Open Space, Volume 1, Issue 1, December 2022, 100029. https://doi.org/10.1016/j.anopes.2022.100029. This is an Open Access article under the CC BY license (http://creativecommons.org/licenses/by/4.0/). 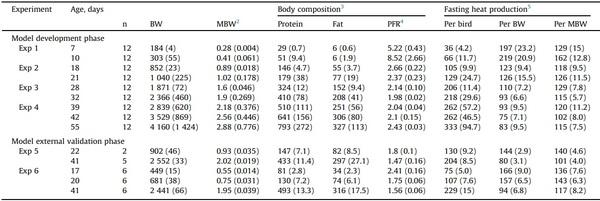

")


