1. Introduction
The food demand is projected to double over the next 50 years [1]. The increase in the demand of poultry meat over the past decade has been due to the low cost, the positive nutritional profiles, and the suitability in farming [2]. Intensive production is required to achieve the demand, and poultry health should be approached in a multidisciplinary way to ensure animal health [3]. According to OIE, an animal is in a good state of welfare if it is healthy, comfortable, well nourished, safe, and able to express innate behaviour, and if it is not suffering from unpleasant states such as pain, fear, and distress [4]. Certain routine management practices are stressful to birds [5], and they result in economic costs that cannot be ignored [6]. However, conventional methods for the quantification of stress are not suitable as they allow for detection only after the animals have been negatively affected [6].
In this first approach, we design the recording campaign in a farm, taking into account the several sounds caused by the machinery. The farm noise is recorded, accurately labeled, and processed using a non-invasive method, with the goal of analyzing the impact of several mechanization sounds in the farm on the background noise. Afterwards, we evaluate the number of occurrences, the duration of each sound, and the signal-to-noise ratio (SNR), as well as the acoustic equivalent level impact (Leq). In this sense, in the field of bioacoustics, some technology has been designed to improve poultry welfare. For more details, the reader is referred to [7].
This paper is structured as follows. The method and materials required to obtain the dataset and the corresponding process are detailed in Section 2. The database generation and the acoustic features used in this work are detailed in Sections 3 and 4, respectively. The discussion of the key aspects of this first approach is detailed in Section 5, and the conclusion and future work can be found in Section 6.
2. Materials and Methods
The preliminary acoustic analysis has been performed on a Mediterranean farm of 25,000 broilers during their first 9 days of life. The sounds emitted by the broilers and the farm machinery were recorded one meter away from the animals with one low cost microphone connected to a Raspberry Pi (3B) [8]. The design of the hardware of the project is inspired by [9], with a special focus on the flexibility and adaptability of the model, as well as its capability of recording long audio sequences. The recording was made using a Python script coded with the open source library PyAudio available on [10]. The code recorded streams in a non-compression file system (wav) of 30 min continuously during the whole experiment using a 16 bit Digital-to-Analog Converter (DAC) and a 44,100 KHz sampling rate. The file generated was tagged with the day and time of the recording.
The identification of sound was done by listening to the file and observing the time-amplitude, spectrum, and the Leq1s graph with Audacity, which is an open source program available on [11]. Acoustic evaluation and the Leq1s graph was executed with the labeled audio segments with Matlab, a program available on [12].
3. Farm Management Sound Database Generation
Poultry intensification requires the use of machinery to improve the efficiency of farm management, but it generates a moderate to high impact in the Leq of the environmental noise. A dataset of all the noise generated by the farm mechanical equipment found in this first nine days of observation has been generated. It is important to analyze the sound properties and the possible impact of all types of noise, the SNR, the duration, and the occurrences on the animals.
3.1. Data Labeling
The raw sound recorded by the microphone consists of acoustic events, some of which are complex to identify. The knowledge of a farmer and a vet have been required to correctly label the sound of the fan, the feeders, the drinkers and the sound vibrations of the bar of the feeders.
A manual labeling process has been conducted over 45 audio files, which corresponds to 22.5 hours of audio, labeled using up to 125 labels. The labeling method was not exhaustive over all the collected data, because the aim of this first approach was focused on analyzing the several different events occurring due to the farm management noise. The labeling was conducted with the goal of finding the types of events described by the farmer; nevertheless, once a file was labeled, all the events were labeled with their proper name. The reader is referred to [13] for more details on the data labelling.
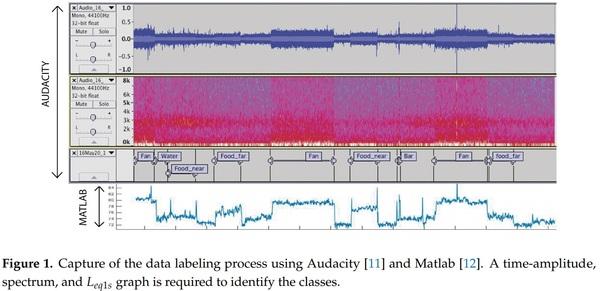
Figure 1 shows an example of the labeling process. Audacity [11] shows a time-amplitude and spectrum graph, and a Matlab [11] figure presents the equivalent level of the same audio segment. The Spectrum view clearly identifies the fan, the bar vibration, and the water class due to the frequency distribution of the noise. The Leq1s is important to identify the beginning and ending of each label. Food noise is identified by the impulse at the start and end of the time-amplitude and Leq1s graph, as there is no clear spectrum identification. The process of listening is a crucial stage before labeling to ensure that the audio corresponds to the visual identification of the class.
3.2. Data Classes Defined
Five classes have been clearly identified apart from the background noise according to the farmer indications. The fans, feeders, drinkers, and lights are activated and disabled automatically depending on the farmer’s rules introduced in the smart system, depending on the temperature, the humidity, and the hours of rest, among others. After the examination of several samples of feeder noise, it was observed that acoustic levels vary in the function of the location of the sound source in two blocks, so there was a split between two classes.
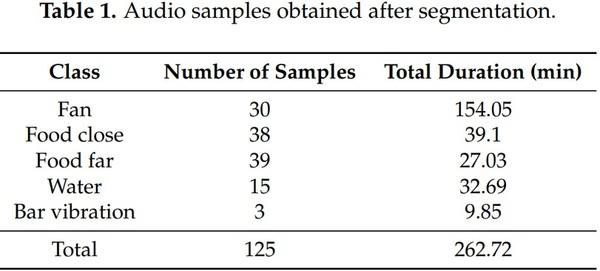
Data labeled is classified as follows: “Fan,” generated by the blower blades and motors; “Food close,” generated by the food load of the feeder near the microphone; “Food far,” generated by the food load of the feeder far from the microphone; “Water,” generated by the water load of the drinker; “Bar vibration,” the Structural vibration of the bar of the feeder captured where the microphone is held. The list of classes in the function of the number of files segmented and the duration of the samples of each category are shown in Table 1.
4. Acoustic Para Evaluations
Three parameters were taken into account to describe each event. The first parameter describes how persistent the noise is in terms of duration. The second metric is based on calculating the SNR. The resultant value indicates the ratio of the power of the event to the power of the background saliency.
The last metric determines the impact of the event on the equivalent Leq noise level. The calculation of each feature is described below, and the reader is referred to [14] for more details.
4.1. Duration Measurement
The duration of the event is calculated as the difference between the starting temporal stamp and the ending one. The duration of the event depends on the typology of the sound and the conditions of the farm as the machinery is activated automatically.
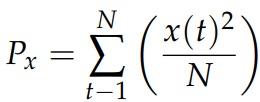
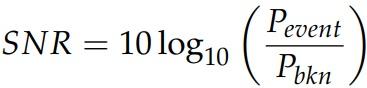
SNR is defined as below, where Pevent is the acoustic power of the class event, and Pbkn is the acoustic power of the former and latter segments of the class with background noise only.
Note that the SNR (see Equation (2)) could be negative if the power of the background noise near the event is higher than the power of the event itself. This may happen with low-energy sounds such as the water class.
4.3. Impact Calculation
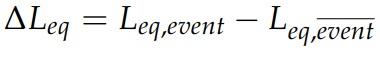
The impact determines the contribution of an individual event to the equivalent noise level calculated during the 30 minutes of the audio file. It is computed as the difference (see Equation (3)) between the Leq,event of the segment with the event and the Leq,¯event of the same audio segment where the event is replaced with a linear interpolation from the first to the last sample of the original data. A more detailed calculation explanation can be found in [13,14].
5. Discussion
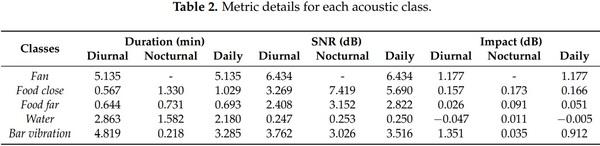
We evaluated the parameters of the acoustic data, as detailed in Section 4, and the results obtained are shown in Table 2. The data has been collected in a standard production cycle according to Spanish regulation [15]. The temperature and humidity were monitored between 34–39 °C and 40–51%, respectively.
The results shown in Table 2 correspond to the mean value of each metric (duration, SNR, and impact) during the first nine days of the broilers’ life and using the aggregated data of diurnal, nocturnal, and daily data files.
Fan presents the longest event (5.13 min) and the event with a better SNR (6.43 dB) and with a high impact (1.177 dB); the fact that it does not active during the night contributes to the rest of the animals. Following the class with the greatest impact is the Bar vibration with a long duration (4.8 min), mostly during the day, the high SNR (+3 dB), and the highest impact (1.35 dB). Food close and Food far reduces the duration in comparison with the durations previously mentioned, and there is a higher demand (in duration) over the course of the night. SNR is higher in the close class, and it is a better metric as the impact is null. Water is the event with a lower impact, as it has an SNR and an impact metric that are negligible.
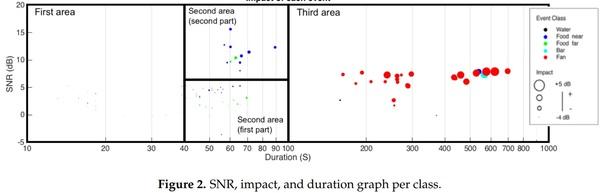
In Figure 2, we can observe the SNR, the impact, and the duration of all events labeled by class. Three big areas can be spotted. The first contains events of less than 40s—Food far, Food near, and Water—with a negligible SNR and impact; we could hypothesize that these events do not affect the animals. The small circles are due to the negative values of impact. The second area contains events more than 40 and less than 100 s and are divided into two subareas: one with less than 6 dB in SNR and the other with a high SNR and impact (which corresponds to the night events). In all these areas, the classes identified are Food far and Food near. In the third area, events with more than 100 s correspond to Fan and Bar vibration, and SNR and impact values are the highest of all other events.
It is noteworthy that, in the second area, the most dense classes have non-negligible values. Reducing the number of these events would reduce the acoustic impact on the animals substantially.
Based on the data analyzed, the classes can be sorted by the acoustical impact in the following order
Fan ≥ Bar Vibration ≥ Food close ≥ Food f ar ≥ Water
6. Conclusions and Future Work
The dataset obtained in this work during the first nine days of the broilers’ lives is a first approach to determining the distribution of noise on a farm due to the farm management noise. The acoustic event with the highest impact is Fan, with mean values of 5.13 min in duration, 6.43 dB in SNR, and 0.94 dB in impact. Fan cannot be reduced in terms of usage, as it reduces the concentration of gas decomposition among others inside the farm, but can be redesigned to generate less noise in terms of equivalent level Leq. The most frequent noise is the food supply with non-negligible metric values. The repetition of the same noise constantly reduces the silent intervals as broilers grow and augment the ingestion of food, activating more frequently the feeder.
These preliminary data results have to be further studied. Future work will focus on collecting more acoustic data over the entire production cycle (six weeks) to study broiler growth and on the effect of their vocal modifications on account of farm management. This data will then be correlated with gas emissions and broiler deceases.
Presented at the 6th International Electronic Conference on Sensors and Applications, 15–30 November 2019. This article was originally published in Proceedings 2019, 42, 83; doi:10.3390/ecsa-6-06632. This is an Open Access article distributed under the terms and conditions of the Creative Commons Attribution (CC BY) license (http://creativecommons.org/licenses/by/4.0/).


.jpg&w=3840&q=75)