1. Introduction.
Sorghum is used, either partially or entirely, as the cereal grain base in Australian pig and poultry diets but it has been associated with sub-optimal broiler growth performance (Selle et al., 2010, Liu et al., 2013). Cereal grains of different varieties and from different locations may be blended into poultry diets but varying the inclusion rate of one feed ingredient will spontaneously change inclusion rates of other feedstuffs. Conventional full factorial designs cannot detect these interactions but this obstacle can be circumvented by alternative experimental designs involving multivariate optimisation. Such designs generate response surfaces which graphically depict interactions between ingredients or nutrients. It requires the total amount of the mixture to be held constant and the response is entirely dependent on the relative proportions of the ingredients or nutrients in the blend. The intention of the present study is to examine how inclusion rates of three different sorghums, with divergent inherent properties, influence broiler performance and nutrient utilisation by using an equilateral triangle mixture design.
2. Materials and methods.
Three characterised sorghum with different protein, kafirin and phytate contents were used to formulate three nutritionally equivalent basal diets (Table 1). Following steam-pelleting, the three basal diets were proportionally mixed to form ten dietary treatments (Table 2) which filled the geometric space in an equilateral triangle as shown in Figure 1. Each of the ten dietary treatments was offered to six cages (6 birds per cage) or a total of 360 male Ross 308 chicks from 7 to 28 days post-hatch. Initial and final body weights were determined, feed intakes were recorded from which feed conversion ratios (FCR) were calculated. The incidence of dead or culled birds was recorded daily and their body-weights used to adjust FCR calculations. Total excreta collected from day 25-27 to generate data for parameters of nutrient utilisation [apparent metabolisable energy (AME); ME:GE ratios, N retention, N-corrected AME (AMEn)] on a dry matter basis. Excreta were air-forced oven dried for 24 hours at 80°C. The gross energy (GE) of diets and excreta were determined by bomb calorimetry using an adiabatic calorimeter (Parr 1281 bomb calorimeter, Parr Instruments Co., Moline, IL). Nitrogen contents of diets and excreta were determined using a N determinator (Leco Corporation, St Joseph, MI, USA). Differences were considered significant at P < 0.05 by using the JMP® 9.0.0 (SAS Institute Inc. JMP Software, Cary, NC). Response surface and contour plots are generated by R 3.0.3.
Table 1: Composition and nutrient specifications of sorghum-based experimental diets.
3. Results.
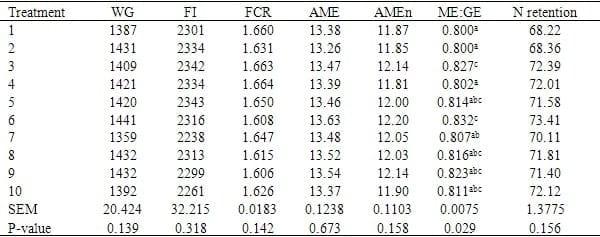
The overall mortality from 7 to 27 days post-hatch was 2.32% which was not influenced by dietary treatments (P > 0.70). Table 3 showed the results of growth performance and nutrient utilisation. There were no significant treatment effects on AME, AMEn, N retention and growth performance. However, diets based on Liberty sorghum had significantly higher ME:GE ratios than Block I and HP sorghums (P < 0.05).
Table 3: Effects of dietary treatment on growth performance [WG, weight gain (g/bird); FI, feed intake (g/bird); FCR, feed conversion ratio (g/g)] and nutrient utilisation [AME, apparent metabolisable energy (MJ/kg); AMEn, nitrogen-corrected AME (MJ/kg); ME:GE, the ratio of metabolisable energy and gross energy (MJ/MJ); N retention, nitrogen retention (%)].
4. Discussion.
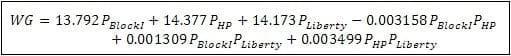
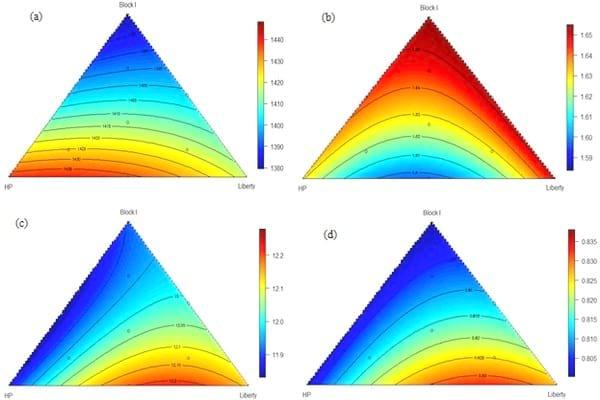
Compared to conventional statistical designs, response surfaces generated by mixture designs are more sensitive in detecting significance of treatment effects. The relationship between weight gain and the proportions of three basal diets as shown in Figure 2a was predicted by the following equation (r2 = 0.99, P < 0.001):
Where , , represents the percentage of diets based on sorghum Block I, HP and Liberty. Increasing the inclusion level of diet based on Block I compromised weight gain and the predicted optimal weight gain 1439 g/bird was achieved when the proportions of diets based on Block I, HP and Liberty were equal to 0.0%, 79.2% and 20.8%, respectively.
As shown in Figure 2b, the relationship between FCR and the three basal diet proportions was predicted by the following equation (r2 = 0.99, P < 0.001):
Similarly, higher inclusion rates of Block I compromised feed efficiency and the predicted optimal FCR 1.486 g/g was achieved when the proportions of diets based on Block I, HP and Liberty equal to 0.0%, 55.6% and 44.4%, respectively.
As shown in Figure 2c,the relationship between AMEn and the proportions of three basal diets was predicted by the following equation (r2 = 0.99, P < 0.001):
Increasing the inclusion rates of diet based on Block I and HP compromised AMEn and the predicted optimal AMEn 12.38 MJ/kg was achieved when the proportions of diets based on Block I, HP and Liberty equal to 0.0%, 32.0% and 68.0%, respectively.
As shown in Figure 2d, the relationship between ME:GE and the proportions (%) of three basal diets was predicted by the following equation (r2 = 0.99, P < 0.001):
Increasing the inclusion rates of diet based on Block I and HP would also compromise the ME:GE ratio. The predicted optimal ratio 0.845 MJ/MJ was achieved when the proportions of diets based on Block I, HP and Liberty equal to 0.0%, 31.1% and 68.9%, respectively.
Figure 2: Response surfaces of the relationships between the proportions of three basal diets and weight gain (a), feed conversion ratio (b), nitrogen-corrected apparent metabolisable energy (c) and the ratio of metabolisable energy and gross energy (d)
All three sorghums did not contain condensed tannin on the basis of the Clorox bleach test; however, non-tannin phenolic compounds may possess anti-nutritive effects. Sorghum Block I had the highest kafirin and phytate concentrations and both factors in sorghum may contribute to inconsistent or sub-optimal growth performance in poultry. In the present study, increasing inclusions of Block I in experimental diets compromised weight gain, feed efficiency and energy utilisation. Future investigations will use contour plot biometrics to generate response surfaces to understand the relationship of growth performance, nutrient digestion and utilisation with concentrations of phytate, kafirin and also non-tannin phenolic compounds in sorghum-based broiler diets. As Liberty is a white sorghum it is expected to contain lower concentrations of phenolic compounds than the other two red sorghums.
5. Acknowledgments.
We would like acknowledge the financial support provided by RIRDC Chicken-meat for the ongoing sorghum starch project.
6. References.
1. Liu SY, Selle PH, Cowieson AJ (2013). Animal Feed Science and Technology 181, 1-14.
2. Selle PH, Cadogan DJ, Li X, Bryden WL (2010) Animal Feed Science and Technology 156, 57-74.
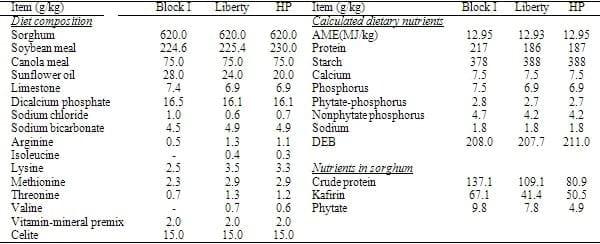
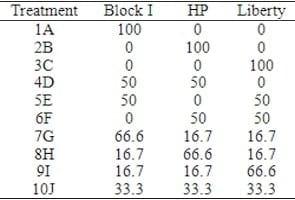
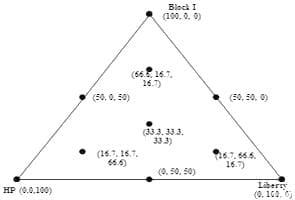 Figure 1: Dietary treatments in an equilateral triangle design.