I. INTRODUCTION
Flock uniformity is a key performance indicator and economic driver in commercial practice. Hughes et al. (2017) pointed out that Australian losses could exceed AUD$127M per annum, assuming that 5% of throughput totalling 1,159,602 tonnes chicken meat per annum was downgraded by 40% due to out-of-range weight specifications. From these brief comments it is easy to see that flock uniformity in live weight is a very important matter. This raises questions about how uniformity is assessed, what is a benchmark figure for flock uniformity in commercial practice, and what influences post-hatch uniformity.
Flock uniformity can be expressed as the coefficient of variation (CV) in live weight, with increased CV values synonymous with decreased uniformity, or in other words, a wider spread in live weights above and below the flock average. Here CV is calculated as statistical variance in live weight expressed as a percentage of the mean value of the flock. Commercial facts and figures are hard to ascertain, but it is clear that flock uniformity can decrease if close attention is not paid to incubation, nutrition, vaccination, husbandry, health and hygiene. For example, Ciftci and Ercan (2003) reported CV for live weight increasing from 8.7 to over 10% when males were fed less homogeneous feed. Madsen and Pedersen (2010) reported CV for live weight increasing from 6.7% to 9.5% when DL-methionine supplementation was reduced from 1.2 g/kg to 0.8 g/kg, and CV for breast meat yield rising from 8.7% to 11.7 % with this reduction of 0.4 g/kg DL-methionine supplementation. Hughes et al. (2017) reported proxy estimates of CV for live weight derived from three large scale chicken growth experiments ranging from 6.6% for males (3,157 g/bird) and 6.1% for females (2,714 g/bird) at 5 weeks of age, 7.3% for males (3,620 g/bird) and 8.8% for females (3,044 g/bird) at 6 weeks of age, and 6.7% for males (4,286 g/bird) at 7 weeks of age. CVs were sensitive to breed, sex, diet formulation and source of feed, with each of these factors influencing uniformity in live weight. Hughes et al. (2017) concluded that an optimistic estimate of achievable uniformity in live weight of meat chickens under experimental conditions was about 6%.
This report discusses a desk-top study that investigates variation in live weights of even and uneven mixed-sex flocks at weekly intervals from four to eight weeks of age. It also discusses the optimal number of chickens to be weighed individually to accurately predict flock weight.
II. MATERIALS AND METHODS
The data used in this investigation are summarised in Table 1. The mean values for live weight of male and female chickens were taken from tables of performance objectives for Cobb500TM chickens published by Cobb-Vantress (2018). It was assumed that within sex and age, live weight of individual chickens in the flock was normally distributed as observed in experimental flocks (Hughes et al. 2017). Standard deviations for male and female chickens were calculated from SD = CV * Mean / 100. A dynamic listing of individual bird weights in a flock of 50,000 mixed-sex chickens was constructed in a Microsoft Excel spreadsheet. Individual weights for males and females were calculated using NORMINV and RAND functions. Means and standard deviations from mixed-sex chickens were calculated from pooled data from the hypothetical flock of 50,000 chickens.
Samples of various sizes comprised of equal numbers of male and female chickens were selected at random from individual weights of birds in the hypothetical flock of 50,000 chickens. This process was iterated for each age group from four to eight weeks of age, and for flocks described as even (relatively high uniformity, CV 5%) and uneven (relatively low uniformity, CV 10%). The SAS procedure UNIVAR ((SAS Institute Inc., Cary, NC, USA)) was used to test the normality of live weight distributions in male, female and mixed-sex groupings in even and uneven flocks at various ages, as shown in Table 1.
III. RESULTS
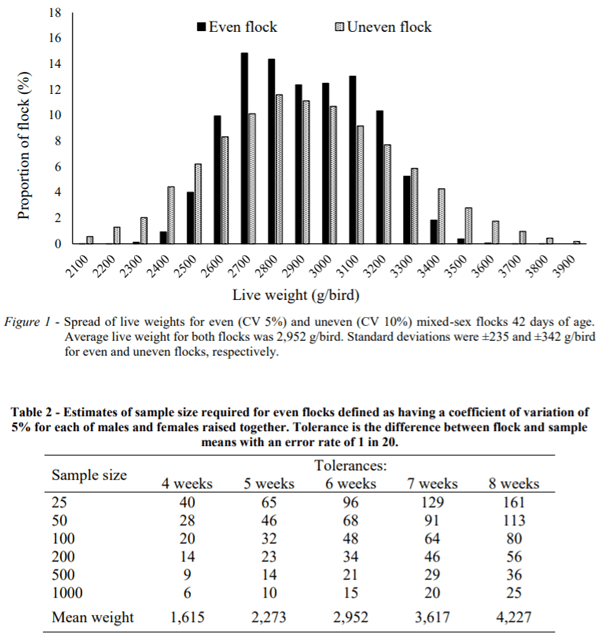
The hypothetical mixed-sex flock of 50,000 birds contained equal numbers of male and female chickens. Weights within male and female groupings were normally distributed, but when combined, weights were found by statistical analysis to be non-normal in distribution. This was particularly evident for the even flock (CV 5%), which can be seen as bi-modal in nature (Figure 1). It is also clear from Figure 1 that the uneven mixed-sex flock had larger numbers of underweight and overweight birds compared with the even flock.
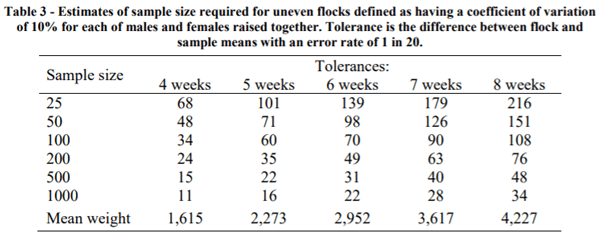
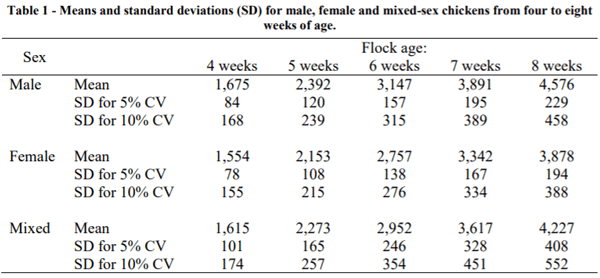
The sample sizes required to accurately predict flock average weight at various ages from 4-8 weeks are shown in Tables 2 and 3 for even and uneven mixed-sex flocks, respectively. For example, if the processor is prepared to accept an error of 100 g/bird in flock average weight at six weeks of age, then a minimum sample size of 25 birds is required for a mixed-sex flock with CV of 5% (Table 2). For an uneven flock with CV 10%, the minimum sample size is 50 birds (Table 3). If tighter tolerances are required by the processor, then sample sizes need to increase accordingly.
IV. DISCUSSION
The results from this desktop analysis of live weight distribution in flocks of various ages and differing in uniformity was based on data being normally distributed. It is possible that frequency distributions of live weight in commercial flocks are negatively skewed or leaning to the right. That is, the mode and median weights are greater than the mean weight, and there will be a higher proportion of under-weight birds. If that is the case, then skewness will affect on-farm sample sizes required for accurate estimation of live weight of commercial flocks.
There is anecdotal evidence of a decrease in uniformity in commercial flocks in recent times in Australia. A plausible explanation is that both Cobb 500 and Ross 308 broilers are no longer feather-sexable as the breeders have reversed the cross. One reason given for this reversal is that the use of automated equipment in hatcheries has outpaced the manual feather sexing procedure, so it is no longer feasible to continue single-sex rearing of chickens. The current study shows that mixed-sex rearing could result in a wider distribution of bird weights that is arguably no longer normally distributed which gives the impression of reduced uniformity. It seems less likely that other factors which affect flock uniformity, such as paying close attention to incubation, nutrition, vaccination, husbandry, health and hygiene, will have contributed to this wider variation in live weight.
V. CONCLUSIONS
Mixed-sex rearing could contribute to an apparent reduction in flock uniformity, and larger proportions of under- and over-weight birds sent for processing. Optimising sample weighing of live birds on farms might assist flock managers to identify underlying reasons for reduced uniformity and processors to optimise the order in which flocks are processed to reduce downgrades.
Abstract presented at the 30th Annual Australian Poultry Science Symposium 2019. For information on the latest edition and future events, check out https://www.apss2021.com.au/.