Impact of heavy market weights on facility and equipment needs
Published: May 28, 2013
By: Dr. Mike Brumm, Brumm Swine Consultancy, Inc.,North Mankato, Minnesota
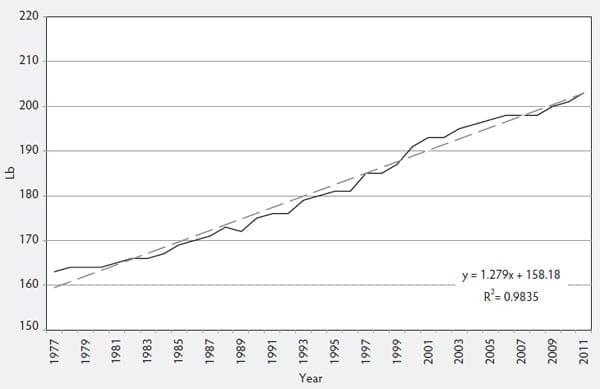
The annual increase in slaughter weights for barrows and gilts in the U.S. continues unabated. Since 1977 the federally inspected dressed slaughter weight for barrows and gilts has increased an average of 1.3 lb/year (Figure 1), with no evidence of a slowdown in this trend.
This annual increase in slaughter weight has challenged production facilities and equipment. The basic facility and equipment needs of importance are space (area per pig), feeders and drinkers. These represent the large initial capital investments in production facilities and are often the hardest items to change once in place.
The impact of space allocation on pig performance is generally well understood. When pigs are forced to grow with less than adequate space per pig, daily feed intake and daily gain are reduced within minimal impact on feed conversion efficiency (Gonyou et al, 2006). Using metaanalysis and published data from a number of experiments, they determined that 'adequate' space for growing pigs is defined by the equation:
Area (sq meters/pig) = 0.034 × (bodyweight, kg) 0.667
Area (ft2/pig) = 0.2167 × (bodyweight, lb) 0.667
Area (ft2/pig) = 0.2167 × (bodyweight, lb) 0.667
Data is limited regarding the space requirement of pigs grown to heavier final weights. Brumm et al (1996) grew barrows to 300 pounds at various space allocations and concluded that the requirement for pigs this heavy was somewhere between 0.84 and 0.93 m2/pig (9 to 10 ft2/pig). Based on the allometric space equation above, the predicted space requirement for pigs at 300 lb is 9.55 ft2/pig, the midpoint of the Brumm et al (1996) estimate.
Figure 1: Barrow and gilt slaughter wt, dressed basis. USDA data

For fully slatted facilities Gonyou et al (2006) predicted that for each 3% change in space allocation below the space defined as 'adequate', daily gain and daily feed are reduced 1% in fully slatted facilities. In the US, the 'average' stocking density in grow-finish facilities is estimated to be in the range of 7.2 ft2/pig (Kliebenstein et al, 2005). Using the 1% reduction in gain for each 3% reduction in space, this stocking density is predicted to reduce gain by a little over 5% overall compared to pigs grown in facilities with adequate space and pens topped when the pen average weight is 250 lb (Table 1).
However, as we grow entire pens of pigs to heavier weights prior to removal of the first pig(s) to slaughter, the impact worsens. For example, if the pen average weight at the time of first pig(s) removal is 275 lb and the stocking density is 7.2 ft2/pig, the overall rate of daily gain during the growfinish period is estimated to be reduced by 7.2% due to the impact of stocking density.
All of this suggests that stocking density management becomes more critical as sale weights increase from facilities, especially if no adjustment is made in the number of pigs placed in a facility. If producers and growers have uneven numbers of pigs per pen the pens with more pigs will have even slower rates of gain.
The impact of uneven stocking density at heavier sale weights can be estimated by looking modeling the impact in a facility with pens that measure 10' × 23.5'. Facilities with pens of this size are often stocked with 32 pigs/pen (7.34 ft2/pig). Assuming no death loss, if the first pigs in the pen are removed to slaughter when the pen average weight is 270 lb, daily gain in the pen is predicted to be reduced 6.7% due to the impact of crowding. If only 30 pigs are placed in one pen (7.8 ft2/pig) and 34 pigs in another (6.9 ft2/pig), daily gain will be reduced either 5% (7.8 ft2/pig) or over 8.3% (6.9 ft2/pig). In the event of unequal stocking density, either sale weights are compromised (especially on the last pigs removed from the facility or in the number of pigs outside of the packer's ideal payment grid) or the turns/year for the facility is reduced.
The interaction of heavier weights and space allocation is also evident on pig performance following removal of one or more pigs from a pen for sale to slaughter. While there are few published data sets on the topic, production system experience suggests that the more crowded a pen of pigs is prior to removal of pigs for first sale, the greater the expected increase in daily gain by the remaining pigs in the pen when more space becomes available. This highlights the importance of removing one or more pigs from every pen at the time of first sale so that all pens of pigs that remain in the barn have the opportunity for faster growth in response to decreased crowding. Failure to sell from every pen means the pigs in the pens with no sale pig removal become increasingly crowded and feed intake and gain become even more depressed, adding to the variation in pig performance in the facility.
Another common limit to pig performance as sale weights increase is feeder access. Producers and equipment suppliers often size feeders based on the number of 'holes' the feeder offers without regard to the issues surrounding the 'quality' of the eating space or ' hole'.
Gonyou and Lou (1997), using pigs with weights up to 211 lb (95 kg) concluded that the best compromise for feeder depth (distance from the front lip of the feeder pan to the feed delivery point) for grow-finish pigs was 20-30 cm (8.9 in to 13.3 in). They concluded that the ideal feeder depth for 209 lb pigs was 12.6 inches. This suggests that a majority of the feeders installed in production facilities today which have depths of 8-10 inches are limiting to pig performance as sale weights increase.
Table 1: Estimated space requirement for unrestricted pig performance and for a 5% reduction in daily gain. Based on Gonyou et al ( 2006).

The problem with increasing feeder depth is smaller pigs at time of placement stepping into the feeder to access feed and then tracking feed out of the feed pan. However this has not been an issue with 'wean-finish' feeders where pigs are grown from 12 pounds to slaughter weight on the same feeder. In this author's experience, as sale weights increase, feeders must have at least 10 in. of depth from the front lip to the feed delivery device or agitator plate with 11-12 inches preferred for dry feeders. If the distance is less than this, pigs end up pushing against the feeder and or have difficulty accessing the feed agitator plate.
The width of the feeding space is defined by the shoulder width of the pig. Petherick (1983) defined shoulder width in relation to pig body weight as:
Width (mm) = 64.0 × (bodyweight, kg) 0.33
Width (inches) = 1.942 × (bodyweight, lb) 0.33
Width (inches) = 1.942 × (bodyweight, lb) 0.33
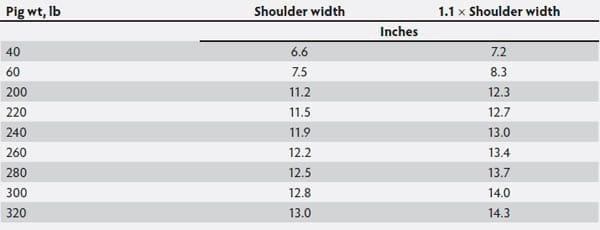
To allow for pig movement at the feeder, feeder spaces should be sized based on 1.1 times the shoulder width. Table 2 lists the estimated shoulder width in relation to pig weight and the estimated width of feeder spaces based on these shoulder width dimensions. This table supports the recommendation that feeders for today's production facilities should have a minimum feeder 'hole' width of 14 inches.
The table also highlights a common feeder problem with swine nursery units. Many nurseries now house pigs until 55 lb or heavier. The vast majority of feeders sold in the U.S. for placement in swine nurseries still have feeder 'holes' that are 6 inches by 6 inches. Based on shoulder dimensions these feeders most likely limit feed intake or at the minimum limit pig access to feed by limiting the number of usable spaces that pigs can eat from unless the spaces/holes are 8 inches wide.
Table 2: Shoulder width of growing pigs in relation to pig weight and estimated feeder 'hole' widths necessary to accommodate this dimension. Based on Petherick (1983).

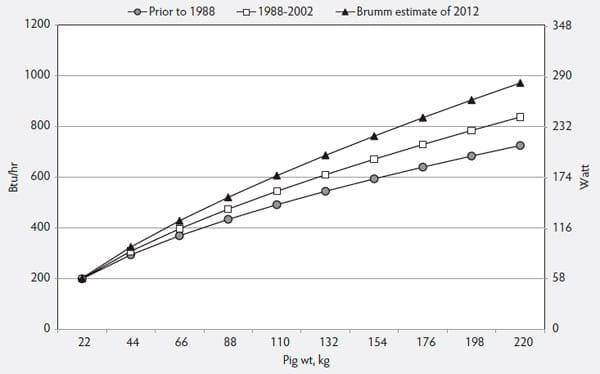
As a result of both genetic and nutritional improvements, rates of lean deposition have increased since the move to confinement production began in the 1970's. As a result, the heat production by the growing pig has increased. The best estimate is that metabolic heat production increases 12-15% every 10 years (Figure 2). While the data sets on heat production by growing pigs stop at 220 lb (100 kg) (Brown-Brandl et al, 2004), there is no reason to suspect that the trend doesn't continue with increased sale weights, especially since the US industry now routinely sells barrows and gilts with 52-54% lean content at carcass weights of 220 lb or greater.
This suggests that managing the pig's environment with the goal of heat removal is an increasing need, especially when pens are more crowded and the pigs can't modify their posture in the pen as readily to dissipate this increase in metabolic heat. Nienaber et al (1997) have suggested that the upper critical temperature threshold declines rapidly when pigs weigh more than 75 kg. They further suggest that pigs with high rates of lean gain (such as today's genetics) are much more sensitive to high temperatures than pigs with medium rates of lean gain. This conclusion was supported by the results of Renaudeau et al ( 2011).
Figure 2: Sensible plus latent heat production by growing pigs.

References
1. Brown-Brandl, TM, JA Nienaber, H Xin. RS Gates. 2004. A literature review of swine heat production. Trans. ASAE 47( 1):259-270.
2. Brumm, MC and NCR-89 Committee on Management of Swine. 1996. Effect of space allowance on barrow performance to 136 kilograms body weight. J. Anim. Sci. 74: 745-749.
3. Gonyou, HW, Z Lou. 1997. Ergonomic evaluation of feeder design. Prairie Swine Centre Annual Progress Report, Prairie Swine Centre, Saskatoon, Saskatchewan pp 55- 58.
4. Gonyou, HW, MC Brumm, E Bush, J Deen, SA Edwards, T Fangman, JJ McGlone, M Meunier-Salaun, RB Morrison, H Spoolder, PL Sundberg, AK Johnson. 2006. Application of broken-line analysis to assess floor space requirements of nursery and grower-finisher pigs expressed on an allometric basis. J. Anim. Sci. 84: 229-235.
5. Kliebenstien, J, M Brumm, B Buhr, D Holtkamp. 2005. Economic analysis of pig space: comparison of production system impacts- NPB #04-177. http://www.pork.org/Research Detail/160/EconomicAnalysisofPi.aspx#.T85CC1KD_aA. Accessed June 5, 2012.
6. Nienabler, JA, GL Hahn, RA Eigenberg. 1997. Development of an upper temperature threshold for livestock. Paper 974010, Amer. Soc. Ag. Eng., St Joseph, MI.
7. Petherick, JC.1983. A biological basis for the design of space in livestock housing. In: Baxter, SH, MR Baxter and JASC Mac- Cormack (eds.) Farm Animal Housing and Welfare. Martinus Nijhoff Publisher, Boston, pp 103- 120.
8. Renaudeau, D, JL Gourdine, NR St-Pierre. 2011. A meta-analysis of the effects of high ambient temperature on growth performance of growing-finishing pigs. J. Anim. Sci. 89: 2220-2230.
This paper was presented at the Allen D. Leman Swine Conference, held Sept. 15-18 at the St. Paul River Center in St. Paul, Minnesota. Published by Veterinary Continuing Education, Volume 39 2012. Engormix thanks the university and the author for this huge contribution.
The University of Minnesota, Allen D. Leman Swine Conference is an annual educational event for the global swine industry. It is internationally acclaimed for bringing science-driven solutions to the complex challenges facing the industry. Each year hundreds of participants from over 20 countries attend the Leman Swine Conference held in St. Paul, Minnesota, USA. Major players in swine production, animal health management, and marketing from around the world exhibit their products and services.
Related topics:
Authors:
Brumm Swine Consultancy, Inc.
Recommend
Comment
Share

Would you like to discuss another topic? Create a new post to engage with experts in the community.


