1. Introduction
Given an appropriate space allowance, along with optimal environmental conditions, indoor finishing pigs will generally establish specific and separate areas within a pen to undertake lying and dunging behaviour. Achieving such separation of these functional areas can promote hygiene and welfare of the animals, with the accompanying potential to improve sustainable food production. However, if the internal environment fails to provide optimal conditions for the pigs, hygiene, welfare and production can be compromised [1]. Sapkota et al. [2] observed that after being subject to acute heat stress, by exposure to an environmental temperature of approximately 39°C for 30 min, the core body temperature of pigs remained increased for 30 min, even though skin surface temperature dropped within 10 min. Such effects within the pens could result in the loss of defined dunging and lying areas as pigs wallow in excreta, which has the potential to create dirty pens from dunging in the lying area and reduced animal welfare from urinating in feeders resulting in unrest between the pigs.
Designation of separate activity areas can be influenced by different structural elements of the pen, including drinker and feeder locations, and floor type. Ocepek et al. [3] observed that locating drinkers in the outer slatted area of the pen, further from the solid lying area, caused a 30% reduction in urination on the solid lying area whilst levels of urination behaviour in the outer slatted floor area increased by 20%. Similarly, Hacker et al. [4] observed that type of partition, i.e., closed or open, had an effect on levels of cleanliness within the pen. Pens with open partitions produced dirtier pens than those with closed partitions, presumably because closed partitions reduce air velocity compared to open partitions so that lying areas with solid partitions could more easily facilitate maintenance of the required optimal conditions. Furthermore, Hacker et al. [4] found that a combination of open partitions and drinkers located closer to the lying area resulted in a dirtier lying area.
This could increase the risk of infection, due to increased defecation and urination around the lying area. These observations show that even subtle changes in the design of finishing pens can promote a cleaner and more desirable lying area and in turn more defecation in the desired dunging area, which can result in improved pig welfare and productivity. When pigs were reared in an internal environment with access to outside space for rooting and wallowing, Olsen et al. [5] found that more than 75% of all urinations and defecations happened outside, with as little as 3% on the internal deep bedded straw lying area. Equally, Huynh et al. [6] undertook temperature trials with groups of pigs over a 9 day period where the internal environment temperature increased by 2°C per day from 16°C to 32°C, and observed that higher temperatures affected lying and excreting behaviour, with higher temperatures contributing to increased fouling of the solid lying area of the pen. Nasirahmadi et al. [7] showed that groups of pigs adopted different lying locations and postures when subjected to different ambient temperatures, with pigs locating to cooler locations within the pen, i.e., the dunging areas, during periods of higher internal temperatures.
Therefore, the purpose of this research was to use Dynamic Thermal (DT) and Computational Fluid Dynamics (CFD) modelling to explore spatial variation in pen microclimate conditions in indoor-housed finishing pigs and to investigate the relative importance of different environmental drivers affecting the lying location of pigs.
2. Materials and Methods
2.1. Overview of the Modelling Process
Assembling a suitable dataset to explore the relative importance of different environmental parameters affecting lying patterns required a series of steps. First, data on heat flows and surface temperatures in a defined building from a previously verified DT model [8] were exported into a CFD model which generates data on environmental conditions within the building space. Next, the pigs were reproduced in the model as blocks with heat outputs, and a grid was set for the CFD model to estimate environmental parameters for each cell. The CFD model was then allowed to run and was said to have reached a successful solution when it had ‘converged’. The following section provides more details of the materials and methods required to complete the analysis.
2.2. Existing Building for Finisher Pigs
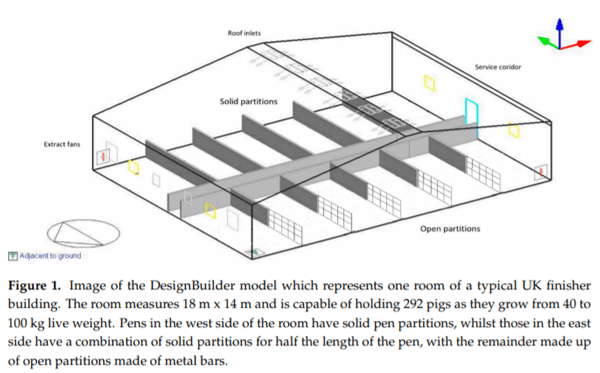
An existing finisher pig building of conventional design with fully-slatted floors, located in Staffordshire (UK), was chosen as the basis for simulation. The building houses a total of 292 finisher pigs in each of eight rooms. This particular housing design is commonly used in the UK to house finisher pigs from 20 to 100 kg and comprises a fully-slatted floor and an area of approximately 18 m × 14 m per room, which is subdivided into 12 individual pens of 6.75 m × 3.10 m with a stocking level of 21–25 animal each at the investigated weight, translating to a floor area of 0.84–1.00 m2 /animal. Feed was provided through a computer-controlled liquid feeding system. Outside each room is a service corridor which runs along the length of the building. Each room is ventilated by four in-wall panel extract fans (Multifan, Vostermans Ventilation BV, Venlo, Netherlands), comprising two fans of diameter 915 mm and two fans of diameter 574 mm, with a respective volume flow rate at 50 Pa of 16,800 and 9400 m3 h −1 per fan. The fans are located in the side wall opposite the service corridor, operated with a step controller, with air entry through a controlled ridge opening to maintain a 5 m s−1 inlet jet along the ridge of the ceiling [8]. Maximum airflow rates are 3 and 0.67 m/s at the fans respectively. The system is controlled so that a 5 m/s ventilation speed is produced at the ridge inlets using these conditions which is used in the CFD model. The ventilation speed is adjusted to meet an internal set point temperature which means the input ventilation speed will fluctuate slightly. Given the CFD results in Figure 11 the average airflow rate at the pig level is around 0.2 m/s. The summer ventilation rate is 25% higher than in winter. At the pig level, the conditions will still be around 0.2 m/s. Each room was equipped with temperature (TE sensor Solutions, 5K3A1 series 1 Thermistor; Measurement Specialties Inc., Hampton, VA, USA) and airspeed (AV-622 single point air velocity transmitter) sensors which were mounted 0.2 m above the 1 m high pen walls as well as ceiling-mounted video cameras (Sony RF2938, Broad lens 3.6 mm, 90°) to continuously record pig behaviour in six out of the twelve pens, namely the six central pens in the room. Corner pens were avoided for practical reasons in camera and sensor installation, and because the farmer used some of these for atypical pigs in the batch. Corner pens were included in the model, however.
2.3. DT and CFD Models
DT and CFD models of one room in this finishing building were created in a specialist building simulation programme using the latest version of simulation software (DesignBuilder V.5.0.3.007, EnergyPlus 8.1; DesignBuilder Software Limited, Stroud, UK). Figure 1 represents a section of the building created within the CFD model. Once all the necessary inputs are inserted into the DT model, it can provide average hourly surface temperatures, average hourly temperatures of the space and hourly external and internal heat gains. In turn, these data can be inserted into the CFD model to provide air velocity and temperatures for any given point at any given time, within the space investigated, i.e., the entire room or specific areas within.
2.4. Input Data for the Models
2.4.1. Building Specifications
The data inputs for external surface temperatures, U-values and dimensions were extracted from a DT model described previously [8], which was created using the same software package. Data used to parameterise the DT model were taken from a variety of sources. Records from the building contractor who constructed the building including wall, roof and window U-values of 0.49, 0.52 and 1.96 KJ m−2 K−1 respectively, as well as the infiltration rate of 0.7 ac h−1 [8]. Specifications from the manufacturer of the extract fans were used to determine the dimensions, and volume flow rate capabilities of each fan, while sensible and latent heat gains of animals were taken from Albright [9]. Values for minimum fresh air requirements for finishing pigs were obtained by averaging values from three of the leading and historical sources, namely British Standards 5502: BSI [10], ASABE Swine and equipment handbook MWPS-8 [11], and English et al. [12]. For pigs with an average bodyweight of 20, 40, 60, 80 and 100 kg, average fresh air requirements used in the DT model were 1.50, 2.51, 3.95 and 5.97 l s−1 respectively.
2.4.2. Historical Weather Data
Data from the Met Office, the UK’s national weather service, were obtained from a weather station at Shawbury, located approximately 17 miles from the existing pig building in Staffordshire. Annual weather data were obtained for a sufficient period of time to ensure a pre-warming of the DT model internal environment before the selected scenario date of 10th February 2015, a typical winter day in the UK. This allowed the building DT model to condition the internal environment to facilitate the correct internal surface temperatures. The weather data inserted into the DT model yielded simulated external and internal surface temperatures of the building that could subsequently be exported into the CFD model. The time points selected for modelling were 06:00, 12:00, 18:00 and 00:00 h, chosen because they spanned the 24 h day and had availability of quality video images of pigs on a typical winter day.
2.4.3. Patterns of Pig Lying Behaviour
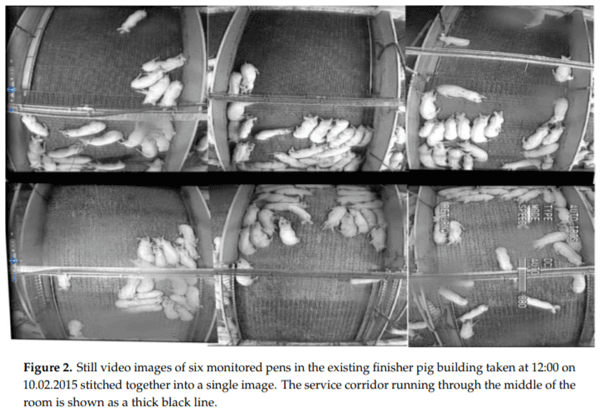
For the chosen scenario date of 10.02.15, four different time points were investigated to gain a representative sample of pig lying behaviour in a 24 h period [13]. These times were at 6 hourly intervals during the day, namely 06:00, 12:00, 18:00 and 00:00 hr, and were considered appropriate points to examine video footage of the pigs at rest and without disturbance from human interaction [13]. At each time point, a suitable still video image clearly showing the lying locations of the pigs in each pen was chosen and subsequently stitched together to create an overall picture of pig behaviour in the six monitored pens for that particular point in time. Figure 2 provides an example of one such stitched image taken from onsite video footage at 12:00 hr on 10th February 2015, showing pigs lying in the six selected pens. The temperature at sensor level was 21°C and ridge air velocity was at 0.5 m/s
The observed lying pattern of the pigs in each pen was replicated within the CFD model by creating representative blocks according to how each pig within the group was lying. Pigs typically lie in one of three positions, namely recumbent, semi-recumbent or sternal [14], with concomitant effects on the amount of floor area occupied by a pig adopting that particular posture. Hence estimating the floor area occupied by each pig in each video image was undertaken by averaging two different methods, namely an image processing technique and an empirical formula as described below. Since the dimensions of the pig could not be easily determined from the images, due to the non-linear shape of the back of the pig when in the lying posture, the second method for estimating the width and height of each pig using the formulae from Petherick [14] was also adopted.
2.4.4. Estimation of the Dimensions of a 40 kg Pig
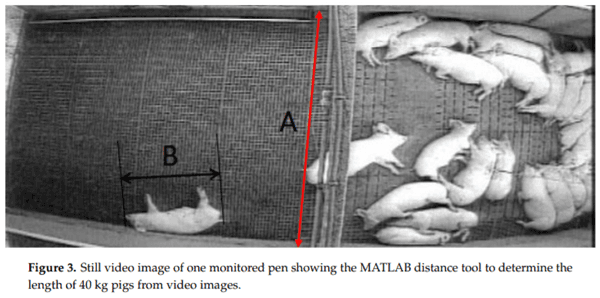
The image processing method used is a non-contact and non-stressful method to detect the length of a pig whilst it is in the lying posture [7]. A machine vision approach in Matlab®(Mathworks Inc., Natick, MA, USA) was developed which uses the width of the existing pig pen (3.1ˆm) as the calibration scale against which length of the pig was estimated. By using the distance tool in MATLAB (imdistline), the distance between two endpoints of a line can be measured in pixels. The proportion of the distance between two endpoints and length of the scale 3.1 m was applied for finding the calibration factor (CF) which was then applied to calculate the length of each pig [13]. Figure 3 shows distance A, which in this case is 3.1 m, and is the indicator of the length of the scale from which to measure all other objects. Distance B is the length of a particular pig (m) which is equal to the length of the pig in pixels divided by the CF. From images of each of the six pens taken at 06:00, two pigs that were laid on their sides in a straight position and as close to the centre of the camera image as possible, so the ‘fish eye’ lens did not affect the calculation, were chosen to determine the average length of pigs in that particular pen at that point. This image processing method produced an average length from the 12 chosen pigs of 0.997 m.
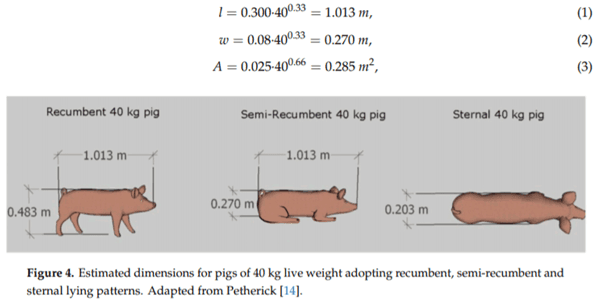
The second method used was that of Petherick [14] who provided equations for estimating the dimensions of recumbent, semi-recumbent and sternal lying patterns in relation to pig live weight. Equations (1)–(3) and Figure 4 show the resulting dimensions for a 40 kg pig. Petherick [14] reported that for objects such as pigs, which are geometrically dissimilar, the surface area (A) increases as the square of the length (l) or width (w) (linear measurement), whilst volume increases as the cube of the length and width. Therefore, the weight (W) of the pig is related to the linear measurement (L), where W = kL 3 .
To estimate the average length of a typical 40 kg pig, the mean was taken of the image processing value and that of the equation from Petherick [14]. Thus, a mean length of 1.0 m was adopted.
The semi-recumbent position was taken as the average posture for the 40 kg lying pig. For the purposes of the CFD model, the legs were not included, as these are typically cooler than the body from where the majority of the heat loss is transferred into the surrounding environment [15]. The simplified use of a cube to represent the pig in the CFD model produces comparable results compared to a three-dimensional model of a pig and cylindrical shape, with the benefit of reduced computational time [16].
2.4.5. Obtaining the Coordinates of a 40 kg Semi-Recumbent Pig
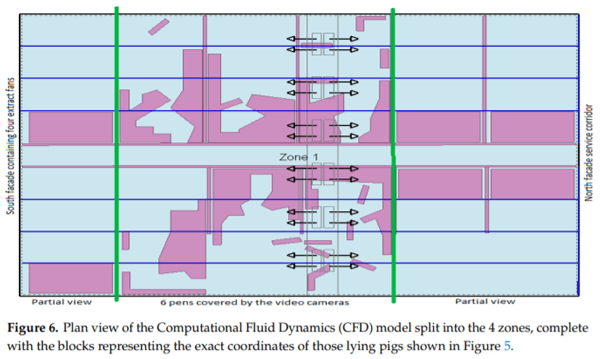
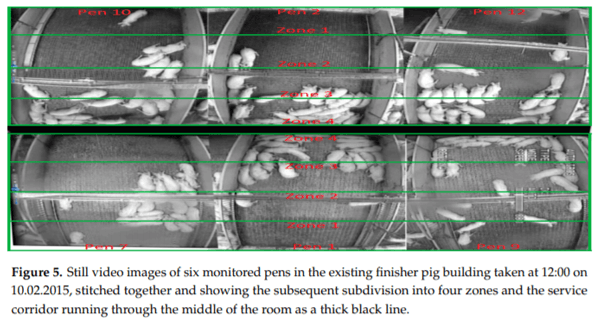
In order to find the exact location of lying pigs, solid and open partitions, drinkers and the feed trough within each image for each pen, each pen was equally subdivided into four sections (zones) as shown in Figure 5. Zone one, designated as the feeding, dunging and activity area, was against the outer wall while zone four, designated as lying area, was adjacent to the corridor. Zones 2 and 3 were respectively arranged in between as described by Nasirahmadi et al. [13].
Using pig locations in the zones and dimensions, the blocks representing actual pigs were created in the CFD model, as a match of the stitched video still images shown in Figures 5 and 6 shows that, wherever possible, the pig blocks were grouped to make a larger block of lying pigs, i.e., in instances where there were pigs lying next to each other. This action assisted in lowering the number of cells which reduced the computational time that it took the model to converge. It can be seen in Figure 6 that the top set of 6 pens are segregated using solid walls throughout, whereas the bottom set of 6 pens are a combination of solid and open partitions, as also indicated in Figure 1.
2.5. Extracting CFD Data for Cells that Pigs could Occupy
Using the inputs described so far in Section 2, the CFD model converged with a grid in the x, y and z-axis of approximately 600 × 600 mm. The exception was where blocks representing pigs, partitions or inlet openings intersected this grid, in which case the model created a finer grid. The grid was increased from a default 300 mm until it no longer converged, resulting in the 600 mm grid more closely approximating the size of a pig. This step reduced the possibility of non-independence between the cells.
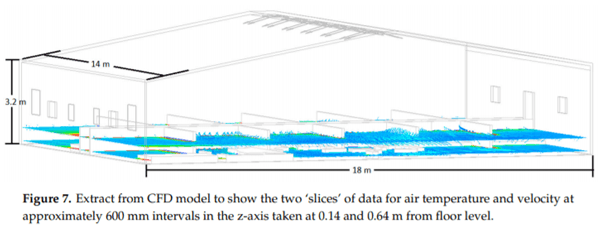
Next, from the CFD model, air temperature and velocity data for each cell were extracted for two horizontal ‘slices’ across each pen. The pre-determined grid slices were taken at 0.14 m and 0.64 m above the floor level (see Figure 7). The 0.14 m slice was chosen as it is in the actual lying zone of the pig, whereas 0.64 m is just above the position where the pigs are lying. Using this approach generated approximately 260 cells per pen.
The CFD model was validated against the temperature and velocity sensors (1.2 m height) for the empty unit. Temperature sensor readings were matched to the model with high accuracy. The results between air velocity sensors and model were also comparable despite a degree of inaccuracy of the sensors.
2.6. Selected Scenarios Chosen to Confirm the Validity of the CFD Model
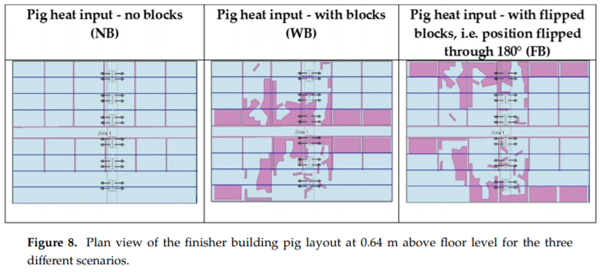
In order to confirm the sensitivity of the model, three sequential CFD scenarios were explored, as shown in Figure 8. Firstly, the CFD model was run to simulate conditions in the absence of any pigs as a heat source in the space, i.e., no blocks of pigs in the space (NB). Next, blocks were used to represent the pigs as a heat source, i.e., with blocks of pigs in the space (WB). Finally, to examine whether the model was sensitive to changes in pig position, the position of the pig blocks was flipped 180° along the y-axis, i.e., with flipped blocks of pigs (FB). The purpose for carrying out these three scenarios was to ensure that the model was sufficiently sensitive to detect subtle changes to the location of heat flux produced by the blocks of pigs, and to confirm that these changes influenced the air velocity and temperatures of the area just above the pigs (i.e., 0.64 m above the floor) for any given point in the space where a pig could potentially lie.
2.7. Derivation of Effective Draught Temperature
Finally, air temperature and velocity data for each cell were incorporated into an effective draught temperature (TED) using Equation (4) from American Society of Heating [17], where Tp is the dry bulb air temperature at some point p in the pen, Tr is the mean room air dry bulb temperature of each pen and Up is the local air velocity at point p in the pen.
2.8. Investigation of Environmental Associations with Pig Lying Locations
The question of what drives pigs to prefer one lying location within the space over another was systematically examined using correlation and a sequential regression model to understand the relative importance of each of a series of environmental factors. A database was created where the environmental parameters for each cell, namely air temperature, velocity and TED were listed alongside a series of descriptive codes. Each cell was coded as to whether it was a location preferred by the pigs, i.e., cell contained all or part of a lying pig (‘1’ was used), or it was avoided by the pigs, i.e., cell contained no lying pigs (‘0’ was used). The same analogue codes were also fitted for whether the cell was adjacent to a perimeter wall, whether it had a solid partition between an adjacent pen or an open partition, or if the cell adjacent had a lying pig in it. Additional codes were also fitted for a cell containing a feeder, feeder within one cell distance, feeder within two cells distance and whether a cell was adjacent to a drinker. To allow for the fact that the response to environmental data may have followed a quadratic pattern rather than a linear one, data for air temperature squared and velocity squared were also prepared. It should be noted that although all pigs were included in the CFD model as a heat flux into the space, and included in the same location as shown in the video images, any standing pigs were removed from being included into the data collected for statistical analysis of pig lying location.
The combined codes from the four time scenarios resulted in over 7000 lines of data available for investigation using sequential regression analysis on the lying preferences of the pigs, fitting all possible explanatory variables in the model. Data were analysed in the statistical package Minitab (v17.0, Minitab Ltd, Coventry).
3. Results
3.1. Validation of the Model as Portrayed by the CFD Images
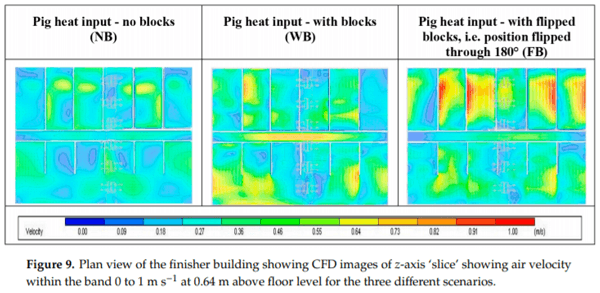
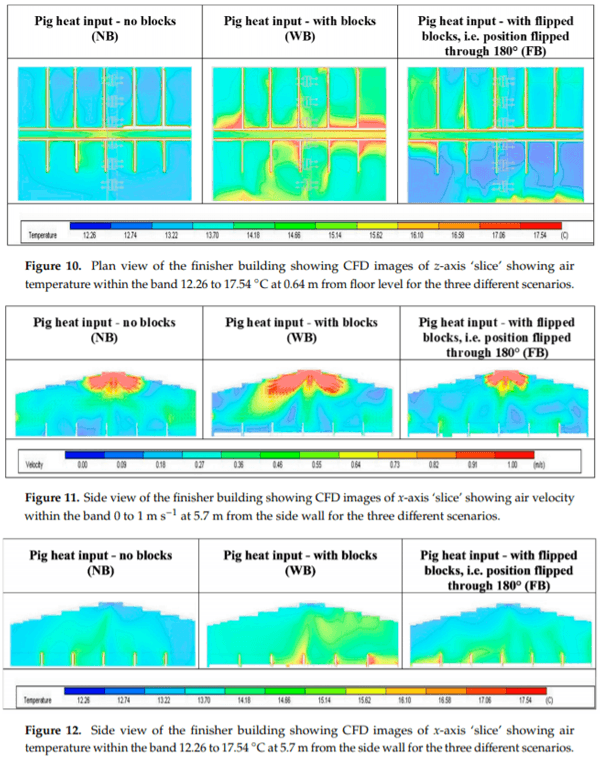
Figures 9–12 show changes in air velocity and temperature patterns throughout the space for the three scenarios relating to pig presence and location. Figure 9 NB indicates patches of increased air velocity throughout the space, and Figure 10 NB shows slightly decreased temperatures in those areas. This could be due to the cooler incoming fresh air (3°C) having a ‘dumping’ effect on the affected area, therefore increasing velocity and decreasing temperature. For WB in Figures 9 and 10 the velocity and temperature patterns change considerably in those locations where the blocks representing the pig heat flux are located (compare to Figure 8). In the flipped block scenario shown in Figures 9 and 10 FB, velocity and temperature patterns change in line with the new layout of the pigs. Collectively these three scenarios suggest that the CFD model was sufficiently sensitive to detect subtle changes in fluid dynamics of the different locations produced by the heat flux of the block of pigs, and provide evidence that these changes subsequently influenced air velocity and temperatures of the area just above the pigs (i.e., 0.64 m above the floor) for any given point in the space that has potential for a pig to lie.
3.2. Variation in the Environment within the Space
The converged CFD model provides the opportunity to explore the environment at any point within the space by examining velocity and temperature data taken as ‘slices’ in the x, y and z-axis. Figures 9–12 show how the air velocity and temperature changes substantially between the different scenarios of NB, WB and FB. Figures 9 and 10 WB indicate an expected velocity and temperature pattern, showing a lift in velocities and temperatures above the locations where the pigs have chosen to lie. Figures 9 and 11 FB show that the new lying location of the pigs results in an increase in air velocity above the locations where the pigs are lying compared to WB, while there is a decrease in temperature throughout the space compared to WB. This decrease in temperature can also be seen in Figure 12 FB compared to WB, which also clearly shows a warm air plume riser in the centre of the space, just above where the pigs are lying.
Figure 9 shows that when the pigs are moved to a different location, i.e., 180° in the FB scenario from their actual lying location WB, there is a distinct increase in the velocity just above the area the pigs are occupying. Air velocity around the new location of the pigs was typically above 1.0 m s−1 , higher velocities which were not seen in the WB scenario where maximum air velocity where the pigs choose to lie was only approx. 0.75 m s−1 . In turn, these increased air velocities show an effect on the internal temperature of the space. Figures 10 and 12 indicate that when the pigs are moved to a new location (FB), there is a distinct decrease in the temperature throughout the pens compared to that in their actual lying location, i.e., WB. Figure 10 FB indicates that there is a decrease in temperature around the areas the pigs are occupying of approximately 2°C, compared to the actual lying locations shown in Figures 10 and 12 WB.
3.3. Environmental Association with Pig Lying Locations
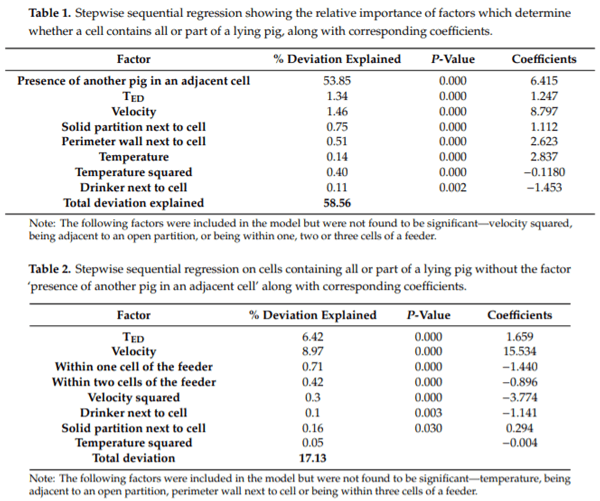
Stepwise sequential regression analysis (see Tables 1 and 2) was carried out to investigate which of the 13 environmental factors considered influenced whether a pig to choose to lie in one particular area over another. Eight factors were found to have a significant impact on pig lying location, with the proportion of total deviation explained being 58.56%. Presence of another pig in an adjacent cell was the primary influence (53.85%), followed by Velocity and TED with much smaller influence (1.46 and 1.34% respectively). Associated regression factor coefficients indicate that six of the eight factors had a positive contribution in influencing the pigs to lie in a specific part of the pen. On the other hand, temperature squared and being adjacent to a drinker were factors that had a negative influence on influencing a pig to lie in that specific area of the pen. Being adjacent to a solid partition or a perimeter wall contributed to 0.75 and 0.51% respectively of the deviation in lying location, with a positive contribution to influencing the pig to lie in a cell with a respective regression coefficient of 1.112 and 2.623. Being adjacent to an open partition was not found to have any influence on whether a pig chose to lie in a cell, nor did proximity to a feeder or air velocity squared.
Since the deviation explained in Table 1 was dominated by the presence of another pig in an adjacent cell, a stepwise sequential regression analysis was also run with the factor ‘presence of another pig in an adjacent cell’ removed. Table 2 shows that of the 12 environmental factors investigated, eight were found to have an impact on lying location, with the proportion of total deviation explained being 17.13%. Air Velocity and TED were the primary influences (8.97 and 6.42%, respectively), followed by solid partitions (0.16%), with a positive contribution to influencing a pig to lie in a cell with respective regression coefficients of 15.534, 1.659 and 0.294. On the other hand, velocity squared, feeder within one or two cells distance and drinker in the next cell were factors that had a negative association with a pig to lie in that specific area of the pen with respective regression coefficients of −3.774, −1.440, −0.896 and −1.141. Neither temperature nor being adjacent to an open partition, a perimeter wall or within three cells of a feeder had any influence on whether a pig chose to lie in a cell.
4. Discussion
4.1. Value and Robustness of the CFD Model
The purpose of this research was to use CFD modelling to explore spatial variation in pen conditions in indoor-housed finishing pigs and specifically to investigate the relative importance of different environmental drivers affecting whether pigs choose to lie in a particular location of the pen or not.
By investigating air temperature and velocity of the CFD slices within the pen, the influence of spatial variability in microclimate can be examined to assess the potential ‘comfort zone,’ i.e., the conditions in areas where the pigs choose to lie. As seen from the still video images in Figures 2 and 3, the pigs were mainly lying in a semi-recumbent lying posture and with partial huddling, rather than in a sternal position and tightly huddled together which is associated with the pigs feeling cold [13,18]. The images suggest that the pigs were thermally comfortable within their chosen location, as they were neither portraying a tight huddle with a sternal posture nor spread out in a recumbent posture, respectively indicative of pigs if they were subject to excess cold or heat [19].
The study was carried out on still video images of 40 kg finisher pigs, which have an approximate length of 1000 mm. Since the converged CFD model resulted in cells of approximately 600 mm wide but with smaller cells around the positions of pigs, partitions and inlets, it could be that the same pig was represented in more than one cell and thus a degree of duplication within the results. Such repetition could have led to an overestimation of the level of significance of the results. Equally, this creates a degree of non-independence between cells and effect on the P-Values. This was observed on the first run of the CFD scenarios using a 300 mm grid. Therefore, the grid was increased until it could no longer converge, resulting in a 600 mm grid. Nevertheless, whilst the exact level of deviation and significance may have some degree of error, we can be confident that the final model used in this study was reflective of the likely patterns of fluid movement within the space and thus give an accurate representation of what would happen in the building in reality.
4.2. Effect of Presence of Another Pig on Lying Patterns
The presence of another pig in an adjacent cell accounted for 53.85% of deviation in pig lying patterns, which indicates a potential issue of whether this is due to cause or effect. Signoret et al. [20] show that tactile stimuli are important to pigs and considerer them to be contact animals, especially when reared in groups and during periods of rest. Therefore, the pigs may have simply chosen their lying location because of the presence of another pig. However, throughout the period of monitoring, the pigs consistently chose to lie in a similar location each time they chose to rest. This could indicate that the majority of the pigs interpret the microclimate of these preferential areas to be the most thermally comfortable within each pen. Figures 9–12 FB scenario potentially provide an insight into the pig’s perception of thermal comfort. During the four chosen time scenarios studied, all the pigs generally chose to lie in the same location as the 12:00 WB scenario as shown in Figures 5, 6 and 8. During each of the time scenarios, the majority of the pigs preferred to lie closer to the central passageway rather than the perimeter wall. The exception was pen 7, where the pigs tended to migrate to the perimeter wall furthest away from the central passage.
Baldwin and Ingram [21] found that, when subjecting weaner pigs to cooler conditions below their thermoneutral zone (TZ), the pigs quickly learnt to press a switch with their snouts to obtain warmth from radiant heaters. Furthermore, the pigs reduced the use of the supplementary heating once the temperature reached 25°C, suggesting that they had reached their preferred TZ. The pigs within the current study had been in the pens for three weeks previous to the chosen scenario date. Therefore, it could be suggested, given their level of ability to solve environmental problems, that by simply being introduced to the pens and coping with the environmental factors forced upon them, there is potential for the pigs to have already determined their preferred area for rest by finding the area that best represents an environment closest to their TZ.
4.3. Effect of Climatic Variables on Lying Patterns
As well as proximity to another pig, other environmental elements, such as velocity, TED and structural elements such as being adjacent to a solid partition or perimeter wall or drinker were found to impact on the pig’s choice of where to lie, although collectively they only explained 4.71% of the total variation in lying patterns. However, excluding the effect of another pig in an adjacent cell, velocity and TED collectively accounted for the majority of the variation explained (15.39% out of the total of 17.13% deviation explained in lying location), whereas temperature was not found to be additionally significant in influencing the pigs to lie in a particular location. This might be due to the temperature amplitudes being too small and all temperatures lying within the thermo-neutral zone for the pigs. These findings are in line with observations of Ingram and Legge [22], that pigs prefer to spend most of their time at rest in areas of the lowest air velocity while displaying no tendency to select areas of different air temperatures. As seen in Equation (4), TED is partially reliant on dry bulb temperature; it is also reliant on velocity at any given point, which is probably why TED is proving to be an influence on where pigs choose to lie rather than temperature alone.
4.4. Effect of Pen Furniture on Lying Patterns
As mentioned in Section 4.2, pigs display a preference to lie adjacent to other pigs during times of rest, whilst results show that pigs were more likely to lie against solid partitions and perimeter walls, collectively explaining 1.26% of the total variation in lying patterns. There is potential for the first pig that chooses to lie to do so against a partition, due to there being no other available pig to lie adjacent to. However, as mentioned in Section 4.3, pigs tend to lie in the areas which produce the lowest air velocity [22], which throughout the pens observed are generally in the areas where there are solid partitions. In contrast, results show that open partitions had no influence in persuading the pigs to lie in the adjacent area, where air velocities can increase because the bars that make up the open partition would have little effect on restricting air movement.
These findings suggest that open pen partitions could be useful to deploy in parts of the pen as an aid to maintaining a defined dunging area. These results are also in line with those of Hacker et al. [4], where observations indicated that the use of open partitions resulted in dirtier pens than using solid partitions. However, in the finisher building used in the present study, the feed trough runs the length of the open partition for those pens in the East part of the room shown in Figure 2. The results from Table 1, indicating that pigs also chose not to lie within one, two or three cells of the feeder, and coefficients from Table 2, indicating that the presence of a feeder within one or two cells has a negative effect on pigs choosing to lie in that area, represent a confound between these two influences.
4.5. Evaluation of Results
Results demonstrate that the surrounding local air velocities, temperatures and partition type adjacent to the pig could influence a pig’s perception of thermal comfort. Whilst the information could potentially be used to determine the best location to provide a lying area, the data could also help in determining the best location for dunging areas, feeders and drinkers, and where to use solid or open partitions to best effect in determining functional areas. In contrast, current practice relies on industry experience and to some extent trial and error to indicate the optimal position within the pen to locate these specific facilities.
However, this method would benefit from further work on different scenario dates throughout the year, which could provide varying external ambient temperatures from the chosen average winter day in the UK 10th February 2015. Information gathered on scenarios with warmer typical days, i.e., spring and autumn days, could potentially confirm the results found in this study. There may come a point when the external temperature is higher than anticipated internal air temperature setpoint (approximately 21°C), therefore when combined with the resulting 292 pigs heat input into the room, the internal air temperature would be above the TZ for the pigs. This wider validation exercise would indicate the extent to which CFD modelling could be used prospectively in planning of building design across the range of annual conditions.
It needs to be noted that the results of this study are only valid for the exact pen design, breed and number of pigs and feeding regime. However, useful information was generated by this pilot exercise to indicate the value of the approach for future studies on the impact of design considerations.
5. Conclusions
In conclusion, the approach taken in this paper proved reliable in identifying environmental variability in those areas of the building that pigs consistently chose to lie in, and areas they chose to avoid. The study shows that CFD air velocity outputs could potentially provide the industry with a better understanding of where the pigs are likely to lie, even before the building is built and stocked. Furthermore, the CFD data could provide a more reliable means of establishing optimum layouts and position of furniture within the pen to promote pig welfare, productivity and feed conversion efficiency.
This article was originally published in Sustainability 2020,12, 1928; doi:10.3390/su12051928. This is an Open Access article distributed under the terms and conditions of the Creative Commons Attribution (CC BY) License (http://creativecommons.org/licenses/by/4.0/).