Explore
Communities in English
Advertise on Engormix

Transcriptome Alterations of an in vitro-Selected, Moderately Resistant, Two-Row Malting Barley in Response to 3ADON, 15ADON, and NIV Chemotypes of Fusarium graminearum

Published: February 16, 2024
By: James R. Tucker 1,2; William G. Legge 2; Sujit Maiti 1,2; Colin W. Hiebert 3; Senay Simsek 4; Zhen Yao 3; Wayne Xu 3; Ana Badea 1,2; and W. G. Dilantha Fernando 1 / 1 Department of Plant Science, University of Manitoba, Winnipeg, MB, Canada; 2 Brandon Research and Development Centre, Agriculture and Agri-Food Canada, Brandon, MB, Canada; 3 Morden Research and Development Centre, Agriculture and Agri-Food Canada, Morden, MB, Canada; 4 Department of Plant Science, North Dakota State University, Fargo, ND, USA
Summary

Fusarium head blight caused by Fusarium graminearum is a devastating disease of malting barley. Mycotoxins associated with contaminated grain can be transferred from malt to beer and pose a health risk to consumers. In western Canada, F. graminearum has undergone an adaptive shift from 15ADON constituency to dominance by virulent 3ADON-producers; likewise, NIV-producers have established in regions of southern United States. Lack of adapted resistance sources with adequate malting quality has promoted the use of alternative breeding methodologies, such as in vitro selection. We studied the low-deoxynivalenol characteristic of in vitro selected, two-row malting barley variety “Norman” by RNAseq in contrast to its parental line “CDC Kendall,” when infected by 15ADON-, 3ADON-, and NIV-producing isolates of F. graminearum. The current study documents higher mycotoxin accumulation by 3ADON isolates, thereby representing increased threat to barley production. At 72–96-h post infection, significant alterations in transcription patterns were observed in both varieties with pronounced upregulation of the phenylpropanoid pathway and detoxification gene categories (UGT, GST, CyP450, and ABC), particularly in 3ADON treatment. Defense response was multitiered, where differential expression in “Norman” associated with antimicrobial peptides (thionin 2.1, defensing, non-specific lipid-transfer protein) and stress-related proteins, such as late embryogenesis abundant proteins, heat-shock, desiccation related, and a peroxidase (HvPrx5). Several gene targets identified in “Norman” would be useful for application of breeding varieties with reduced deoxynivalenol content.

Keywords: malt, Fusarium head blight, Fusarium graminearum, RNA-Seq, in vitro selection, deoxynivalenol.

INTRODUCTION

Fusarium head blight (FHB), caused by Fusarium graminearum Schwabe [teleomorph: Gibberella zeae (Schwein.) Petch], is an economically important disease of barley (Hordeum vulgare L.) that has resulted in massive commercial losses (Wilson et al., 2018). F. graminearum is capable of producing multiple, type B trichothecene mycotoxins [Deoxynivalenol (DON), 3-acetyldeoxynivalenol (3ADON), 15-acetyldeoxynivalenol (15ADON), nivalenol (NIV), and 4-acetylnivalenol (4-ANIV)], which can be commonly detected in contaminated grain (Miller et al., 1991). Type B trichothecenes are harmful to eukaryotic organisms through interference of ribosomal function and protein translation (Desjardins, 2006). Mycotoxin content in grain is highly scrutinized by the malting and brewing industries due to their potential human health concerns. Arising from their water-soluble nature, mycotoxins, such as DON, can be transferred from malt to beer (Habler et al., 2017), which may be of elevated concern for the increasingly popular all-malt, craft brewing industry (Peters et al., 2017). Extremely strict, industrial limits on mycotoxins (< 0.5 mg kg−1) commonly result in loss of premiums, which would be received below prime sale value in the lucrative malting barley market.
Immune reaction has not been reported within barley, and resistance sources are extremely limited (Bai and Shaner, 2004). Furthermore, resistance breeding of malting barley through back-cross methodologies has been difficult due to strict requirements of numerous quality parameters. In vitro selection (IVS) of somaclonal variations, which employs tissue culture and growth media, containing selective agents, offers an alternative option, for example, to rapidly improve disease resistance in crops without linkage drag (Rao and Sandhya, 2016). This method is an acceptable biotechnological tool based on changes resulting from internal variations/mutations. Examples of IVS, using fusaric acid or mycotoxins as selective agents in barley (Chawla and Wenzel, 1987) and wheat (Eudes et al., 2008) have been reported. “Norman” is an IVS two-row, malting variety developed via anther culture, using media, containing 1.71- mg kg−1 DON, which displays reduced DON accumulation, without change in agronomics and malting quality. Based on DON content, it was evaluated with a moderately resistant reaction to FHB in the Western Cooperative Two-Row Barley Registration Test in 2005 and 2006, as part of the western Canadian registration recommending process under the auspices of the Prairie Registration Recommending Committee for Oat and Barley (Legge et al., 2011).
Several studies on wheat have indicated that 3ADONproducers are more aggressive and generally produce more DON than 15ADON-producers (Ward et al., 2008; Puri and Zhong, 2010; von der Ohe et al., 2010). Field-based studies of barley correlate 3ADON with higher DON content, implicating chemotype-associated virulence (Clear et al., 2013; Tucker et al., 2019). In a pan-genome study of 60 North American F. graminearum isolates, Kelly and Ward (2018) confirmed signatures of selection in the TRI (trichothecene) gene cluster region, signifying importance of this region in genomic divergence. Moreover, analysis of gene expression through RNA-sequencing (RNA-Seq) further demonstrated differential gene expression between 3ADON and 15ADONproducers, notably in metabolic function and trichothecene production (Walkowiak et al., 2015; Puri et al., 2016). Amarasinghe and Fernando (2016) observed elevated TRI gene expression in 3ADON-producers in contrast to 15ADON or NIV strains during infection of wheat. Al-Taweel et al. (2014) documented differential transcription patterns in wheat challenged by 15ADON or 3ADON strains, where 3ADONproducers suppressed host resistances. Comparative studies can help elucidate underlying mechanisms of aggressiveness and contribute toward understanding of plant defense response.
Fusarium graminearum displays a complex lifestyle (hemibiotrophism), where it initially lives in a biotrophic stage, asymptomatically within the apoplast for a few days, followed by a prolific stage under a switch to necrotrophy accompanied by elevated mycotoxins used to kill host tissues for consumption (Trail, 2009). DON is not essential for infection, as demonstrated by loss-of-function trichothecene non-producing mutants (TRI5-), which are still capable of infecting barley (Jansen et al., 2005; Boddu et al., 2007). Yet, DON is a virulence factor where DON-expressing wild-type strains cause higher disease severity than TRI5- mutants (Boddu et al., 2007). A critical phase of host-response occurs at ∼72 h post-infection (hpi), associated with an upsurge in the rate of DON production (Boddu et al., 2006, 2007). Study of F. graminearum displays a reciprocal peak of gene activity at 72 hpi, where genes of cell wall-degrading enzymes and trichothecene biosynthesis are highly expressed (Güldener et al., 2006). This unique phase of host–pathogen interaction is distinguished by pathogen transition to necrotrophy.
While quantitative disease resistance may contribute to deployment of durable varieties, this form of resistance remains poorly understood (Poland et al., 2009). Herein, we study complex disease resistance through contrast of moderately resistant (MR) variety “Norman” to its parent line “CDC Kendall” (intermediately resistant, MR-MS), which carries both resistant and susceptible features. Compared with major-gene resistance, less is known about mechanisms of quantitatively inherited disease resistance. The transcriptome differentiation landscape would provide insight into the FHB resistance responses. Although in recent years, RNA-Seq has become a powerful tool for identification of genes associated with differential transcription patterns (Wang et al., 2009), this technology has not yet been applied to analyze the resistance response of two-row barley to F. graminearum. The objective of this study was to detect and quantify transcriptional differences between moderately resistant, IVS variety “Norman,” and its intermediately resistant parent variety “CDC Kendall” when challenged by differentially virulent F. graminearum chemotypes. Together, the study provides insight into expression of genomic features of DON resistance in “Norman” and its interaction with pathogens characterized by differential production of secondary metabolites, such as trichothecenes.

MATERIALS AND METHODS

Long-Term DON Content Evaluation of “Norman” vs. “CDC Kendall”

The varieties evaluated in this study were: “Norman” and “CDC Kendall.” “Norman” is an IVS variety developed under joint release between Agriculture and Agri-Food Canada, Brandon Research and Development Centre (AAFC-Brandon) and Crop Development Centre (CDC), University of Saskatchewan (Legge et al., 2011). “Norman” was derived from “CDC Kendall,” a malting variety developed by CDC1 The data used for this evaluation were generated during a 20-year period, 2001–2020. Briefly, the varieties were grown in 0.9-m rows in an irrigated FHB nursery at AAFC-Brandon, MB, as outlined in Legge et al. (2011). DON content was determined on 20-g subsample of matured grain was ground, using a Perten 3600 laboratory mill. From this, a 1-g sample was used in assay of DON content determination, following the enzyme-linked immunosorbent assay (ELISA) method (Sinha and Savard, 1996). Least squares means were calculated for DON content of each variety within site year. To normalize data, a logarithmic transformation (LOG10) was applied to the DON data prior to analysis. A matched pairs procedure was applied to test for mean difference of DON content between varieties (SAS JMP R 13.2.1, SAS Institute Inc. Cary, NC, USA, SAS Institute Inc, 1989-2019).

Genotyping

Approximately 100 mg of fresh leaf tissue was sampled from seedlings of each variety, flash frozen in liquid N2, and then freeze-dried. DNA was extracted, using Qiagen, DNeasy 96 Plant Kit (Qiagen, Canada), as per the handbook of the manufacturer and then normalized to 50 ul ml−1. Samples were genotyped with an Illumina iScan (Illumina, San Diego, CA, USA), using an Infinium HTS iSelect−50 K SNP custom microarray (Bayer et al., 2017). Chromosome graphics were produced, using R package “chromoMap” (Anand and Rodriguez Lopez, 2020).

Fungal Cultures

Three chemotypes were chosen to be used in this study: 15ADON, 3ADON, and NIV, with four single-spore isolates per chemotype group. The F. graminearum isolates were obtained from the Department of Plant Science, University of Manitoba and AAFC-Brandon. Chemotypes of isolates were determined by TRI3 and TRI12 gene-specific PCR assays as detailed by Amarasinghe et al. (2019) (Supplementary Figure 1). Isolates were initially grown on 10-cm diameter potato-dextrose agar (PDA) solid growth media plates and grown to capacity (16- h light: 8-h dark) at 20◦C over 2 weeks. For production of liquid media, tomatoes were cut into 1-cm3 cubes, and 900 g were placed in 9 L of distilled water for 3 h and then strained through cheesecloth. Fifteen grams of NaCl l−1 were dissolved in the filtrate and autoclaved for 20 min. One PDA culture plate from each isolate was cut into 1-cm3 cubes, added to 500 ml of suspension in 1 l flasks and agitated on an orbital shaker for 2 weeks under natural light at room temperature. The suspension was strained through cheesecloth, and then conidia spores were counted under 40X magnification, using a hemocytometer.

Growth Cabinet—Experimental Design

For “Norman” and “CDC Kendall,” two seeds of same source were planted per pot (a 20-cm diameter; 30-cm depth), containing a Pro-Mix Mycorrhizae growing medium (Premier Horticulture Inc., Quakertown, PA, USA) and 15 g of slowrelease granular fertilizer (18-6-8 NPK). One plant was removed from each pot, following germination. Plants were grown in a growth chamber (16-h light: 8-h dark) at an 18◦C cycle. Starting at the fourth week post-seeding, plants were fertilized with 20 g l−1 of (20-20-20 NPK) and every 2 weeks thereafter.
Macroconidia suspensions of F. graminearum were diluted to 5 × 10⁴ spores ml−1 and mixed by chemotype with Tween20 R at 0.2% vol/vol. Mock inoculation treatment included identical suspension treatment but excluded fungus. Once spikes had emerged, 75% three spikes were gently removed from the leaf sheath and entirely sprayed on either side until run-off, using an atomizer under 70 kPa of pressure. Following inoculation, spikes were covered by a translucent glycine bag for up to 96 h.
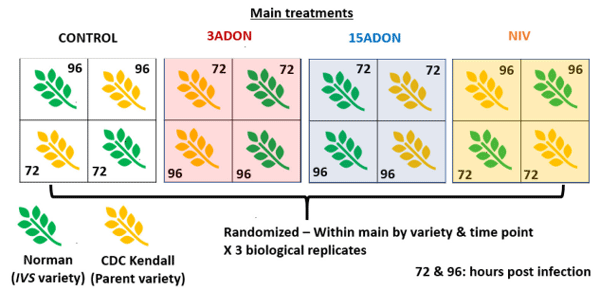
A total of three biological replicates were grown per treatment and time point. Pots were arranged in the growth cabinet in a split-plot design where the treatment group (3ADON, 15ADON, NIV, or Mock inoculated) represented the main plot treatment (Figure 1). Within each main treatment, pots were completely randomized for position of variety and time point sampling (72 or 96 hpi). All plants were grown together in the same chamber. For both time points (72 or 96 hpi), spikes were cut at the peduncle at the same time of the day, wrapped in aluminum foil and flash frozen by submerging in liquid N2 and then held at −80◦C until processed further. Remaining spikes were rated for proportion of diseased kernels at 3 weeks post-infection (diseased kernels/total kernels, Supplementary Figure 2). Plants were grown to maturity in the growth cabinet, after which spikes were harvested for mycotoxin assay. All kernels from two spikes per variety/treatment/replicate were grounded into flour together, using a handheld coffee grinder and then subsampled to 1 g. All mycotoxins were assayed at North Dakota State University by gas chromatography—mass spectrometry (GCMS) or in case of deoxynivalenol-3-O-glucoside (DON3G) by quad time of flight (QTOF).

Statistical Analysis of FHB and Mycotoxin Content
Data were analyzed by generalized linear mixed model (GLMM) approach. Proportion of Fusarium damaged kernels (FDK) was analyzed by PROC GLIMMIX in SAS R 9.4 (SAS Institute Inc., Cary, NC, USA, SAS R 9.4, SAS Institute Inc, 2013) by using a beta distribution and logit link function to test for significant differences in the proportion FDK. Likewise, PROC GLIMMIX was used to test for differences in mycotoxin content, under lognormal distribution identity link function. Variety and chemotype treatment were considered fixed, while replicate was considered a random factor. Tukey-Kramer honestly significant difference was used to test all pairwise contrasts.
FIGURE 1 | Split-plot experimental design. Main plot treatments: Control, mock control; 3ADON, 3-acetyldeoxynivalenol producer; 15ADON, 15-acetyldeoxynivalenol producer; NIV, nivalenol producer. Genotype (Norman or CDC Kendall) and sampling time point (72- and 96-h post infection) were randomized within the main plot.

Total RNA Extraction and Quality

Spikes were removed from the freezer, and six kernels from the mid-spike region were rapidly dissected from the rachis, pooled, and grounded to powder under liquid N2 via mortar and a pestle. Total RNA was isolated by the RNAeasy Plant Mini Kit (Qiagen, Canada) as per instructions of the manufacturer. A total of 100 mg of sample powder was used as input, followed by RLT buffer protocol. Total RNA was first checked for quality control and determining the purity of samples, using a 2100 Agilent BioanalyzerTM (Agilent Technologies, Santa Clara, CA, USA), where RIN scores of > 7.5 were accepted.

RNA-Seq Library Preparation and Sequencing and Quality

The cDNA libraries were constructed with Illumina TruSeq RNA v3 adaptors, using the Illumina first-strand TruSeq R mRNA library Prep Kit (Illumina, San Diego, CA) protocol as per instructions of the manufacturer. Briefly, this method purifies poly (A) mRNA from total RNA through applications of oligo (dT)-attached magnetic beads, followed by cDNA synthesis. Samples were sequenced on an Illumina HiSeq 4000 platform (100 bp paired-end) libraries. RNA-sequencing was conducted at the Centre de Services et d’Expertises Génome Québec (Montréal, QC, Canada). Fastq files for each sample were evaluated on an individual basis, using FastQC v0.11.5 software via visual graphic inspection (Andrews, 2010). Raw data were processed, using Trimmomatic v0.36 software (Bolger et al., 2014) to remove adaptors and trim low-quality reads.

Sequence Alignment and Genomic Feature Evaluation

The IBSC_v2 (International Barley Sequencing Consortium) release of the barley reference genome (Mascher et al., 2017) and GTF file structural high confidence (HC) gene predictions assembly were downloaded through file transfer protocol (FTP) from Institute of Plant Genetics and Crop Plant Research (IPK) Gatersleben HISAT2 v2.0.4 software (Kim et al., 2015) was used to map clean reads to the reference genome (Supplementary Table 1).
Software package StringTie (Pertea et al., 2015) was utilized to approximate the gene expression levels in each sample from the BAM files. StringTie-merge procedure was used to input and combine lists of transcripts aligned to reference gene annotation list and newly assembled genes/transcripts. After the HC genes and new assembled genes/transcripts were merged, the expression and the coverage at all these annotations were estimated. Coverage was converted to raw reads counts by a python script within a StringTie package. In order to annotate those newly assembled genes by StringTie, the protein sequences were extracted in a fasta format from the genome reference, using gene coordinates by a pearl script. The protein fasta files were searched against a local NCBI nr database by the blastp program. A total of 52,266 genomic features were included in the gene matrix for expression analysis.
Package “edgeR” (Robinson et al., 2010) within the R statistical environment (R Core Team, 2020) was used for group comparison statistical analyses. The raw read counts of all samples were loaded as a gene matrix into “edgeR” and normalized. Factors included: genotype (“Norman” vs. “CDC Kendall”), treatment (Mock, 15ADON, 3ADON or NIV), and time (72 or 96 hpi). Generalized linear models (Appendix A) were applied both as: (i) pairwise single-factor contrasts or (ii) additive model design (a three-factor model with interaction) via likelihood ratio test (LRT). Identified differentially expressed genes (DEG) were examined regarding log-fold change, counts per million and significance. Genes were determined to be significantly differentially expressed if they had a log2-fold change > 1 or < −1 and false discovery rate (FDR ≤ 0.05). Gene interactions of DEGs between groups were examined, using Venn diagrams, using a web-based tool.
Gene ontology annotation files were downloaded from IPK Gatersleben via FTP Genes were assigned GO terms under categories: a biological process, cellular component, or molecular function. Significant GO terms (FDR ≤ 0.05) in each contrast were identified through GO enrichment analysis, using AgriGO v2.0 (Tian et al., 2017). ShinyGO v0.61 software (Ge et al., 2020) was used to visually evaluate relationships of DEGs in hierarchical clustering tree graphics for significant pathways where networks of GO terms were mapping, using Arabidopsis thaliana STRING-db v.10 with a.2 edge cut-off.

RESULTS

Norman and Its Response to DON Accumulation
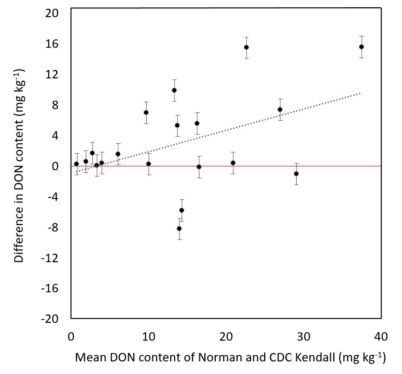
“Norman” demonstrated a significant reduction of DON content in contrast with “CDC Kendall” (P = 0.013). “Norman” possessed lower DON content than “CDC Kendall” in most years [79% (15/19), averages not shown] of evaluation. DON levels varied considerably over years, ranging 6–45 mg kg−1. Reduction of DON levels in “Norman” was most prominent in epidemic years characterized with high-DON production (> 10 mg kg−1; Figure 2).
The proportion of FDKs was subjected to analysis of variance. No difference in visual disease symptoms was observed between “Norman” and “CDC Kendall” (P = 0.803, Supplementary Table 2). The proportion of FDK was significantly affected by chemotype treatment (P = 0.015), without interaction between variety and chemotype treatment (P = 0.64). The 3ADON treatment showed highest disease severity (%) at 29.8 ± 4.7, followed by NIV treatment at 18.9 ± 3.0 and 15ADON treatment at 13.3 ± 3.3 (Supplementary Figure 3). Tukey-Kramer group separation indicated that 3ADON treatment was found to display higher disease than 15ADON, but not NIV (Supplementary Table 2). Likewise, 15ADON did not differ from NIV treatment.
The 3ADON strain demonstrated significantly elevated overall mycotoxin levels in contrast with 15ADON and NIV chemotypes (Table 1). The 3ADON chemotype produced 10- fold increase of a toxin in contrast with the alternative chemotypes, where treatment was significant (P = 0.01, Supplementary Table 3). The 15ADON and NIV chemotype produced similar levels of mycotoxin, respectively, i.e., DON = 27.4 ± 8.6 mg kg−1; NIV = 39.5 ± 9.5 mg kg−1. Effects of variety and interaction term variety x treatment were nonsignificant (P > 0.05). The ratio of DON3G/DON trended higher in 15ADON (0.27 ± 0.1) vs. 3ADON (0.19 ± 0.1) chemotype, but this was non-significant (P > 0.05). The ratio did not differ between varieties within 15ADON or 3ADON treatment (P > 0.05). Comparison of SNP markers of 50K SNP array between “Norman” and “CDC Kendall” revealed overall a high similarity (98% SNP marker allele agreement, Supplementary Table 4). Distributions of SNP variants were examined, where regions of three chromosomes were identified: chromosome 1H: (483–512 Mb); intermittently over regions of chromosomes 4H (600–616 Mb) and 5H (621–630 Mb). Variant regions were observed on both short and long arms of chromosome 7H at multiple positions (Supplementary Figure 4).
FIGURE 2 | Difference in deoxynivalenol (DON) content (mg kg−1) of moderately resistant “Norman” in head-to-head contrast with “CDC Kendall” over 19 site years tested in an artificially inoculated disease nursery at Brandon, MB, displayed in order of mean DON content of “Norman” and “CDC Kendall.” Error bars represent standard error of difference.
FIGURE 2 | Difference in deoxynivalenol (DON) content (mg kg−1 ) of moderately resistant “Norman” in head-to-head contrast with “CDC Kendall” over 19 site years tested in an artificially inoculated disease nursery at Brandon, MB, displayed in order of mean DON content of “Norman” and “CDC Kendall.” Error bars represent standard error of difference.

Transcriptome Differentiations

On average, the sequencing produced 64 × 106 reads per library (Supplementary Figure 5). Following trimming, an average of 90% of cleaned reads per sample mapped to the IBSC_v2 reference genome (Supplementary Table 1). Graphics produced by FastQC indicated that all sample libraries passed quality standards (Supplementary Figure 6).

Differential Genes of CDC Kendall

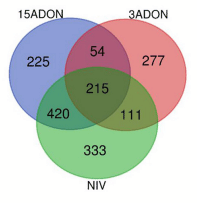
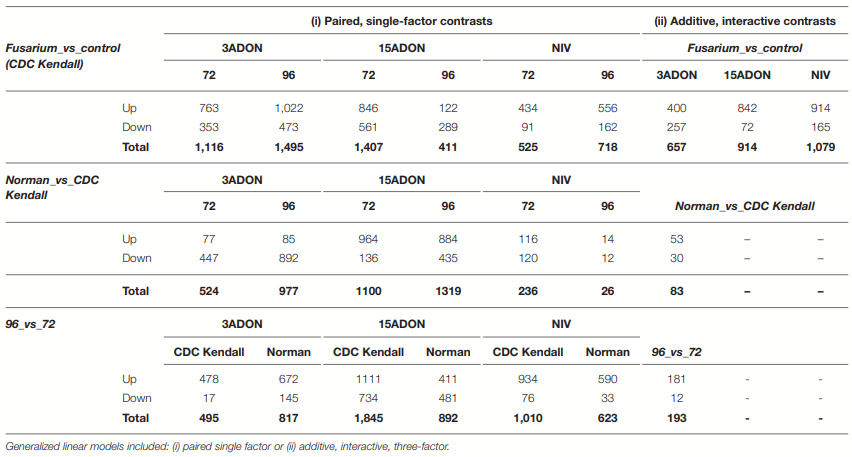
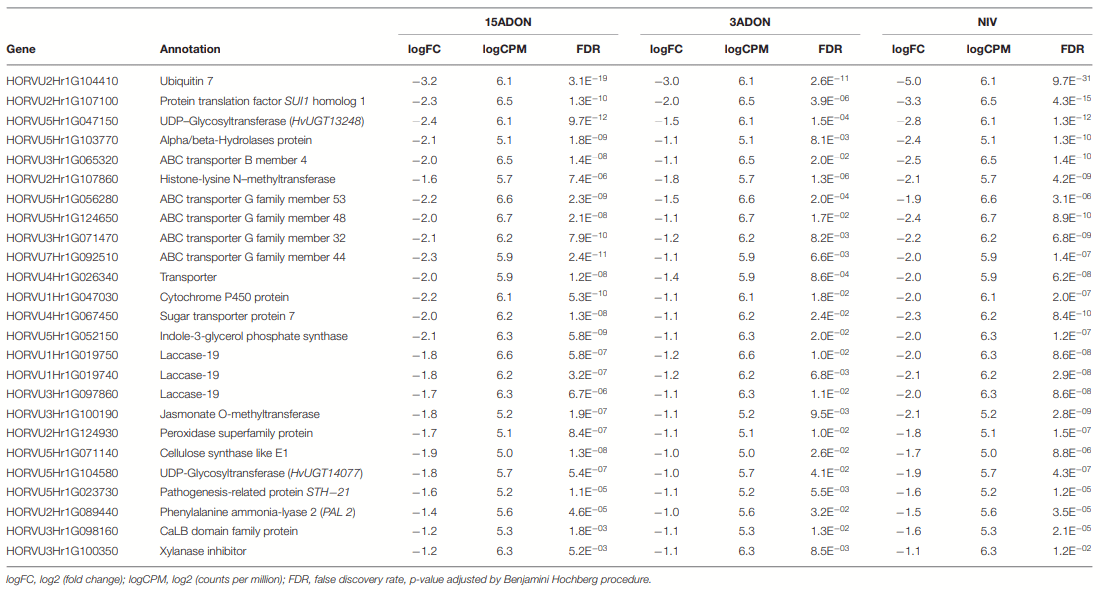
As summarized in Table 2, overall, a total of 2,973 unique DEGs were identified through contrasts of all Fusarium treatments (3ADON, 15ADON, NIV) to a respective control group over both time points (72, 96 hpi). Analyses under three-factor additive GLMs for Fusarium-treatment groups were conducted to contrast Fusarium-treatment groups with the mock control group. Differentially expressed genes (1,635 total unique DEGs) were identified for the three Fusarium treatment groups. On examination, groups of Fusariumresponsive DEGs (215) with shared expression patterns were identified for all Fusarium treatments (Treatment intersection−15ADONT 3ADONT NIV; Figure 3), indicating common response in gene groups. A selection of DEGs commonly induced in the Fusarium treatments was displayed (Table 3).
TABLE 1 | Mean ± standard error of mycotoxin content of matured barley grains for grains harvested from growth cabinet study (replication, n = 3).
TABLE 2 | Numbers of differentially expressed genes (FDR < 0.05) by chemotype for contrasts: CDC Kendall vs. control; Norman vs. CDC Kendall over time and 72 vs. 96 h post-infection (hpi).
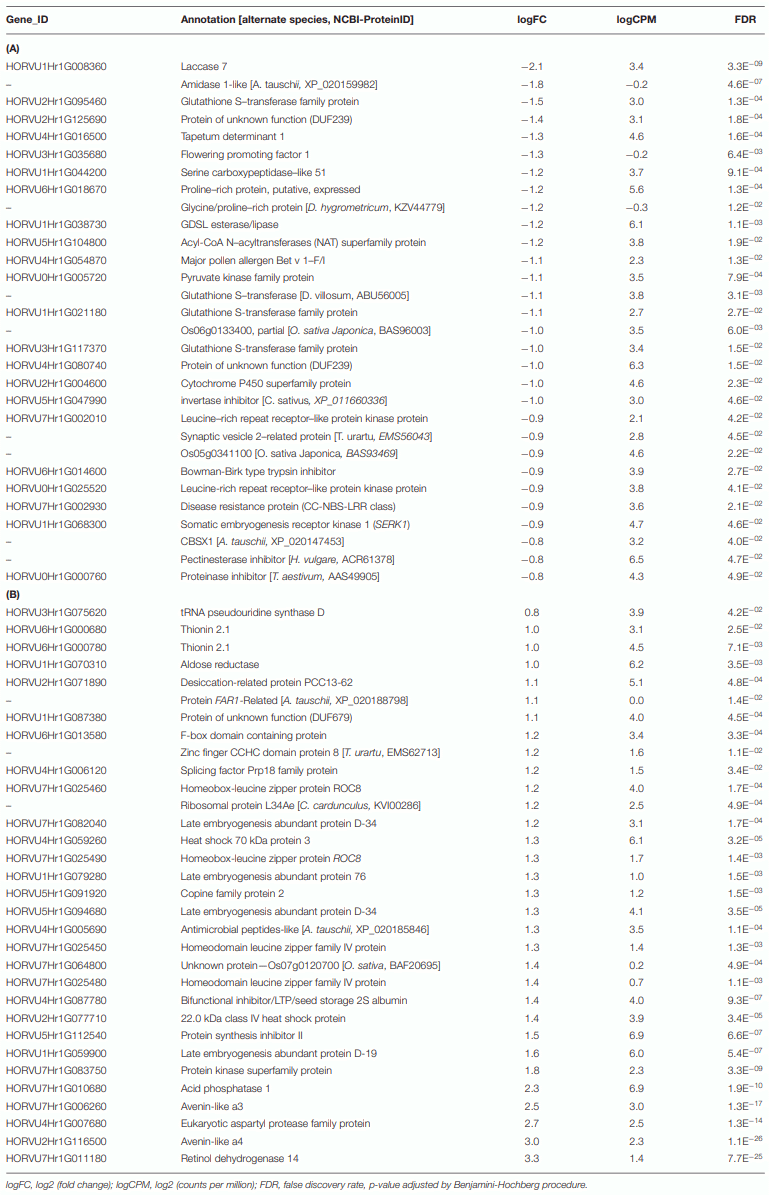
The additive interactive model identified 30 DEGs associated with “CDC Kendall” in contrast with “Norman,” which were characterized by patterns of a generalized resistance motif. “CDC Kendall” displayed predominant response in detoxification resistance (Tables 2, 4A). These genes were largely involved in defense response and intensified at 96 hpi. Genes associated with the JA/ETH pathway were elevated, including lipolytic enzyme GDSL esterase/lipase and augmented lignification response via lacasse 7. Several genes of oxidativestress response were identified: GST (glutathione S-transferase), CyP450 (Cytochrome P450), and CBSX1 (chloroplastic, redox homeostasis). Two DUF239 carboxyl-terminal proteinase-like proteins were differentially expressed (putative DD1A—receptor death domain protein (Oryza sativajaponica group)], involved in the phagocytosis of apoptotic cells). DEGs were identified associated with PR protein major pollen allergen Bet v 1 (PR10). Two Bowman-Birk type trypsin inhibitors were identified. Differential expression patterns were displayed for receptor genes involved in pathogen recognition.

Differential Genes of Norman

A total of 53 DEGs associated with “Norman” were identified through the additive interactive model (Tables 2, 4B). This group of genes, which were strongly expressed in a pattern earlier in “Norman” at 72 hpi and, particularly, in the 15ADON treatment. DEGs, including numerous abscisic acid (ABA) stress-responsive proteins; late embryogenesis abundance (LEA), heat-shock, desiccation related; Aldose reductase (HORVU1Hr1G070310). Multiple antifungal defenses of PR proteins were induced earlier in “Norman” at 72 hpi, including thionin 2.1 (PR13), defensin-like protein (PR12), bifunctional inhibitor/lipidtransfer protein/seed storage 2S albumin superfamily protein (PR14), protein synthesis inhibitor II (ribosome-inactivating— rRNA N-glycosidase), HORVU4Hr1G005690 (antimicrobial peptide A. tauschii homolog), and glucan endo-1,3-betaglucosidase GI (PR2). Differential response was also observed in a xylanase inhibitor.
FIGURE 3 | A Venn diagram of differentially expressed genes (FDR ≥ 0.05) for contrasts of Fusarium treatment (3ADON, 15ADON, and NIV chemotypes) vs. mock control under the additive generalized linear model (GLM).

Norman vs. CDC Kendall Control

A total of 473 and 580 DEGs were observed at 72 and 96 hps (hours post sprayed), respectively. Several genes appeared to be constitutively expressed earlier in “Norman,” including peroxidase class III BP1 (HvPrx5); ascorbate peroxidase (HORVU2Hr1G009940), cathepsin B-like cysteine, subtilisinlike protease and chymotrypsin inhibitor, serpin (Z7), C-hordein, vicilin (HORVU5Hr1G104630) and germin-like protein (HORVU3Hr1G011990, PR15), LEA protein HvA1 heat-shock protein, and disease-resistance proteins.

Differential Genes Between Norman and CDC Kendall by Treatment and Time Point

Paired contrasts from single-factor GLM were conducted between the two genotypes within Fusarium-treatments and at both time points. Total DEGs identified between “Norman” and “CDC Kendall” ranged from only 26 for NIV at 96 hpi to 1,319 for 15ADON at 96 hpi (Table 2). Under the three-factor additive GLM model, an overall total of 83 DEGs were identified between varieties (Table 2). Variance associated with a genotype was minimal compared to Fusarium treatments and/or time, as might be predicted for varieties sharing 98% of their genetic code (Supplementary Table 4, Supplementary Figure 4). However, a complex resistance response occurred where resistance factors were expressed in either variety, with differences observed over treatment and time.

Contrast 72 vs. 96-h Post-infection

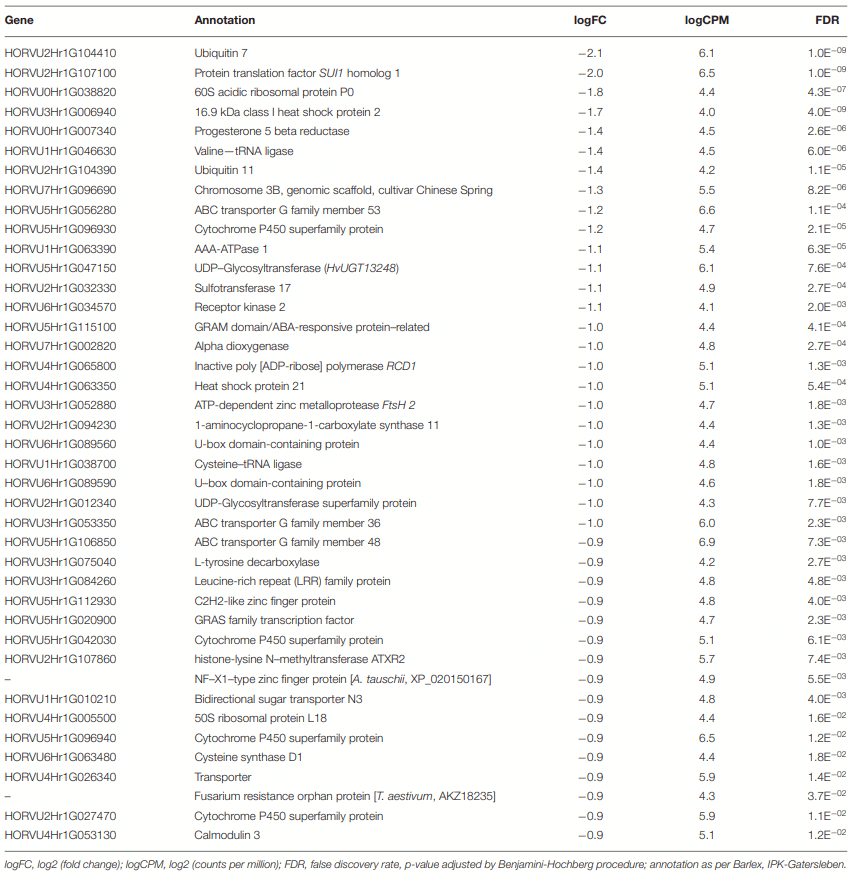
Patterns of temporal gene expression were observed in both varieties. Paired contrasts (72 vs. 96 hpi) for single-factor GLM were conducted within “Norman” and “CDC Kendall.” DEGs where identified within each treatment group (Table 2). Dominant patterns of elevated gene expressions over time were observed in 3ADON and more so within NIV treatments, while more balance was observed in the 15ADON treatment. Under the three-factor additive GLM for 72 vs. 96-treatment contrast patterns indicated intensification of gene response over time, where a total of 193 DEGs were identified which were principally upregulated (Table 2). A selection of DEGs, which increased over time, is displayed in Table 5.
Elevated patterns of upregulation were observed at 96 hpi for genes associated with Fusarium reaction, including trichothecene detoxification and oxidative stress response. Extreme elevations of gene expressions were seen in ABCs (ATPbinding cassette transporters), CyP450s (Cytochrome P450s), GSTs (glutathione S-transferases), sugar transporters, and UGTs (UDP-glucuronosyltransferases) (Figures 4I–IV). Upregulation was observed in peroxidases, LEAs, LOXs, and subtilisin-like protease (HORVU7Hr1G024930). Promoter sequences of DEGs identified gibberellin-regulated transcription factor Gamyb of the Myb/SANT family were a significantly enriched motif over time (FDR = 0.04). Intensive expression of genes occurred in “CDC Kendall” under the 3ADON treatment, where many DON-responsive genes were elevated by an order of magnitude at 96 hpi. Pathogen recognition increased over time marked by increased expressions in LRR proteins, MAPKKKs, protein kinases, calmodulin Ca2+ binding protein, and numerous WRKY transcription factors, including WRKY’s 33, 50, and 75. Alternations in transcriptional patterns were evidenced by heightened expression of ubiquitination, a translation initiation factor, splicing factor Prp18 family, and ribosomal proteins. Many genes, initially lowly expressed in the NIV treatment at 72 hpi, demonstrated a significant upsurge in both varieties by 96 hpi.

Unique Resistance Patterns Were Observed in Norman in 15ADON Treatment at 72 hpi

DEGs of “Norman” expressed at 72 hpi within the 15ADON treatment were associated with nutrient reservoir activity of storage proteins and defense response. Genes of this kind were not transcribed in “CDC Kendall” at 72 hpi but were expressed later at 96 hpi. Defense response to pathogen cell wall digestive enzymes was seen in xylanase inhibitors. Defense in “Norman” was expressed via multiple protease inhibitors: Serine protease inhibitors: serpin (Z4 and Z7 families), subtilisin-chymotrypsin inhibitors (CI-1A and CI-1B), alphaamylase inhibitor 28, and metallocarboxypeptidase inhibitor. Plant toxins expressed, such as protein synthesis inhibitor II (HORVU5Hr1G112540), rRNA N-glycosidase (ribosomeinactivating, ricin A-chain activity). Multiple RNases were observed, which could act to repress fungal effectors. Expression was observed in pathogen responsive proteins with antifungal activity, including defensin-like protein, thionin 2.1, and chitinbinding metabolite agglutinin isolectin 3. Auxin-related genes were enhanced in “Norman” at 72 hpi, as indicated by upregulation of multiple tryptophan aminotransferase-related protein 1 (TAR1) genes. Many senescence-associated proteins showed elevated response. Also observed was high expression in ribose-binding protein 1 homolog.
TABLE 3 | Transcript alterations in select upregulated genes expressed within Fusarium graminearum chemotype:15ADON, 3ADON, and NIV treatments contrasted with mock control identified in the additive, interactive generalized linear model.
TABLE 4 | (A) Transcript alterations in genes differentially expressed in “CDC Kendall” identified in the additive, interactive generalized linear model. (B) Transcript alterations in genes differentially expressed in “Norman” identified in the additive, interactive generalized linear model.
Lower expression was seen in “Norman” for gibberellin receptor GID1 (HORVU1Hr1G060810, gibberellin insensitive dwarf), which binds to gibberellins to facilitate GID1-DELLA complexing and subsequent degradation via ubiquitination. DELLA protein scarecrow-like 5 (HORVU3Hr1G058100, Sln1-like) was differentially expressed earlier in “Norman.” Numerous ABA stress-related genes were induced, including LEA proteins [HORVU1Hr1G058400, HORVU1Hr1G079290 (HVA1), HORVU2Hr1G099870, HORVU4Hr1G051780, HORVU4Hr1G073120]; laccase 7 (HORVU2Hr1G002440); Dehydrin 6 (HORVU4Hr1G010750, HORVU6Hr1G084070); Dehydrogenase/reductase SDR 4 (HORVU1Hr1G018140, retinol dehydrogenase); heat shock protein [HORVU3Hr1G020500 (17.6 kDa class II), HORVU4Hr1G059260 (70 kDa protein 3)]; thioredoxin 2 (HORVU6Hr1G078960, mitochrondrial ROS homeostasis); peroxidase superfamily protein (HORVU4Hr1G022280). Significant increase was seen in nutrient storage-related proteins like cupin seed storage proteins, including vicilin-like antimicrobial peptides (HORVU4Hr1G050210, HORVU4Hr1G070970, HORVU5Hr1G104630), globulin-2 (HORVU4Hr1G002800), triticin, and germin-like proteins (HORVU5Hr1G010880, HORVU6Hr1G089570, PR15) (Supplementary Figure 7).

3ADON Treatment at 72 hpi

Under infection by the more virulent 3ADON isolate group, “Norman” and “CDC Kendall” also displayed differential response patterns. Numerous resistance-responsive genes demonstrated higher expression in “CDC Kendall” than “Norman.” Elevated gene expression in “CDC Kendall” in phenylalanine ammonia-lyase (PAL) genes. Elevations were observed in UGT 74F1 (HORVU2Hr1G012280), which may conjugate glucose to salicylic acid (SA), thereby inactivating it. The Octadecanoid pathway was prominent along with many JA-related metabolite genes: Lipoxygenases (LOX2, LOX3, and LOX6), Lipase/lipoxygenase—PLAT/LH2 proteins, Patalin-like protein 5 (HORVU4Hr1G075070), Allene oxide synthase (AOS), and Jasmonate O-methyltransferase (MeJA). Extremely high levels of 12-oxophytodienoate reductase (OPR2) was observed in “CDC Kendall” at 72 hpi in contrast with “Norman.”
Tryptophan metabolism was indicated by anthranilate synthase component 1 (HORVU4Hr1G061120) and tryptophan synthase beta chain 1 (HORVU7Hr1G073460). Defenserelated genes were congruently expressed: Thaumatin-like pathogenesis-related proteins (PR5), cysteine-rich venom protein, and allergen V5/Tpx-1-related protein (PRB1-2). Also, defense response was seen in chitinases (PR3), woundinduced protein (HORVU3Hr1G113120, wheatwin-2), and pathogenesis-related protein (PR10). Cell wall fortification was evident in upregulated lignification via laccase-19, peroxidases (HORVU2Hr1G026450, HORVU3Hr1G074960), cellulose synthase-like D3 (HORVU1Hr1G022900), and extension (hydroxyproline-rich glycoproteins). Detoxification response was enhanced by ABC transporters and UGT gene HvUGT13248.
While robust gene expressions were observed in “CDC Kendall,” similar defenses also occurred in “Norman” in the 3ADON treatment at 72 hpi where elevated genes expressions unique to “Norman” included chromosome 3B, genomic scaffold, cultivar Chinese spring (HORVU7Hr1G006250, LEA protein wheat homolog), CyP450 (HORVU4Hr1G083930, 86B1 family involved in very long chain fatty acids omegahydroxylation), glucan endo-1,3-beta-glucosidase GI (PR2), and peroxidase BP1 (HvPrx5). “Norman” demonstrated relatively higher expression in specific JA-induced proteins: 60 kDa—rRNA N-glycosidase; 32.7 kDa dirigent proteins and defensin-like protein (HORVU4Hr1G082400, PR12). Stress response was observed in upregulation of calcium-dependent lipid-binding protein (HORVU3Hr1G098160, CaLB domain) and response in homolog Fusarium resistance orphan protein, TaFROG (TraesCS4A02G20190)
TABLE 5 | Transcript alterations in select upregulated genes from 72- to 96-h post-infection identified in the additive, interactive generalized linear model.
Low expression of defense genes was observed under NIV treatment at 72 hpi. Some resistance-related genes were found to show elevated expression in “Norman” at 72 hpi, including peroxidase BP1 (HvPrx5), lipid-transfer proteins (PR14), protein synthesis inhibitor II, vicilin antimicrobial peptides, homeoboxleucine zipper protein ROC, GDSL esterase/lipase, late embryogenesis abundant protein D-19 (HORVU1Hr1G059900), PHV A1, and several heat shock proteins.

Norman Displayed Alterations in Responsive Patterns in 15ADON Treatment at 96 hpi
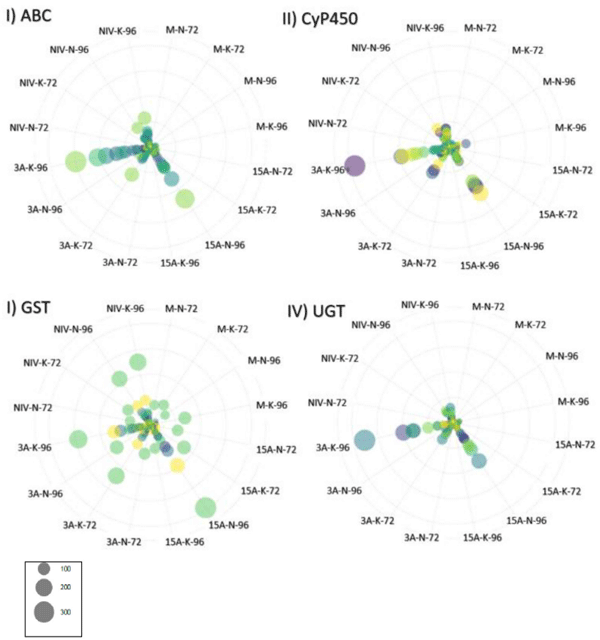
At 96 hpi, a significant change in resistance pattern was observed in “Norman” from what was seen initially at 72 hpi. As seen in “CDC Kendall” 3ADON treatment, a secondary phenylpropanoid metabolite pathway was induced at 96 hpi, seen in upregulation of phenylalanine synthase (HORVU5Hr1G052150) and PAL, shikimate kinase 1, 4-coumarate-CoA ligase (4CL), dihydroflavonol 4-reductase (HORVU2Hr1G033610, HORVU6Hr1G089460, DFRA). Detoxification genes were induced: ABC, CyP450, GST, and UGT (Figures 4I–IV). Oxidative-stress response was seen under elevations in alternative oxidase 1a (HORVU2Hr1G101980 AOX1A), peroxidases, progesterone 5 beta reductase (HORVU0Hr1G007340), germin-like proteins (oxalate oxidase, PR15), and laccases. Elevations occurred in resistance-responsive DEGs included Thaumatin-like pathogenesis-related protein 1 (HORVU7Hr1G122120), cysteine-rich venom protein (HORVU7Hr1G033530, PRB1-2), major pollen allergen Bet v 1-F/I (HORVU4Hr1G054870, PR10). Protease inhibitor families (Bowman-Birk type and chymotrypsin inhibitors) and xylanase inhibitor were expressed within “Norman.”
FIGURE 4 | Gene expression for gene families associated with resistance to deoxynivalenol (DON) expressed in transcripts per million (TPM). Genes are identified by color, and circle size corresponds to TPM. (I) ABC, ATP-binding cassette transporter (n = 24 genes); (II) CyP450, cytochrome P450 superfamily protein (n = 42 genes); (III) GST, glutathione S-transferase (16 genes); (IV) UGT, UDP-Glycosyltransferase superfamily proteins (36 genes). M, mock control; 3ADON, 3-acetyldeoxynivalenol; 15ADON, 15-acetyldeoxynivalenol; NIV, nivalenol. 72-and 96-h post-infection.
While “Norman” at 96 hpi followed the patterns of the generalized resistance motif as seen in “CDC Kendall,” several resistance-responsive genes were enhanced in “Norman,” including defense-related PR proteins: PRB1-2, PR3, PR5, PR10, PR15, plant basic secretory (BSP) protein (PR17), and pathogenesis-related protein (HORVU3Hr1G111600). Other elevated defensive response was observed in GST (GSTU6), stress responsive protein (HORVU2Hr1G017420), wound-induced protein (HORVU3Hr1G113120, wheatwin), MYC2 transcription factor (HORVU7Hr1G038900), and NBS-LRR resistance proteins. “Norman” expressed influential genes of cell function: Indole2-monooxygenase-like (HORVU3Hr1G011850, benzoxazinoid synthesis), WIR1A proteins (HORVU5Hr1G010130, HORVU6Hr1G088880, cell wall structure), and water supply via aquaporin PIP2-4 (HORVU6Hr1G05893). Nitric oxide (NO)-producing nitrate reductase 1 genes (HORVU6Hr1G003300, HORVU6Hr1G079700) were also induced and preferentially in “Norman.” Cathepsin B-like cysteine proteinases (HORVU2Hr1G036930, HORVU5Hr1G095580, HORVU5Hr1G061770), boron transporter 1 (HORVU5Hr1G022140, HvBOR1), copper ion-binding protein (HORVU7Hr1G036180), and metacaspase 1 (HORVU3Hr1G095700) genes indicated programmed cell death response in “Norman.”

DON Avoidance Mechanisms Were Pronounced in CDC Kendall in 3ADON Treatment at 96 hpi

Detoxification genes initially expressed in “CDC Kendall” at 72 hpi continued to rise to extremely high expression levels at the 96 hpi time point under 3ADON treatment, in dramatic contrast to “Norman,” which was more restrained (Figures 4I–IV). The phenylpropanoid pathway was greatly induced with genes PAL and 4CL. Dihydroflavonol 4-reductase (DFRA) and other flavonoid genes were differentially expressed, such as chalcone synthase (HORVU2Hr1G004170, CHS) and chalcone-flavanone isomerase (HORVU5Hr1G046480, CHI). JA and ETH hormone signatures were highly apparent. Pathogen recognition was evident through common expression of many receptors, modifiers, and signaling cascades, including leucine-rich repeat receptor (LRR) kinases [HORVU3Hr1G084260 (BAK1), HORVU3Hr1G104940, and HORVU1Hr1G068380, SERK2], together with modifiers of BAK1 (MOB) kinase activator-like 1A and 1B (HORVU0Hr1G018730, HORVU6Hr1G009410, and HORVU0Hr1G037740). Also evidenced were many genes of signaling cascade molecules: Numerous protein kinase superfamily proteins (MAPKKK), calmodulin-binding protein (HORVU0Hr1G002930), calcium-dependent protein kinase (HvCPK28), and calcium-transporting ATPase protein (HORVU1Hr1G076950). Bowman-Birk type trypsin inhibitors and Fusarium-specific orphan gene TaFROG were induced.
Heightened expression was observed in “CDC Kendall” for genes associated with respiratory burst (HORVU0Hr1G013380, HORVU4Hr1G081670, HORVU5Hr1G078630, NADPH oxidase homolog D, HvRbohD). Arginine decarboxylase was upregulated, which is involved in biosynthesis of polyamine spermidine. Polyamine oxidase was also activated, which is involved in H202 production in the apoplast. Upregulation was seen in multiple 2-oxoglutarate and Fe (II)-dependent oxygenase superfamily proteins (HORVU6Hr1G088430, HORVU2Hr1G004280, HORVU6Hr1G088440, 2OGO). Stress-responsive genes were upregulated, including NAC domain protein (HORVU5Hr1G111590, SNAC1) and peroxidase. Numerous CyP450 superfamily proteins that were highly expressed involved in redox reactions. CyP450s (HORVU1Hr1G080680, CyP450 94B3 and HORVU6Hr1G001520, CyP450 94C1) are involved in modification of jasmonoyl-L-isoleucine (JA-Ile) and attenuation of JA-response. Ubiquitinization (HORVU7Hr1G109650, HORVU2Hr1G104410) and negative regulatory factor of DON-resistance, NF-X1-type zinc finger protein increased over time. Extremely high expression was observed in UGT proteins HvUGT13248 and HvUGT14077 vs. control (log2FC = 9.6 and 6.4, respectively). Negative regulation of cell death was apparent through a display of BON association protein 2 (HORVU5Hr1G080820, BAP2) and MLO-like protein 1 (HORVU0Hr1G008830) and inactive poly (ADP-ribose) polymerase RCD1 (HORVU4Hr1G065800, radical-induced cell death 1). A boron efflux transporter (HvBOR1) was activated, where boron is a mitochondrial stabilizer and inhibitor of apoptosis. Programmed cell death-associated protein metacaspase-1 was expressed in “Norman” but was highly suppressed in “CDC Kendall” at this time.
While detoxification resistance was engaged, patterns of gene expression in “Norman” under 3ADON at 96 hpi showed some similarities to those observed in “Norman” at 72 hpi in 15ADON treatment. Vicilins (HORVU4Hr1G070970, HORVU5Hr1G104630), Serpins (Z7), subtilisin-chymotrypsin inhibitors (CI-1A and CI-1B), and B hordeins storage proteins were all elevated in “Norman.” Likewise, amine oxidase 1 (HORVU2Hr1G012710), TAR1 proteins, xylanase inhibitor (HORVU2Hr1G043890), LEA-like protein (HORVU1Hr1G058400, NHL13), NAC transcription factor (HORVU6Hr1G01938, HvNAM-1), defensin-like protein (PR12), and peroxidase BP1 (HVPrx5). A serine/threonineprotein kinase protein was expressed in “Norman” at these stages (HORVU1Hr1G064110, PBL7 homolog).

NIV Treatment at 96 hpi

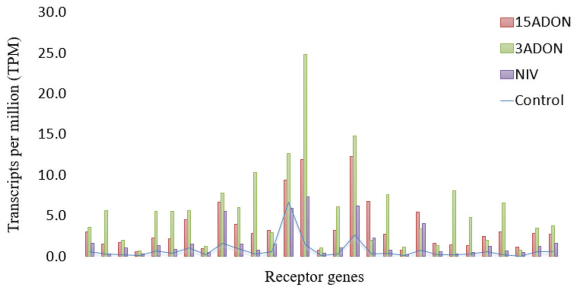
Receptors and signaling genes were slow to be induced in the NIV treatment at 72 hpi, in contrast to DON-producers (Figure 5). However, by 96 hpi, the NIV chemotype demonstrated an upsurge in expression, where gene families were similar to those seen in DON-producing treatments. The varieties showed very similar gene expressions at 96 hpi; however, germin-like (PR15), aspartic proteinase nepenthesin and peroxidase BP1 (HvPrx5) protein expressions were higher in “Norman.” GSTs displayed a higher induction than UGTs under the NIV vs. DON treatments (Figures 4, III and IV).

Gene Ontology (GO) Enrichment in Fusarium-Treatment vs. Control
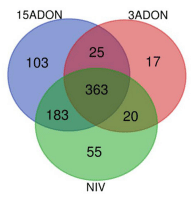
An overrepresentation analysis was used to evaluate DEGs from treatment contrasts to mock control to identify GO (Gene Ontology) terms enriched for the Fusarium-barley interaction. In contrast to the mock control group, the Fusarium-treatments displayed upregulation in a suite of genes. Groups of statistically significant GO terms (FDR ≥ 0.05) were analyzed for all treatment groups (15ADON, 3ADON, and NIV). GO terms between treatments were compared for intersection and similarity of expression patterns. Gene processes displayed common enrichment of mechanisms among the groups (Figure 6).
FIGURE 5 | Differentially expressed genes of receptor classification (n = 29) for “CDC Kendall” in treatment groups (15ADON, 3ADON, and NIV) at 72 hpi vs. mock control expressed in transcripts per million (TPM).
FIGURE 6 | A Venn diagram of enriched categories of GO terms (FDR ≥ 0.05) associated with differentially expressed genes in additive generalized linear model (GLM) contrast of mock control and Fusarium treatment (3ADON, 15ADON, and NIV chemotypes).
GO-enrichment portrayed increased unification of host response of coordinated mechanisms. Approximately half (47%) of all enriched terms was identified as common to all Fusarium treatment groups, including biological process terms: “L-phenylalanine metabolic/catabolic process”; “ammonium transmembrane transport”; “phenylpropanoid metabolic process”; “lignin metabolic process”; “oxidationreduction process”; “organonitrogen compound catabolic process”; “oxoacid metabolic process”; “carboxylic acid metabolic/catabolic process”; “cellular amino acid catabolic process” (GO:0009063); “aminoacyl-tRNA ligase activity” (GO:0004812), tryptophan biosynthetic process (GO:0000162), and indolalkylamine (GO:0042430; GO:0046219), which was evidenced by strong upregulation of anthranilate synthase component 1 (HORVU4Hr1G061120), tryptophan synthase. Pathogen response was perceived in “response to biotic stimulus” (GO:0009607) and “establishment of localization” (GO:0051234).
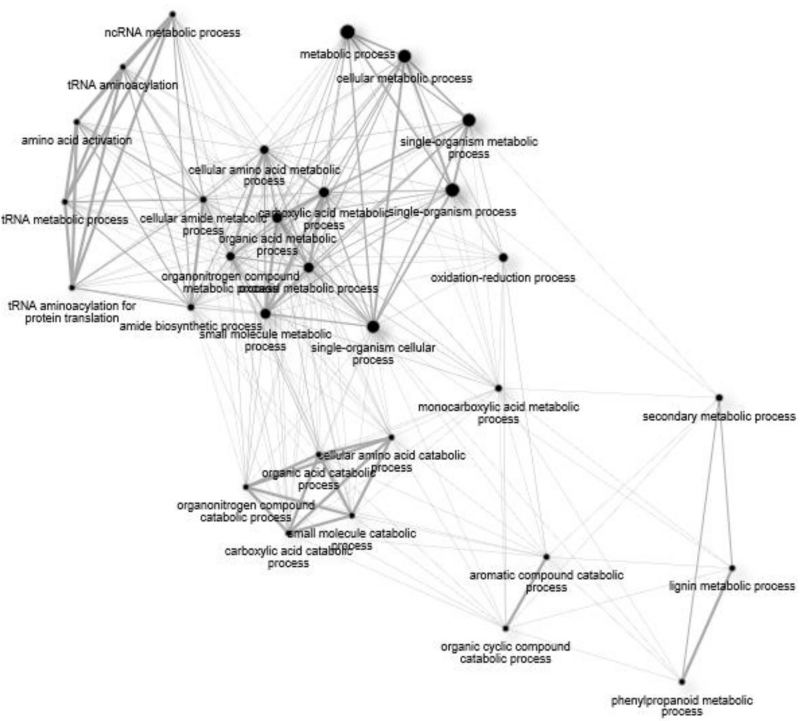
Figure 7 displays a network assembly of GO terms common to the Fusarium treatments. Non-coding RNA metabolism generates alterations in amino acid composition, which influence a metabolic process. Transcriptional reprogramming of Fusarium-response was directed at the level of amino acid metabolism through activation of aminoacyl-tRNA synthetase for particular amino acids (Ala, Cys, Leu, Lys, Phe, Pro, Val). Indole-3-glycerol phosphate synthase (HORVU5Hr1G052150) was upregulated, which participates in aromatic amino acid biosynthesis. Single-organism processes stimulate oxidationreduction processes, which, in turn, influence aromatic compound catabolism. Processes together lead to production of secondary metabolism of phenylpropanoids and lignification response. This resistance pattern occurred in both varieties.

GO Enrichment in 72 vs. 96 hpi

The additive GLM, identified significant (FDR < 0.05) enrichment of biological processes over all treatments. Enrichment was observed with gene groups associated with elevated functions at 96 hpi. Changes in cellular reprogramming were apparent through augmentations in “protein ubiquitination” (GO:0016567) “ubiquitin-protein transferase activity” (GO:0004842) were observed arising from expression of multiple U-box domain-containing proteins (HORVU1Hr1G069990, HORVU6Hr1G089560, HORVU6Hr1G089590, HORVU7Hr1G040790). “Anion transport” was identified as a process-enriched term, including boron transporter 1 (HORVU5Hr1G022140) and high-affinity nitrate transporter 3.1 (HORVU6Hr1G053710, NAR2.3). “Sequence-specific DNA binding” (GO:0043565) was amplified, including genes encoding multiple WRKY transcription factors of the JA signaling pathway. Functional enrichment was observed in calcium ion binding (GO:0005509) in calciumtransporting ATPase (HORVU1Hr1G076950). “ATPase activity” (GO:0016887) and “ATPase activity,” coupled to movement of substances (GO:0043492) associated with elevations of ABC transporter activities.
FIGURE 7 | A network of significant (FDR > 0.05) Gene Ontology (GO) terms for biological processes common to all treatment groups (15ADON, 3ADON, and NIV).
Transcriptome Alterations of an in vitro-Selected, Moderately Resistant, Two-Row Malting Barley in Response to 3ADON, 15ADON, and NIV Chemotypes of Fusarium graminearum - Image 11 0.05) Gene Ontology (GO) terms for biological processes common to all treatment groups (15ADON, 3ADON, and NIV)." />
Transcriptome Alterations of an in vitro-Selected, Moderately Resistant, Two-Row Malting Barley in Response to 3ADON, 15ADON, and NIV Chemotypes of Fusarium graminearum - Image 2Click here to enlarge the image
Pairwise contrasts also identified common enrichment in processes over time, including a “phenylpropanoid metabolic process” (GO:0009698) and a “lignin metabolic process” (GO:0009808), such as laccases and a “cell wall macromolecule metabolic process” (GO:0044036). “Defense response” (GO:0006952), “alternative oxidase activity (GO:0009916). Regulatory functions were enriched, including “regulation of biosynthetic processes” (GO:0009889), including genes rRNA N-glycosidase, protein synthesis inhibitor II, and quinone; “regulation of gene expression” (GO:0010468) enrichments was seen in NAC, WKRY, ERF, bZIP families. Enhanced molecular function was seen in “peptidase inhibitor activity” (GO:0030414), nutrient reservoir activity (GO:0045735) seen in increase of storage proteins. Temporal patterns of enrichment demonstrated similar progressions within individual Fusarium-treatment groups.

GO Enrichment in “Norman” vs. “CDC Kendall”

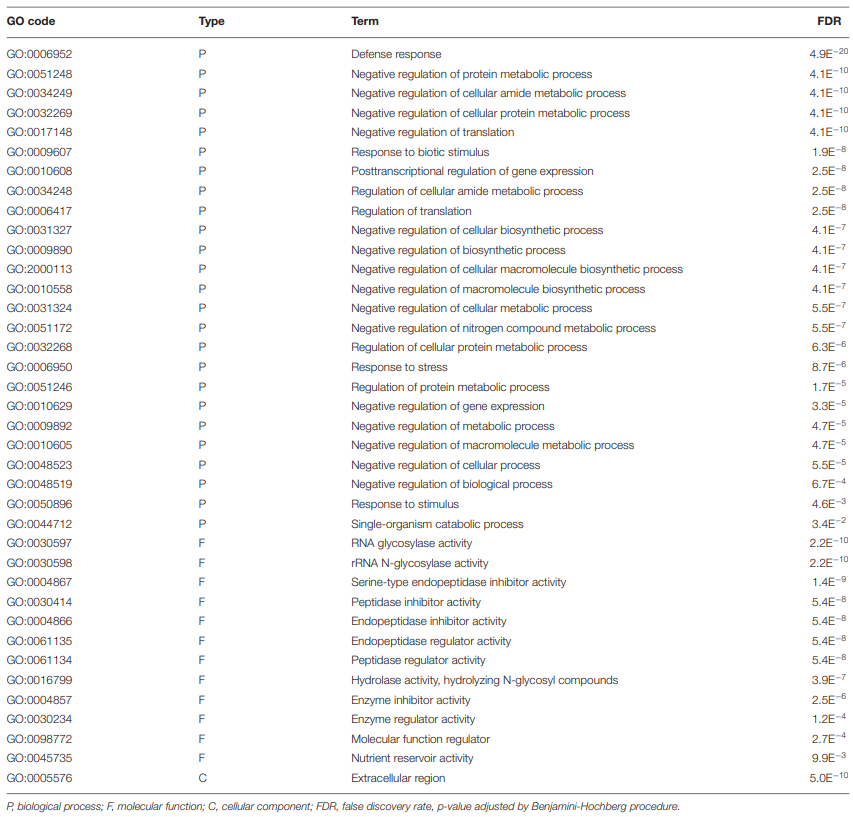
The most significant category of gene enrichment for the biological process was “defense response” (Table 6). Enrichment was also seen in response to “biotic stimulus,” “response to stress,” and “response to stimulus.” Enriched categories of DGEs displayed negative biological regulatory processes. Molecular functions were enriched in elements of pathogenic repression. Enriched elements indicated that differences in host-pathogen interaction response occur within the “extracellular region.”
TABLE 6 | Gene Ontology (GO) terms of “Norman” vs. “CDC Kendall” contrast identified in the additive, interactive generalized linear model.

The Differential Gene Associated With Oxidative Stress Reduction

Fusarium-treatments clearly demonstrated a sign of oxidative stress through activation of multiple genes-encoding proteins with antioxidant genes with oxidoreductase activity included: numerous peroxidases, L-ascorbate oxidase, thioredoxin 2, ferredoxin 3, FAD-binding Berberine family protein, quinone, 2-oxoglutarate, and Fe (II)-dependent oxygenase superfamily, and lignin-associated laccase-19. Oxidative stress was apparent under Fusarium-treatments through expression of ubiquinol oxidase-alternative oxidases, AOX1A (HORVU2Hr1G101920), AOX2 (HORVU2Hr1G101920, HORVU2Hr1G101990), and external alternative NADPH-ubiquinone oxidoreductase B3 (HORVU7Hr1G073050). These genes that provide alternative oxygen reduction mechanisms within electron transport chain and mitigate problems of excess ROS for maintaining growth. Likewise, induction of ATP-dependent zinc metalloprotease FtsH 2 (HORVU3Hr1G052880) indicated potential photo-damage of thylakoid membranes. Such genes were expressed in excess in “CDC Kendall,” indicating higher oxidative stress. GO terms for molecular function were enriched in activities associated with oxidative stress and detoxification: “alternative oxidase activity” (GO:0009916); “oxidoreductase activity” (GO:0016491); “oxidoreductase activity, acting on diphenols and related substances as donors, oxygen as acceptor” (GO:0016682); “iron ion binding” (GO:0005506); “heme binding” (GO:0020037). Enrichment was seen in all treatment groups in response to an oxidative-stressed state of a host, following Fusariuminfection.

DISCUSSION

We document in the current study that 3ADON chemotypes created more disease and much higher mycotoxin in barley than 15ADON or NIV chemotypes. DON is a virulence factor contributing to primary infection in barley (type I resistance) but, in contrast to wheat, does not contribute to increased spread from point of initial infection (Jansen et al., 2005). Resistance to spread from point of infection (type II resistance) is robust in barley, where even susceptible barleys can adequately impede internal growth through the rachis, owing to strong detoxification mechanisms. As seen in previous studies of six-row barley (Boddu et al., 2007; Gardiner et al., 2010; Huang et al., 2016), two-row barley in the current study demonstrates a coordinated defense response through a suite of DON-induced genes. Elevated co-expression of detoxification genes was observed in the 3ADON treatment and predominantly in “CDC Kendall,” including CyP450’s, which modify harmful molecules and/or facilitate oxidative reactions of phenylpropanoid production. Glutathione S-transferase (GST) and UGTs conjugate toxins to create glutathione or glucose moieties. ABC transporters facilitate transport of xenobiotics out of a cell or into vacuoles. Detoxification resistance was common to both varieties and was increasingly expressed to 96 hpi.
Both “Norman” (moderately resistant variety) and “CDC Kendall” (intermediate variety) displayed strong detoxification responsive against DON. UDP-glucuronosyltransferase (UGT) genes like HvUGT13248, which converts DON to DON3G through addition of a glucose molecule, are very well-characterized (Schweiger et al., 2010) and are essential components of type II resistance. Barley UGTs like HvUGT13248 are very effective, where enhanced type II resistance was attained by insertion of this transgene in wheat (Li et al., 2015). Virusinduced gene silencing of HvUGT-10W1, an allelic variant of HvUGT14077, resulted in compromise type II resistance, allowing spread through the spike (Xing et al., 2017). DON conjugation transforms mycotoxins to less-toxic forms but also facilitates mobilization to apoplast/vacuoles (Audenaert et al., 2014) or binding to cell wall constituents (Zhou et al., 2008). While the enhanced rate of DON-glycosylation is associated with wheat resistance (Kluger et al., 2015), the ratio of DON3G/DON in barley was similar in mature grains of differentially resistant varieties (Tucker et al., 2019). This suggests that resistance in barley is likely not enhanced by elevated UGT gene expression. While DON conjugation effectively lowers overall toxin content, conjugates are also undesirable as they can readily be hydrolyzed to the principal toxin by common gut bacteria (Berthiller et al., 2011).
“Norman” displayed a more conservative response to DON under challenge by more aggressive 3ADON-producing strains under pathogen progression. Overstated detoxification response in “CDC Kendall” suggests a host-pathogen interaction of increased mycotoxin content. In environments where pathogens may demonstrate proclivities for toxin production, reliance on DON resistances involving avoidance mechanisms may not be adequate. Generation of reactive oxygen species (ROS) through an oxidative burst is observed under first stages of cereal host defense response to F. graminearum (Taheri, 2018). As seen by Huang et al. (2016), a large number of receptor kinase genes were invoked in the current study linked with pathogen recognition and resultant signaling cascades. ROS molecules associated with the oxidative burst operate directly as protective agents, trigger programmed cell death (PCD), and/or signal pathogenesisrelated (PR) protein induction (Lamb and Dixon, 1997). DON elicits H2O2 production in cereals, which, in juxtaposition, may trigger antimicrobial defense but may stimulate cell death, which ultimately benefits necrotrophic growth (Desmond et al., 2008). Fusarium graminearum responds reciprocally to ROS through stress-responsive generation of DON (Ponts et al., 2007), thereby establishing a positive feedback loop, leading potentially to toxin amplification. However, the more-virulent 3ADON form demonstrated abilities to increase infection rates and mycotoxin production in either variety. The increased frequency of occurrence of these more virulent forms poses a serious threat to barley production. Focus on incorporating robust resistance to initial infection within DON-based resistance may be an increasingly important resistance mechanism for challenges to more-virulent strains.
Phenylalanine ammonia-lyase (PAL) genes were highly expressed in both varieties herein and the study conducted by Huang et al. (2016). PAL catalyzes a deamination reaction, converting L-phenylalanine to trans-cinnamic acid. It represents a shift from primary to secondary metabolic function and the first step of the biosynthetic process of the polyphenol compounds, such as flavonoids, phenylpropanoids, and lignin. PAL is an important component of the basal resistance mechanism of barley associated with MYB transcription factors. Mass spectrometry applications have confirmed common occurrence of resistance-related compounds in Fusarium-infected cereals, where flavonoid phenylpropanoids are predominant (reviewed by Gauthier et al., 2015). Lignin formed through polymerized phenolic precursors contributes to resistance via fortification of physical barriers but is also important as a precursor of JA biosynthesis (Chamarthi et al., 2014). Boutigny et al. (2008) implicate phenolic compounds as DON suppressors through quenching oxidative stress. However, defenses of this nature are generally slow and may be outpaced by more virulent pathogens. Phenolic acids generally inhibit F. graminearum growth; however, compounds with higher antioxidant properties may also stimulate increased toxins via stress response (Ponts et al., 2011).
Jamonic acid/ ETH pathways were induced by Fusarium in either variety, where response increased over time. Kumaraswamy et al. (2012) demonstrated JA involvement in transcriptional response to DON in wild type to TRI5- contrast. “CDC Kendall” and “Norman” were characterized with elevated JA-response in later treatment, while PR expressions were generally more pronounced in “Norman.” JA-response under study was associated with lignification, detoxification mechanisms, and elevated expressions genes, such as chitinases (PR3) and thaumatin-like (PR5) proteins. Geddes et al. (2008) demonstrated these PR proteins and oxidative burst/stress response occurred both in moderately resistant and intermediately resistant two-row barley varieties infected by F. graminearum. In the current study, DEGs were primarily associated with JA vs. salicylic acid (SA) expression; however, SA-signatures may also have disappeared by this time point as seen by Huang et al. (2016). Hormones are important coordinating factors in quantitative disease traits and are principally involved in response to a pathogen, where SA is typically associated with resistance to biotrophs vs. JA/ETH, which is common in necrotrophic response (Glazebrook, 2005). Basal resistance, activated early in the defense response of cereals, is associated with SA accumulation (Makandar et al., 2012; Hao et al., 2018; Wang et al., 2018). Resistance associated with JA/ETH signaling pathways was also implicated in several cereal studies (Li and Yen, 2008; Gottwald et al., 2012; Makandar et al., 2012; Qi et al., 2016; Wang et al., 2018). Antagonism between hormones is documented in cereal response to F. graminearum, where host compatibility is complicated by a hemi-biotrophic lifestyle. Resistance occurs in orderly sequence, where resistance coordination may be important for fully effective resistance (Ding et al., 2011; Makandar et al., 2012).
We observed antagonism between stress-responsive ABA and growth-related GA phytohormones. In cereals, ABA is a phytohormone associated with the onset of stress-related metabolites, anti-oxidative activation, stomatal closure, and lowered photosynthetic efficiencies (Gietler et al., 2020). GA insensitive dwarf 1 (GID1) receptor interacts with GA and DELLA to form a protein complex (Murase et al., 2008), followed by marking of DELLAs via F-box proteins for ubiquitinization and degradation. Degradation of GA-repressive DELLA-encoding Slender1 (HORVU3Hr1G058100, Sln1) gene permits the GA-signaling pathway. Mutations in the DELLA domain required for interaction with GID1 and GA-growth response result in a semi-dwarf phenotype, which is susceptible to biotrophic pathogens but resistant to necrotrophic pathogens and F. graminearum (Saville et al., 2012). De Bruyne et al. (2014) discuss the role of DELLAs in providing resistance to necrotrophs through induction of compounds, which alleviate oxidative stress, repress cell wall loosening, and compete with JAZ molecules, allowing MYC2 to bind G-box and release JA-responsive genes. “Norman” at 72 hpi demonstrated an elevated level of elevated ABA-responsive genes and senescencerelated proteins, while GA-signatures (Gamyb) dominated the defense response of DON-detoxification at 96 hpi, particularly under the 3ADON treatment. Petti et al. (2010) also observed downregulation of GA-receptor and elevated DELLA expression and disease control of F. culmorum, following induction of induced systemic resistance (ISR) via priming of Pseudomonas fluorescence. Interplay of ABA-GA phytohormones may play a role in modulating the biotrophic-necrotrophic transition. This antagonism is a basis of trophic divergence in a diversified hostpathogen interaction, which may result in both resistance or susceptibility under species-specific circumstance (Huang et al., 2020).
Oxidative stress visible in all Fusarium-treatments likely is the result of elevated ROS production. “Norman” demonstrated a reduced state of oxidative stress relative to “CDC Kendall.” Abiotic stress response of ABA phytohormones may overlap with biotic pathways that may occur via stimulus of water-stress and electrolyte leakages, arising from cell wall damage (López et al., 2008). The host needs effective means to control oxidative stress to minimize cell damage. Late embryogenesis abundant (LEA) proteins are a large group of hydrophilic, stress-induced proteins termed as such due to fact that they occur at the onset of seed desiccation. LEA proteins were associated with rachides of Fusarium-resistant wheat lines (Liu et al., 2019). A wheat trans-gene (TdLEA3) expressed in A. thaliana demonstrated (Koubaa and Brini, 2020) increased stress tolerance and oxidative stress reduction through protection of ROS-scavenging genes. Numerous LEA genes were expressed early and at higher levels in “Norman.” While peroxidase expression was common to both varieties in Fusarium-treatments, barley peroxidase class III BP1 (HvPrx5) gene was highly expressed, particularly in “Norman.” This barley peroxidase is uniquely endospermspecific (Rasmussen et al., 1991) and was also identified as an important defensive gene by Petti et al. (2010), who speculated it to contribute to increasing cross-linkages in cell walls.
Expression patterns in “Norman” differed from “CDC Kendall” for genes, which may impede successful colonization through pronounced antimicrobial expression. Multiple xylanase inhibitors were expressed in “Norman,” which combat Fusarium hydrolytic enzymes, which degrade cell walls. While F. graminearum employs toxins as virulence factors, it is also equipped with a comprehensive secretome, including over 600 proteins (Brown et al., 2012). Secreted proteins include cell wall-degrading enzymes, which contribute as virulence factors through enhanced penetration of physical barriers. Some xylanase inhibitors are also believed to possess antifungal function, with homologous similarities to chitinase III (PR8) proteins (Wu et al., 2013). “Norman” displayed elevated rRNA N-glycosidase (ribosome-inactivating protein, Ricin Achain), which could either function as an antifungal toxin or facilitate cell suicide. In the current study, antimicrobial peptides were identified earlier and with elevated expression in “Norman,” including Thionin 2.1 (HORVU6Hr1G000680, HORVU6Hr1G000780), non-specific lipid-transfer proteins (nsLTP2) (HORVU4Hr1G087780, PR14) and a defensin-like protein (HORVU4Hr1G082400, PR12). Hao et al. (2020) demonstrated a thionin gene in A. thaliana-conferred resistance to F. graminrearum but also raised PR-genes through SA and JA/ET hormone stimulation. Such cysteine-rich antimicrobial peptides were differentially expressed in moderately resistant wheat variety “Dream” and recognized as key resistance factors (Gottwald et al., 2012).
“Norman” displayed an intensified expression of proteases, including serpins, (serine protease inhibitors, which act on both as trypsin and chymotrypsin), subtilisin-chymotrypsin inhibitor, alpha-amylase inhibitors, and metallocarboxypeptidase inhibitors. Alternatively, Bowman-Birk-type inhibitors (trypsin inhibitors) were dominant in “CDC Kendall,” particularly at 96 hpi. Petti et al. (2010) also documented subtilisin/chymotrypisins and serpin proteases as key actors in barley response to F. graminearum. Serpins play an essential role in regulation of programmed cell death (Dickman and Fluhr, 2013) and may represent important mechanisms for control of Fusariuminduced death response. Cell death may occur as a defense mechanism but also is induced by DON. Pekkarinen et al. (2007) conducted kinetic studies of protease kinds and found chymotrypsin/subtilisin inhibitor 2 (CI-2) to be more efficient than Bowman-Birk-type trypsin inhibitors, while both were considered capable of binding Fusarium proteinases which may inhibit barley PR defense proteins. Alpha-amylase inhibitor, which was highly pronounced in “Norman,” was identified by Zantinge et al. (2010) as a protein found of higher abundance in FHB-resistant barleys. Success of more aggressive strains of F. graminearum is associated with increased protease levels vs. molecular diversification (Fabre et al., 2019), so stronger expressions may be important for control of morevirulent strains. Eggert and Pawelzik (2011) observed very little degradation of storage proteins under high FHB infection of barley, implying strong resistance mechanisms protect the endosperm. “Norman” was enriched for vicilin storage proteins, which carry antimicrobial properties.
NIV-producers incited the most similar response between the two varieties under evaluation, implying that the resistance in “Norman” may be DON specific. NIV producers do not share the same mycotoxin-induced stress response to H2O2 as DON producers, as they have higher adaptation to oxidative stress (Ponts et al., 2009). While not as aggressive as the 3ADON-producers, the NIV producers demonstrated equal ability to infect barley and accumulate mycotoxins as the 15ADON producers. While NIV may be less toxic to plants, it is more toxic to humans (Ferrigo et al., 2016). Climate changes, which may extend northern latitudes of fungi, coupled with sexual recombinant cycles and wind-dispersed ascospores, supply conceivable threats of NIV producers to northern barley production regions of North America. Given its pathogenic capabilities on barley and potential for increased toxicity, such NIV forms should be monitored through chemotype surveillance.
In the current study, we investigated genetic variation of a moderately resistant IVS variety in contrast to its parent variety, where differential response was observed. As seen in many other genetic studies resistance to DON, accumulation was complicated, where different forms of resistance occurred. While resolution limitations exist due to the fact that whole seeds were ground together, this study identifies global transcriptional alterations involved in the host defense response within developing grains. Resistance genes differentially expressed in “Norman” were observed in divergent relationship to generalized resistance mechanisms associated with DON avoidance. Resistances in “Norman” may impede Fusarium growth through antimicrobial compounds and reduce DONinducing oxidative stress via antioxidants. Limitations imposed by more-virulent 3ADON forms capable of producing higher levels of DON remain challenging, where barley breeders will need to continue incorporating resistance to maintain DON content below the very low limits set by industry. Overlap was seen in resistances in either variety, implying that control of response may shape an outcome. The study has identified many genomic features, which may contribute to the barley resistance response. New technologies, such as microlaser dissection and digital droplet PCR that combine histological and transcriptomic methodologies, can be applied to further investigate features identified in this study at the single-cell level to illuminate host– pathogen interactions within specific organelles.

PERMISSION TO REUSE AND COPYRIGHT

Her Majesty the Queen in Right of Canada as represented by the Minister of Agriculture and Agri-Food Canada 2021; This article is an open access article distributed under the terms and conditions of the Creative Commons Attribution (CC BY) license.

DATA AVAILABILITY STATEMENT

The data discussed in this publication have been deposited in NCBI’s Gene Expression Omnibus (Edgar et al., 2002) and are accessible through GEO Series accession number GSE174081 (https://www.ncbi.nlm.nih.gov/geo/query/acc.cgi? acc=GSE174081).

AUTHOR CONTRIBUTIONS

JT, AB, and WF conceived and designed the experiments. JT and WL conducted field analysis. JT grew a plant and fungus, conducted inoculations, performed the RNA isolation, and wrote the manuscript. JT, SM, WX, and ZY analyzed the data. CH conducted microarray analysis. SS conducted mycotoxin assays. AB and WF held supervisory roles. JT, AB, WF, and WX revised the manuscript. All authors read and approved the final manuscript.

FUNDING

This investigation is based upon work supported, in part, by funding provided by the Brewing and Malting Barley Research Institute, the Manitoba Crop Alliance, and the Saskatchewan Barley Development Commission.

ACKNOWLEDGMENTS

We thank Aaron Beattie, Crop Development Centre, University of Saskatchewan for providing seed of CDC Kendall. We thank Marc Savard and Barbara Blackwell, AAFC Ottawa Research, and Development Centre for providing DON analysis of the nursery samples. We thank Richard Martin, AAFC Charlottetown for providing the method of conidia production. We wish to acknowledge technical support of Sally Buffam, Adam Carter, Kevin Moore, and Mira Popovic.

SUPPLEMENTARY MATERIAL

The Supplementary Material for this article can be found online at: https://www.frontiersin.org/articles/10.3389/fpls.2021. 701969/full#supplementary-material.
      
This article was originally published in Frontiers in Plant Science. 12:701969. doi:10.3389/fpls.2021.701969. This is an Open Access article distributed under the terms of the Creative Commons Attribution License (CCBY).

Al-Taweel, K., Fernando, W. G. D., and Brûlé-Babel, A. L. (2014). Transcriptome profiling of wheat differentially expressed genes exposed to different chemotypes of Fusarium graminearum. Theor. Appl. Genet. 127, 1703–1718. doi: 10.1007/s00122-014-2333-8

Amarasinghe, C., and Fernando, W. G. D. (2016). Comparative analysis of deoxynivalenol biosynthesis related gene expression among different chemotypes of Fusarium graminearum in spring wheat. Front. Microbiol. 7:1229. doi: 10.3389/fmicb.2016.01229

Amarasinghe, C., Sharanowski, B., and Fernando, W. G. D. (2019). Molecular phylogenetic relationships, trichothecene chemotype diversity and aggressiveness of strains in a global collection of Fusarium graminearum species. Toxins 11:263. doi: 10.3390/toxins11050263

Anand, L., and Rodriguez Lopez, C. M. (2020). chromoMap: an R package for interactive visualization and annotation of chromosomes. bioRxiv 605600. doi: 10.1101/605600

Andrews, S. (2010). FastQC: A Quality Control Tool for High Throughput Sequence Data. Available online at: http://www.bioinformatics.babraham.ac.uk/projects/ fastqc (accessed March, 2021).

Audenaert, K., Vanheule, A., Höfte, M., and Haesaert, G. (2014). Deoxynivalenol: a major player in the multifaceted response of Fusarium to its environment. Toxins 6, 1–19. doi: 10.3390/toxins6010001

Bai, G., and Shaner, G. (2004). Management and resistance in wheat and barley to fusarium head blight. Annu. Rev. Phytopathol. 42, 135–161. doi: 10.1146/annurev.phyto.42.040803.140340

Bayer, M. M., Rapazote-Flores, P., Ganal, M., Hedley, P. E., Macaulay, M., Plieske, J., et al. (2017). Development and evaluation of a Barley 50k iSelect SNP Array. Front. Plant Sci. 8:1792. doi: 10.3389/fpls.2017.01792

Berthiller, F., Krska, R., Domig, K. J., Kneifel, W., Juge, N., Schuhmacher, R., et al. (2011). Hydrolytic fate of deoxynivalenol-3-glucoside during digestion. Toxicol. Lett. 206, 264–267. doi: 10.1016/j.toxlet.2011.08.006

Boddu, J., Cho, S., Kruger, W. M., and Muehlbauer, G. J. (2006). Transcriptome analysis of the barley-Fusarium graminearum interaction. Mol. Plant Microbe Interact. 19, 407–17. doi: 10.1094/MPMI-19-0407

Boddu, J., Cho, S., and Muehlbauer, G. J. (2007). Transcriptome analysis of trichothecene-induced gene expression in barley. Mol. Plant Microbe Interact. 20, 1364–1375. doi: 10.1094/MPMI-20-11-1364

Bolger, A. M., Lohse, M., and Usadel, B. (2014). Trimmomatic: a flexible trimmer for Illumina sequence data. Bioinformatics 30, 2114–2120. doi: 10.1093/bioinformatics/btu170

Boutigny, A.-L., Richard-Forget, F., and Barreau, C. (2008). Natural mechanisms for cereal resistance to the accumulation of Fusarium trichothecenes. Eur. J. Plant Pathol. 121, 411–423. doi: 10.1007/s10658-007-9266-x

Brown, N. A., Antoniw, J., and Hammond-Kosack, K. E. (2012). The predicted secretome of the plant pathogenic fungus Fusarium graminearum: a refined comparative analysis. PLoS ONE 7:e33731. doi: 10.1371/journal.pone. 0033731

Chamarthi, S. K., Kumar, K., Gunnaiah, R., Ajjamada, K., Dion, Y., and Choo, T. (2014). Identification of fusarium head blight resistance related metabolites specific to doubled-haploid lines in barley. Eur. J. Plant Pathol. 138, 67–78. doi: 10.1007/s10658-013-0302-8

Chawla, H. S., and Wenzel, G. (1987). In-vitro selection for fusaric acid resistant barley plants. Plant Breed. 99, 159–163. doi: 10.1111/j.1439-0523.1987.tb01166.x

Clear, R. M., Tucker, J. R., Gaba, D., Patrick, S. K., Lee, S.-J., Demeke, T., et al. (2013). Deoxynivalenol levels and chemotype frequency in barley varieties inoculated with two chemotypes of Fusarium graminearum. Can J. Plant Pathol. 35, 37–45. doi: 10.1080/07060661.2012.751622

De Bruyne, L., Hofte, M., and De Vleesschauwer, D. (2014). Connecting growth and defense: the emerging roles of brassinosteroids and gibberellins in plant innate immunity. Mol. Plant. 7, 943–959. doi: 10.1093/mp/ssu050

Desjardins, A. E. (2006). “Trichothecenes,” in Fusarium Mycotoxins: Chemistry, Genetics, and Biology, ed A. E. Desjardins (St. Paul, MN: The American Phytopathological Society Press), 13–64.

Desmond, O. J., Manners, J. M., Stephens, A. E., MacLean, D. J., Schenk, P. M., Gardiner, D. M., et al. (2008). The Fusarium mycotoxin deoxynivalenol elicits hydrogen peroxide production, programmed cell death and defence responses in wheat. Mol. Plant Pathol. 9, 435–445. doi: 10.1111/j.1364-3703.2008.00475.x

Dickman, M. B., and Fluhr, R. (2013). Centrality of host cell death in plant-microbe interactions. Annu. Rev. Phytopathol. 51, 543–570. doi: 10.1146/annurev-phyto-081211-173027

Ding, L., Xu, H., Yi, H., Yang, L., Kong, Z., Zhang, L., et al. (2011). Resistance to hemi-biotrophic F. graminearum infection is associated with coordinated and ordered expression of diverse defense signaling pathways. PLoS ONE 6:e19008. doi: 10.1371/journal.pone.0019008

Edgar, R., Domrachev, M., and Lash, A. E. (2002). Gene expression omnibus: NCBI gene expression and hybridization array data repository. Nucleic Acids Res. 30, 207–210. doi: 10.1093/nar/30.1.207

Eggert, K., and Pawelzik, E. (2011). Proteome analysis of Fusarium head blight in grains of naked barley (Hordeum vulgare subsp. nudum). Proteomics 11, 972–985. doi: 10.1002/pmic.201000322

Eudes, F., Comeau, A., Rioux, S., and Colin, J. (2008). Trichothecenemediated in vitro selection in wheat for reduced mycotoxin accumulation caused by Fusarium graminearum. Can. J. Plant Sci. 88, 1115–1125. doi: 10.4141/CJPS08060

Fabre, F., Bormann, J., Urbach, S., Roche, S., Langin, T., and Bonhomme, L. (2019). Unbalanced roles of fungal aggressiveness and host cultivars in the establishment of the Fusarium head blight in bread wheat. Front. Microbiol. 10:2857. doi: 10.3389/fmicb.2019.02857

Ferrigo, D., Raiola, A., and Causin, R. (2016). Fusarium toxins in cereals: occurrence, legislation, factors promoting the appearance and their management. Molecules 21:627. doi: 10.3390/molecules21050627

Gardiner, S. A., Boddu, J., Berthiller, F., Hametner, C., Stupar, R. M., Adam, G., et al. (2010). Transcriptome analysis of the barley-deoxynivalenol interaction: evidence for a role of glutathione in deoxynivalenol detoxification. Mol. Plant Microbe Interact. 23, 962–976. doi: 10.1094/MPMI-23-7-0962

Gauthier, L., Atanasova-Penichon, V., Chéreau, S., Richard-Forget, F. (2015). Metabolomics to decipher the chemical defense of cereals against Fusarium graminearum and deoxynivalenol. Int. J. Mol. Sci. 16, 24839–24872. doi: 10.3390/ijms161024839

Ge, S. X., Jung, D., and Yao, R. (2020). ShinyGO: a graphical gene-set enrichment tool for animals and plants. Bioinformatics 36, 2628–2629. doi: 10.1093/bioinformatics/btz931

Geddes, J., Eudes, F., Laroche, A., and Selinger, L. B. (2008). Differential expression of proteins in response to the interaction between the pathogen Fusarium graminearum and its host, Hordeumvulgare. Proteomics 8, 545–554. doi: 10.1002/pmic.200700115

Gietler, M., Fidler, J., Labudda, M., and Nykiel, M. (2020). Abscisic acid-enemy or savior in the response of cereals to abiotic and biotic stresses? Int. J. Mol. Sci. 21:4607. doi: 10.3390/ijms21134607

Glazebrook, J. (2005). Contrasting mechanisms of defense against biotrophic and necrotrophic pathogens. Annu. Rev. Phytopathol. 43, 205–222. doi: 10.1146/annurev.phyto.43.040204.135923

Gottwald, S., Samans, B., Luck, S., and Friedt, W. (2012). Jasmonate and ethylene dependent defence gene expression and suppression of fungal virulence factors: two essential mechanisms of Fusarium head blight resistance in wheat? BMC Genomics 13:369. doi: 10.1186/1471-2164-13-369

Güldener, U., Seong, K. Y., Boddu, J., Cho, S., Trail, F., Xu, J. R., et al. (2006). Development of a Fusarium graminearum Affymetrix GeneChip for profiling fungal gene expression in vitro and in planta. Fungal Genet. Biol. 43, 316–325. doi: 10.1016/j.fgb.2006.01.005

Habler, K., Geissinger, C., Hofer, K., Schüler, J., Moghari, S., Hess, M., et al. (2017). Fate of Fusarium toxins during brewing. J. Agric. Food Chem. 65, 190–198. doi: 10.1021/acs.jafc.6b04182

Hao, G., Bakker, M. G., and Kim, H.-S. (2020). Enhanced resistance to Fusarium graminearum in transgenic Arabidopsis plants expressing a modified plant thionin. Phytopathology 110, 1956–1066. doi: 10.1094/PHYTO-12-19-0447-R

Hao, Q., Wang, W., Han, X., Wu, J., Lyu, B., Chen, F., et al. (2018). Isochorismate-based salicylic acid biosynthesis confers basal resistance to Fusarium graminearum in barley. Mol. Plant Pathol. 19, 1995–2010. doi: 10.1111/mpp.12675

Huang, S., Zhang, X., and Fernando, W. G. D. (2020). Directing trophic divergence in plant-pathogen interactions: antagonistic phytohormones with NO doubt? Front. Plant Sci. 11:1850. doi: 10.3389/fpls.2020.600063

Huang, Y., Li, L., Smith, K. P., and Muehlbauer, G. J. (2016). Differential transcriptomic responses to Fusarium graminearum infection in two barley quantitative trait loci associated with Fusarium head blight resistance. BMC Genom. 17:387. doi: 10.1186/s12864-016-2716-0

Jansen, C., von Wettstein, D., Schäfer, W., Kogel, K.-H., Felk, A., and Maier, F. J. (2005). Infection patterns in barley and wheat spikes inoculated with wild-type and trichodiene synthase gene disrupted Fusarium graminearum. Proc. Natl. Acad. Sci. U.S.A. 102, 16892–16897. doi: 10.1073/pnas.0508467102

Kelly, A. C., and Ward, T. J. (2018). Population genomics of Fusarium graminearum reveals signatures of divergent evolution within a major cereal pathogen. PLoS ONE 13:e0194616. doi: 10.1371/journal.pone.0194616

Kim, D., Langmead, B., and Salzberg, S. L. (2015). HISAT: a fast spliced aligner with low memory requirements. Nat. Methods. 12, 357–360. doi: 10.1038/nmeth.3317

Kluger, B., Bueschl, C., Lemmens, M., Michlmayr, H., Malachova, A., Koutnik, A., et al. (2015). Biotransformation of the mycotoxin deoxynivalenol in fusarium resistant and susceptible near isogenic wheat lines. PLoS ONE 10:e0119656. doi: 10.1371/journal.pone.0119656

Koubaa, S., and Brini, F. (2020). Functional analysis of a wheat group 3 late embryogenesis abundant protein (TdLEA3) in Arabidopsis thaliana under abiotic and biotic stresses. Plant Physiol. Biochem. 156, 396–406. doi: 10.1016/j.plaphy.2020.09.028

Kumaraswamy, G. K., Kushalappa, A. C., Choo, T. M., Dion, Y., and Rioux, S. (2012). Differential metabolic response of barley genotypes, varying in resistance, to trichothecene-producing and -nonproducing (tri5-) isolates of Fusarium graminearum. Plant Pathol. 61, 509–521. doi: 10.1111/j.1365-3059.2011.02528.x

Lamb, C., and Dixon, R. A. (1997). The oxidative burst in plant disease resistance. Annu. Rev. Plant Physiol. 48, 251–275. doi: 10.1146/annurev.arplant.48.1.251

Legge, W. G., Tucker, J. R., Bizimungu, B., Tekauz, A., Noll, J. S., Fetch, J.r,., et al. (2011). Norman barley. Can. J. Plant Sci. 91, 1105–1113. doi: 10.4141/cjps2010-020

Li, G., and Yen, Y. (2008). Jasmonate and ethylene signaling pathway may mediate Fusarium head blight resistance in wheat. Crop Sci. 48, 1888–1896. doi: 10.2135/cropsci2008.02.0097

Li, X., Shin, S., Heinen, S., Dill-Macky, R., Berthiller, F., Nersesian, N., et al. (2015). Transgenic wheat expressing a barley UDP-glucosyltransferase detoxifies deoxynivalenol and provides high levels of resistance to Fusarium graminearum. Mol. Plant Microbe Interact. 28, 1237–1246. doi: 10.1094/MPMI-03-15-0062-R

Liu, J., Li, L., Foroud, N. A., Gong, X., Li, C., and Li, T. (2019). Proteomics of bulked rachides combined with documented QTL uncovers genotype nonspecific players of the Fusarium head blight responses in wheat. Phytopathology 1, 111–119. doi: 10.1094/PHYTO-03-18-0086-R

López, M. A., Bannenberg, G., and Castresana, C. (2008). Controlling hormone signaling is a plant and pathogen challenge for growth and survival. Curr. Opin. Plant Biol. 11, 420–427. doi: 10.1016/j.pbi.2008.05.002

Makandar, R., Nalam, V. J., Lee, H., Trick, H. N., Dong, Y., and Shah, J. (2012). Salicylic acid regulates basal resistance to Fusarium head blight in wheat. Mol. Plant Microbe Interact. 25, 431–439. doi: 10.1094/MPMI-09-11-0232

Mascher, M., Gundlach, H., Himmelbach, A., Beier, S., Twardziok, S. O., Wicker, T., et al. (2017). A chromosome conformation capture ordered sequence of the barley genome. Nature 544, 427–433. dx. doi: 10.1038/nature22043

Miller, J. D., Greenhalgh, R., Wang, Y., and Lu, M. (1991). Trichothecene chemotypes of three Fusarium species. Mycologia 83, 121–130. doi: 10.1080/00275514.1991.12025988

Murase, K., Hirano, Y., Sun, T. P., and Hakoshima, T. (2008). Gibberellin-induced DELLA recognition by the gibberellin receptor GID1. Nature 456, 459–463. doi: 10.1038/nature07519

Pekkarinen, A. I., Longstaff, C., and Jones, B. L. (2007). Kinetics of the inhibition of Fusarium serine proteinases by barley (Hordeum vulgare L.) inhibitors. J. Agric. Food Chem. 55, 2736–2742. doi: 10.1021/jf0631777

Pertea, M., Pertea, G. M., Antonescu, C. M., Chang, T.-C., Mendell, J. T., and Salzberg, S. L. (2015). StringTie enables improved reconstruction of a transcriptome from RNA-seq reads. Nat. Biotechnol. 33:2. doi: 10.1038/nbt.3122

Peters, J., van Dam, R., van Doorn, R., Katerere, D., Berthiller, F., Haasnoot, W., et al. (2017). Mycotoxin profiling of 1000 beer samples with a special focus on craft beer. PLoS ONE 12:e0185887. doi: 10.1371/journal.pone.0185887

Petti, C., Khan, M., and Doohan, F. (2010). Lipid transfer proteins and protease inhibitors as key factors in the priming of barley responses to Fusarium head blight disease by a biocontrol strain of Pseudomonas fluorescens. Funct. Integr. Genomics. 10, 619–627. doi: 10.1007/s10142-010-0177-0

Poland, J. A., Balint-Kurti, P. J., Wisser, R. J., Pratt, R. C., and Nelson, R. J. (2009). Shades of gray: the world of quantitative disease resistance. Trends Plant Sci. 14, 21–29. doi: 10.1016/j.tplants.2008.10.006

Ponts, N., Couedelo, L., Pinson-Gadais, L., Verdal-Bonnin, M. N., Barreau, C., and Richard-Forget, F. (2009). Fusarium response to oxidative stress by H2O2 is trichothecene chemotype-dependent. FEMS Microbiol. Lett. 293, 255–262. doi: 10.1111/j.1574-6968.2009.01521.x

Ponts, N., Pinson-Gadais, L., Barreau, C., Richard-Forget, F., and Ouellet, T. (2007). Exogenous H2O2 and catalase treatments interfere with Tri genes expression in liquid cultures of Fusarium graminearum. FEBS Lett. 581, 443–447. doi: 10.1016/j.febslet.2007.01.003

Ponts, N., Pinson-Gadais, L., Boutigny, A.-L., Barreau, C., and Richard-Forget, F. (2011). Cinnamic derived acids significantly affect Fusarium graminearum growth and in vitro synthesis of type B trichothecenes. Phytopathology 101, 929–934. doi: 10.1094/PHYTO-09-10-0230

Puri, K. D., Yan, C., Leng, Y., and Zhong, S. (2016). RNA-Seq revealed differences in transcriptomes between 3ADON and 15ADON populations of Fusarium graminearum in vitro and In Planta. PLoS ONE 11:e0163803. doi: 10.1371/journal.pone.0163803

Puri, K. D., and Zhong, S. (2010). The 3ADON population of Fusarium graminearum found in North Dakota is more aggressive and produces a higher level of DON than the prevalent 15ADON population in spring wheat. Phytopathology 100, 1007–1014. doi: 10.1094/PHYTO-12-09-0332

Qi, P.-F., Balcerzak, M., Rocheleau, H., Leung, W., Wei, Y.-M., Zheng, Y.-L., et al. (2016). Jasmonic acid and abscisic acid play important roles in hostpathogen interaction between Fusarium graminearum and wheat during the early stages of fusarium head blight. Physiol. Mol. Plant Pathol. 93, 39–48. doi: 10.1016/j.pmpp,.2015.12.004

R Core Team (2020). R: A Language and Environment for Statistical Computing. Vienna: R Foundation for Statistical Computing. Available online at: https:// www.R-project.org/ (accessed July 22, 2021).

Rao, S., and Sandhya, H. (2016). “in vitro selection of disease-resistant plants,” in Plant Tissue Culture: Propagation, Conservation and Crop Improvement, eds M. Anis M and N. Ahmad (Singapore: Springer), 395–417. doi: 10.1007/978-981-10-1917-3_17

Rasmussen, S. K., Welinder, K. G., and Hejgaard, J. (1991). cDNA cloning, characterization and expression of an endosperm-specific barley peroxidase. Plant Mol. Biol. 16, 317–327. doi: 10.1007/B. F.00020562

Robinson, M. D., McCarthy, D. J., and Smyth, G. K. (2010). edgeR: a Bioconductor package for differential expression analysis of digital gene expression data. Bioinformatics 26, 139–140. doi: 10.1093/bioinformatics/ btp616 SAS Institute Inc (1989-2019). SAS JMP R 13.2.1. Cary, NC: SAS Institute Inc.

SAS R 9.4, SAS Institute Inc (2013). Statements: Reference. Cary, NC: SAS R 9.4, SAS Institute Inc.

Saville, R. J., Gosman, N., Burt, C. J., Makepeace, J., Steed, A., Corbitt, M., et al. (2012). The ‘Green Revolution’ dwarfing genes play a role in disease resistance in Triticum aestivum and Hordeum vulgare. J. Exp. Bot. 63, 1271–1283. doi: 10.1093/jxb/err350

Schweiger, W., Boddu, J., Shin, S., Poppenberger, B., Berthiller, F., Lemmens, M., et al. (2010). Validation of a candidate deoxynivalenol-inactivating UDPglucosyltransferase from barley by heterologous expression in yeast. Mol. Plant Microbe Interact. 23, 977–986. doi: 10.1094/MPMI-23-7-0977

Sinha, R. C., and Savard, M. E. (1996). Comparison of immunoassay and gas chromatography methods for the detection of the mycotoxin deoxynivalenol in grain samples. Can. J. Plant Pathol. 18, 233–236. doi: 10.1080/07060669609500617

Taheri, P. (2018). Cereal diseases caused by Fusarium graminearum: from biology of the pathogen to oxidative burst-related host defense responses. Eur. J. Plant Pathol. 152, 1–20. doi: 10.1007/s10658-018-1471-2

Tian, T., Liu, Y., Yan, H., You, Q., Yi, X., Du, Z., et al. (2017). agriGO v2.0: a GO analysis toolkit for the agricultural community, 2017 update. Nucleic Acids Res. 45:gkx382. doi: 10.1093/nar/gkx382

Trail, F. (2009). For blighted waves of grain: Fusarium graminearum in the postgenomics era. Plant Physiol. 149, 103–110. doi: 10.1104/pp.108.129684

Tucker, J. R., Badea, A., Blagden, R., Pleskach, K., Tittlemier, S. A., and Fernando, W. G. D. (2019). Deoxynivalenol-3-glucoside content is highly associated with deoxynivalenol levels in two-row barley genotypes of importance to Canadian barley breeding programs. Toxins 11:319. doi: 10.3390/toxins11060319 von der

Ohe, C., Gauthier, V., Tamburic-Ilincic, L., Brule-Babel, A., Fernando, W. G. D., Clear, R., et al. (2010). A comparison of aggressiveness and deoxynivalenol production between Canadian Fusarium graminearum isolates with 3-acetyl and 15-acetyldeoxynivalenol chemotypes in field-grown spring wheat. Eur. J. Plant Pathol. 127, 407–417. doi: 10.1007/s10658-010-9607-z

Walkowiak, S., Bonner, C. T., Wang, L., Blackwell, B., Rowland, O., and Subramaniam, R. (2015). Intraspecies interaction of Fusarium graminearum contributes to reduced toxin production and virulence. Mol. Plant Microbe Interact. 28, 1256–1267. doi: 10.1094/MPMI-06-15-0120-R

Wang, L., Li, Q., Liu, Z., Surendra, A., Pan, Y., Yifeng Li, L., et al. (2018). Integrated transcriptome and hormone profiling highlight the role of multiple phytohormone pathways in wheat resistance against fusarium head blight. PLoS ONE 13:e0207036. doi: 10.1371/journal.pone.0207036

Wang, Z., Gerstein, M., and Snyder, M. (2009). RNA-Seq: a revolutionary tool for transcriptomics. Nat. Rev. Genet. 10, 57–63. doi: 10.1038/nrg2484

Ward, T. J., Clear, R. M., Rooney, A. P., O’Donnell, K., Gaba, D., Patrick, S., et al. (2008). An adaptive evolutionary shift in Fusarium head blight pathogen populations is driving the rapid spread of more toxigenic Fusarium graminearum in North America. Fungal Genet. Biol. 45, 473–484. doi: 10.1016/j.fgb.2007.10.003

Wilson, W. B., Dahl, B., and Nganje, W. (2018). Economic costs of Fusarium Head Blight, scab and deoxynivalenol. World Mycotoxin J. 11, 291–302. doi: 10.3920/WMJ2017.2204

Wu, J., Wang, Y., Kim, S. T., Kim, S. G., and Kang, K. Y. (2013). Characterization of a newly identified rice chitinase-like protein (OsCLP) homologous to xylanase inhibitor. BMC Biotechnol. 13:4. doi: 10.1186/1472-6750-13-4

Xing, L.-P., He, L.-Q., Xiao, J., Chen, Q.-G., Li, M.-H., Shang, Y., et al. (2017). An UDP-Glucosyltransferase gene from barley confers disease resistance to Fusarium head blight. Plant Mol. Biol. Rep. 35, 224–236. doi: 10.1007/s11105-016-1014-y

Zantinge, J., Kumar, K., Xi, K., Johns, M., Murray, A., Jones, T., et al. (2010). Comparison of barley seed proteomic profiles associated with Fusarium head blight reaction. Can. J. Plant Pathol. 32, 496–512. doi: 10.1080/07060661.2010.529252

Zhou, B., Schwarz, P., He, G.-Q., Gillespie, J., and Horsley, R. (2008). Effect of enzyme pretreatments on the determination of deoxynivalenol in barley. J. Am. Soc. Brew. Chem. 66, 103–108. doi: 10.1094/ASBCJ-2008-0226-01

Related topics:
Authors:
Dilantha Fernando
University of Manitoba
Recommend
Comment
Share
Profile picture
Would you like to discuss another topic? Create a new post to engage with experts in the community.
Join Engormix and be part of the largest agribusiness social network in the world.