Introduction
The periparturient period in dairy cows is characterized by substantial metabolic stress, endocrine changes, depressed feed intake, and negative energy balance [1]. In response to these changes, dairy cows mobilize adipose tissue triglyceride (TG), leading to elevated non-esterified fatty acid (NEFA) concentrations in the blood. The high flux of blood NEFA to the liver often exceeds the capacity of the liver to completely oxidize NEFA to CO2, resulting in partial oxidation to form ketones or esterification to form TG within hepatocytes [2]. Excessive production of ketones often leads to ketosis, which is characterized by elevated blood concentrations of β-hydroxybutyrate (BHBA), depressed appetite, and decreased milk production [3]. Furthermore, because ruminants are inefficient at exporting TG from the liver, excessive TG accumulation or fatty liver occurs. Ketosis and fatty liver affect up to 50% of dairy cows, compromising production, health, and reproduction [3,4]. Gluconeogenesis is of great importance at all times in ruminants, providing up to 90% of the necessary glucose [5]. Meeting glucose needs can be a tremendous metabolic challenge for early-lactation dairy cows, which often experience inadequate feed intake. Although lipid and glucose metabolism in periparturient cows has been extensively studied, the mechanisms underlying the development of these metabolic disorders are not fully understood.
Inflammatory mediators play critical roles in immunity and metabolism, and recent research has suggested that inflammation is involved in metabolic disorders as well. For example, obesity is associated with a chronic low-grade inflammatory state in multiple metabolic tissues including adipose, liver, muscle, pancreas, and brain [6]. Compared with lean controls, obese mice had increased levels of adipose tissue tumor necrosis factor-α (TNFα), a potent cytokine capable of triggering inflammatory responses [7]. In dairy cows, fatty liver was associated with increased plasma inflammation markers, including haptoglobin and serum amyloid A [8]. Although a recent study reported that plasma concentrations of TNFα in periparturient cows were decreased postpartum compared with prepartum [9], elevated activity of serum TNFα was observed in cows with moderate to severe fatty liver [10]. In light of these findings, we hypothesized that chronic low-grade inflammation may be a mechanism underlying bovine fatty liver. In fact, we found that low-level administration of the recombinant bovine TNFα (rbTNFα) for 7 d promoted liver inflammation and TG accumulation [11]. However, late-lactation animals were used in that work, and it is unclear if this model is applicable to cows in the first week of lactation, when fatty liver naturally occurs. Beyond direct promotion of fatty liver, hepatic inflammation may also affect glucose production. Bradford et al. [11] reported that rbTNFα administration reduced liver gluconeogenic gene expression in late-lactation cows. If inflammatory cytokines impair glucose production in early lactation animals, the resulting hypoglycemia would likely increase adipose TG mobilization and metabolic disorders
We hypothesized that metabolic stress in early-lactation cows is exacerbated by inflammatory challenge, thereby adversely affecting production and health. Therefore, the objective of this study was to determine whether exogenous rbTNFα administration promotes inflammation and TG accumulation, impairs gluconeogenesis, alters lipid metabolism, and affects milk production and health status in early-lactation dairy cows. A greater understanding of the pathological impact of inflammatory pathways in these animals may improve our ability to prevent metabolic disorders and increase production.
Materials and Methods
The Kansas State University Institutional Animal Care and Use Committee approved all experimental procedures.
Design and Treatments
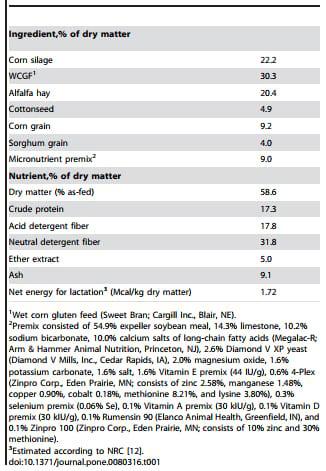
A recombinant expression vector encoding the secreted form of bovine TNFα (Entrez Protein Accession AAB84086.1, region 77– 233) was expressed in Escherichia coli and purified by a commercial laboratory (GenScript Corp., Piscataway, NJ). Purity of the isolated rbTNFα was verified by SDS-PAGE, and endotoxin was removed using polymyxin B until contamination was less than < 1 EU/μg protein. Thirty-three Holstein cows (9 primiparous and 24 multiparous; body condition score: 3.26±0.31, body weight 741±83 kg; mean 6 SD) were randomly assigned to 1 of 3 treatments at parturition. Treatments were balanced within parity, and dystocia did not differ by treatment (calving difficulty scores: 1.36, 1.18, and 1.18±0.5 for Control, 1.5 μg/kg and 3.0 μg/kg TNF, respectively; 1 to 5 scale, with 1 = no difficulty). Treatments (dose per d) were no rbTNFα (Control; 10% glycerol in saline), 1.5 μg rbTNFα/kg body weight in saline with 10% glycerol, and 3.0 μg rbTNFα/kg body weight in saline with 10% glycerol. These doses are slightly less and slightly more, respectively than the 2.0 μg/kg dose that was previously shown to alter hepatic nutrient metabolism in lactating cows [10]. Glycerol was included in the solution to improve solubility of the rbTNFα protein. Cows were injected subcutaneously once daily (1600 h) for the first 7 d of lactation. Cows were milked 3 times daily (0400, 1200, and 2000 h) in a milking parlor and fed twice daily (0800 and 1600 h) for ad libitum intake of a diet formulated to meet National Research Council (NRC) [12] nutrient requirements. Ingredient and nutrient composition of the diet are shown in Table 1.
Table 1. Ingredient and nutrient composition of the diet.
Sample and Data Collection and Analysis
Feed Intake, Milk Production, Energy Balance, and Health Monitoring. During the 7-d experimental period, intake of feed and water and milk yield were recorded daily. Milk samples were collected from d 4 to 7 of treatment at each of the 3 milkings for analysis of milk components. Samples were analyzed for concentrations of fat, true protein, lactose (B-2000 Infrared Analyzer; Bentley Instruments Inc., Chaska, MN), urea nitrogen (MUN spectrophotometer, Bentley Instruments Inc.), and somatic cells (SCC 500, Bentley Instruments Inc., Heart of America DHIA, Manhattan, KS). Somatic cell linear score was calculated as described by Shook [13]: log2(somatic cell count/100) +3. Energy balance was calculated for each cow using the following equation from NRC [12]: energy balance = net energy intake 2 (net energy of maintenance + net energy of lactation). Net energy intake = dry matter intake x net energy density of the diet [12]; net energy of maintenance = 0.08 x body weight0.75; net energy of lactation = [(0.0929x fat%)+(0.05476protein%)+(0.0395x lactose%)] x milk yield. In all equations, energy is expressed in Mcal and mass in kg.
Cows were monitored daily for health status. Ketosis was recorded when urine acetoacetate exceeded 80 μg/dL on any day or 40 μg/dL for 2 consecutive days (Ketostix; Bayer Corp. Diagnostics Division, Elkhart, IN). Fever was diagnosed when a cow had a rectal temperature greater than 39.4ºC. Other disorders or diseases, including mastitis, metritis, and milk fever, were diagnosed according to the guidelines by Kelton et al. [14].
Plasma Metabolites and Hormones. Blood samples were collected from coccygeal vessels daily (0800 h) in 2 tubes, one containing potassium EDTA and the other containing potassium oxalate with sodium fluoride as a glycolytic inhibitor (Vacutainer; Becton Dickinson, Franklin Lakes, NJ). Blood was centrifuged at 2,000 x g for 10 min immediately after sample collection, and plasma was frozen at 220ºC until further analysis. Plasma samples collected daily during the 7-d treatment period were analyzed for NEFA (NEFA-HR; Wako Chemicals USA Inc., Richmond, VA), glucose (kit #439-90901; Wako Chemicals USA Inc.), BHBA (kit #H7587-58; Pointe Scientific Inc., Canton, MI), and TG (#10010303; Cayman Chemical, Ann Arbor, MI). Plasma samples collected on d 0, 3, 5, and 7 of treatment were analyzed for TNFα (an ELISA method described by Farney et al. [15]), insulin (ELISA kit #10-1201-01; Mercodia AB, Uppsala, Sweden), and haptoglobin (ELISA kit #2410-7; Life Diagnostics, West Chester, PA). Plasma samples collected on d 7 of treatment were analyzed for 3-methylhistidine. Samples were prepared by mixing 500 μL of plasma with 500 μL of Seraprep (Pickering Labs, Mountain View, CA) and frozen overnight. The deproteinized plasma was then thawed, vortexed, and centrifuged at 17,0006g for 10 min. The resulting supernatant was analyzed for 3-methylhistidine using Li+ cation exchange chromatography and detection by fluorimetry following post column derivitization with o-phthalaldehyde. The HPLC column and all reagents and eluents were purchased from Pickering Labs (Mountain View, CA). Column flow rate was 0.375 μL/min and column temperature was maintained at 36uC. Injection volumn was 10 μL. Eluent 1 (Li357) was run for 5 min then eluent 2 (Li750) for 15 min and eluent 3 (RG003) for 5 min. The column was then re-equilibrated back to eluent 1 for 20 min. Post column derivitization was performed using a post column mixing T at a flow rate of 0.375 μL/min using 950 μL OPA diluent (OD104) containing 0.3 g o- phthalaldehyde, 2.0 g Thiofluor, and 3 μL 30% Brij 35. The fluorimeter excitation was set to 330 nm and emission to 465 nm.
Plasma Eicosanoids. Plasma samples collected on d 0, 1, 3, and 5 of treatment were analyzed for eicosanoids as previously described [16]. Plasma samples (500 μL) were mixed with 1 μL ice cold methanol, 6 μL antioxidant/reducing agent containing EDTA, butylhydroxytoluene, triphenylphosphine, and indomethacin (4 μL/μL), 200 μL of a mixture of internal standards, and 1 μL of formic acid. Sample mixtures were centrifuged at 4ºC for 10 min at 3,000xg, and the supernatant was used for solid-phase extraction using Strata-X SPE columns (Phenomenex Inc., Torrance, CA). Eicosanoids were isolated using 2 distinct ultra-high–pressure liquid chromatography (UPLC) and mass spectrometry (UPLC-MS) methods. Both methods used reverse-phase liquid chromatography on an Acquity UPLC BEH C18 1.7-μm column (2.1x100 μm; Waters Corp., Milford, MA) at a flow rate of 0.6 μL/min at 35ºC and a single-quadrupole H-class Acquity SQD mass spectrometer in electrospray negative ionization mode (Waters Corp.). The electrospray voltage was 23 kV, and the turbo ion spray source temperature was 450ºC. Nitrogen was used as the drying agent. For each method, a 10-μL sample was injected 3 consecutive times using a 10-μL injection loop. An isocratic mobile phase consisting of acetonitrile/water/formic acid (45/55/ 0.01; vol/vol/vol) with an analysis time of 15 min was used to measure leukotriene B4 (LTB4), thromboxane B2 (TXB2), prostaglandin E2 (PGE2), prostaglandin F2 (PGF2), lipoxin A4, resolvin D1, and resolvin D2. The second method used an isocratic mobile phase of acetonitrile/methanol/water/formic acid (47.4/15.8/ 26.8/0.01; vol/vol/vol/vol) and an analysis time of 10 min to analyze 9-hydroxyoctadecadienoic acid (HODE), 13-HODE, 9-oxo-octadecadienoic acid (oxoODE), 13-oxoODE, 5-hydroxyeicosatetraenoic acid (HETE), 15-HETE, 7-maresin 1, leukotriene D4 (LTD4), and protectin.
Quantitation of eicosanoid concentrations was performed with Waters Empower 2 software (Waters Corp.). A linear calibration curve with 5 points (R2>0.99) was generated for each eicosanoid with standards and internal standards purchased from Cayman Chemical Co. (Ann Arbor, MI). The curves ranged from 0.0024 to 2.38 ng/μL. Empower 2 identified the sample peak by matching its retention time with the standard. A response was calculated for each matched peak by dividing the sample peak’s response by its internal standard’s response. This response was multiplied by the concentration of the internal standard for each analyte. The concentration of each analyte was calculated using the response peak and injection volume.
Glucose Turnover Rate. After daily blood sampling on d 5 of treatment, jugular vein catheters were placed and at least 18 h of recovery were allowed prior to sample collection through the catheters. On treatment d 7, cows were given a glucose bolus containing U-13C-glucose (99 atom%, Sigma-Aldrich Co., St. Louis, MO) through jugular catheters [17]. Jugular blood samples were collected 10 min prior to infusion and at 10, 20, 30, 40, 50, 60, 90, and 120 min post-infusion. Each cow received approximately 1 g of U-13C-glucose in 50 μL of sterile saline; syringes were weighed immediately before and after infusion to determine the exact amount administered. Catheters were flushed with a sterile solution of 3.5% sodium citrate after the labeled glucose bolus (20 μL) and after each blood sample collection (5 μL). Plasma glucose concentration was quantified to verify that steady-state conditions were met.
Plasma samples collected for the glucose turnover assay were analyzed for U-13C-glucose enrichment (Metabolic Solutions, Inc., Nashua, NH). Glucose was extracted and converted to aldonitrile pentaacetate derivative [18], and negative chemical ionization GC/MS (Hewlett-Packard 5890; Agilent Technologies, Santa Clara, CA) was used to analyze derivatized samples. The isotopic composition of the glucose was determined by monitoring unlabeled (M+0: m/z = 328) versus U-13C-labeled (M+6: m/ z = 334) glucose derivatives. This approach, as opposed to oxidation of glucose and measurement of CO2 enrichment, ensures that results are not biased by carbon recycling via the Cori cycle. Turnover rate of plasma glucose was calculated from the disappearance curve for U-13C-glucose. Enrichment of plasma glucose for each animal was fitted to an exponential decay curve according to the following equation: Et= E0xe -kt, where t = time relative to infusion (min), Et= enrichment of plasma glucose (U-13C-glucose: unlabeled glucose ratio) at time t, E0= enrichment at time t = 0, and k = rate constant (min-1). After using the best-fit equations to determine k and E0, the total glucose pool was calculated by the following equation: G = M/E0, where G = total glucose pool (g) and M = mass of tracer infused (g). Plasma glucose turnover rate (GTR, g/min) was calculated according to the equation GTR = G x k. Samples collected 10 min prior to infusion of U-13C-glucose were also analyzed to verify the lack of natural occurrence of the M+6 isotopomer.
Liver TG. At the end of treatment d 7, liver samples were collected by percutaneous biopsy as described by Morey et al. [19]. For analysis of TG content, approximately 20 μg of liver was placed into 500 μL of chilled phosphate buffered saline (pH 7.4) and homogenized. The homogenate was centrifuged at 2,000 x g for 10 min at 4ºC, and 100 μL of the supernatant was then removed for free glycerol and total protein analyses. Triglyceride content was measured using a method adapted from Starke et al. [20]. The remaining liver homogenate was incubated with 100 μL of lipase (porcine pancreatic lipase; MP Biomedicals, Solon, OH) for 16 h at 37ºC, and glycerol content was then determined by an enzymatic glycerol phosphate oxidase method (#F6428, Sigma-Aldrich Co.). Triglyceride content was calculated based on the difference between glycerol concentrations before and after lipase digestion. Total protein content of the original homogenate was analyzed by a Coomassie blue [21] colorimetric method (kit #23236; Thermo Scientific Pierce, Rockford, IL). To avoid potential bias introduced by differences in moisture content of liver samples, liver TG concentration was normalized by protein concentration, which is unaltered in fatty liver [22].
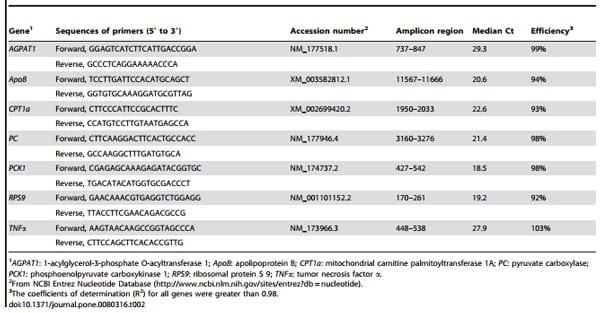
Transcript Abundance. Total RNA was extracted from liver tissue using a commercial kit (RNeasy Lipid Tissue Mini Kit; Qiagen Inc., Valencia, CA) according to the manufacturer’s instructions. Two micrograms of total RNA was used as the template for the reverse transcriptase reaction using random primers (High-Capacity cDNA RT Kit; Applied Biosystems, Foster City, CA). Quantitative real-time PCR was performed in duplicate on 96-well plates with 5% of the cDNA product in the presence of 200 nM gene-specific forward and reverse primers with real-time SYBR green fluorescent detection using SYBR Green Premix reagent (7500 Fast Real-Time PCR System, Applied Biosystems). Primers were designed (www.ncbi.nlm.nih. gov/tools/primer-blast/) using GenBank sequences (Table 2). Data were recorded and analyzed with Sequence Detector software (Applied Biosystems). All sample values were normalized against ribosomal protein subunit 9 (RPS9) values [23], and relative gene expression was quantified by using the 2-DCt method. Treatment did not influence the Ct value for RPS9 (P = 0.56), suggesting that it served as a valid control gene.
Western Blot. Relative protein abundance of IkBα, c-Jun, phosphorylated c-Jun, and TNFα in liver samples was determined by Western blot. Liver samples (~20 μg) were homogenized at 4ºC in RIPA lysis buffer containing a broad-spectrum protease inhibitor cocktail (Protease Inhibitor Cocktail I; EMD Millipore, Billerica, MA) and a phosphatase inhibitor (PhosphoStop; Santa Cruz Biotechnology, Santa Cruz, CA). The homogenate was centrifuged at 15,000 x g for 10 min at 4ºC, and total protein concentration of the supernatant was measured [21]. Forty micrograms of total protein from liver tissue were heated at 90ºC for 5 min, vortexed, and loaded onto a 4 to 12% Tris-HCl gel for electrophoresis. Samples were separated by SDS-PAGE and dry-transferred onto nitrocellulose membranes (iBlot; Invitrogen, Carlsbad, CA). Membranes were blocked for 2 h in blocking buffer (5% dry milk in Tris-HCl buffer, pH 7.5, with 0.05% Tween 20). After incubation with blocking buffer, the membranes were washed 3 times for 5 min each with washing buffer (phosphate-buffered saline, pH 7.5, containing 0.05% Tween 20). Membranes were then incubated with primary antibodies (diluted 1:250) from Santa Cruz Biotechnology against IkBα (catalog #sc-847), c-Jun (#sc-44), and phosphorylated c-Jun (#sc- 822) overnight at 4ºC. After washing, secondary antibody diluted 1:10,000 was incubated for 1 h at room temperature. Antibody incubation and detection for TNFα was carried out as previously described [11]. Immunodetection was performed by chemiluminescence (West-Dura; Thermo Scientific, Waltham, MA), and bands were quantified by scanning densitometry (ChemiDoc-It Imaging System; UVP Inc., Upland, CA).
Calculations and Statistical Analyses
One cow that received 3 μg/kg rbTNFα developed a severe fever on d 6 of treatment, and the d 7 treatment was not given. Consequently, the liver biopsy and glucose turnover test were not conducted for this cow, but all other data were retained through d 6. Plasma glucose data indicated that 2 cows did not meet steady-state conditions during the glucose turnover test; these cows were not used for turnover rate analysis. In total, data from 33, 32, and 30 cows were used for production responses and plasma analyses, liver tissue analyses, and glucose turnover analysis, respectively. Data were analyzed using the MIXED Procedure of SAS (version 9.2; SAS Institute Inc., Cary, NC) to assess the fixed effects of treatment, parity, time, and 2- and 3-way interactions; cow was included as a random effect. Data were log-transformed for analysis when necessary (including plasma concentrations of
TNFα and 3-methylhistidine, and hepatic transcript abundance of AGPAT1, PCK1, and CPT1a) to achieve a normal distribution of residuals, and data presented are back-transformed in these cases. Repeated measures over time were modeled with either autoregressive or heterogeneous autoregressive covariance structures, depending on which analysis had the lowest Bayesian Information Criterion value. Denominator degrees of freedom were estimated using the Kenward-Rogers method. Values were deemed outliers and omitted from analysis when Studentized residuals were >3.5 or <-3.5. Interactions were investigated when P<0.10 using the slice option, and slices were declared significant at P<0.05. Contrasts were used to evaluate Control vs. rbTNFα treatments and 1.5 μg/kg vs. 3.0 μg/kg rbTNFα doses. Health disorders were analyzed using JMP (version 8.0; SAS Institute Inc., Cary, NC). A nominal logistic analysis was first run for each health disorder to assess the fixed effects of treatment, parity, and treatment x parity interaction. For those disorders with an interaction P<0.10, Fisher’s exact test was used to assess rbTNFα and dose contrasts within each parity group. For all other disorders, Fisher’s exact test was used to test these contrasts across all animals. Significance was declared at P≤0.05 and tendencies at 0.05<P<0.10.
Table 2. Primers used for real-time PCR gene expression analysis.
Results
Inflammatory Signals
Compared with Control, plasma TNFα concentrations tended to be increased (P = 0.09) by rbTNFα treatments, but 1.5 μg/kg did not differ (P = 0.19) from 3 μg/kg rbTNF (Figure 1A). Plasma haptoglobin concentrations were greater (P<0.01, Figure 1B) in rbTNFα treatments than Control, but did not differ between 1.5 and 3 μg/kg rbTNF (P = 0.68). Across the 3 groups, haptoglobin levels were comparable (P = 0.94) at parturition, but increased during the first week of lactation in response to rbTNFα. On d 5 and 7 of treatment, rbTNFα treatments increased haptoglobin concentration by ~2.5- and ~3.5-fold, respectively, compared with Control.
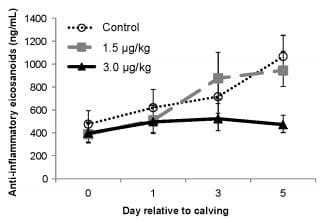
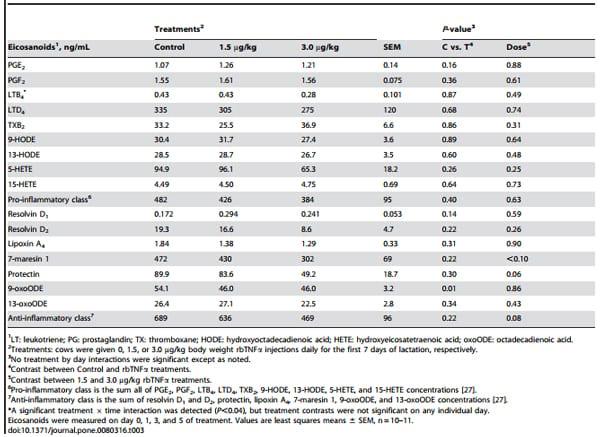
Plasma eicosanoid results are shown in Table 3. Most eicosanoids were unaffected (P>0.10) by treatments; out of the 16 measured eicosanoids, only 9-oxoODE was decreased (P = 0.01) by rbTNFα administration. The pro-inflammatory class as a composite was unaffected by treatments; however, the anti-inflammatory class tended (P = 0.08) to be decreased by the 3 μg/ kg compared with 1.5 μg/kg rbTNFα dose (Figure 2), though rbTNFα treatment did not differ from Control (P = 0.22).
Plasma eicosanoids with significant (P<0.05) day effects are presented in Table 4. Plasma concentrations of TXB2, 15-HETE, and 9-HODE were elevated around parturition and decreased during the first week of lactation. In contrast, resolvin D2 and 7- maresin 1 increased gradually after parturition. The pro-inflammatory class decreased (P = 0.02) during the first week of lactation, whereas the anti-inflammatory class (P<0.01) increased after parturition.
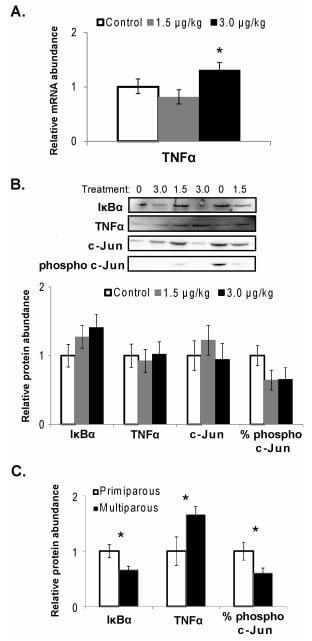
As shown in Figure 3A, hepatic transcript abundance of TNFα was increased (P = 0.02) by 3 μg/kg compared with 1.5 μg/kg rbTNFα, but overall, rbTNFα treatments did not differ from Control (P = 0.73). There were no treatment effects (P>0.10) for protein abundance of TNFα, c-Jun, or relative c-Jun phosphorylation (Figure 3B). There was a tendency for a treatment 6parity interaction (P = 0.07) for IkBα, reflecting increased (P = 0.04) IkBα abundance by rbTNFα treatment in primiparous cows (data not shown). Compared with primiparous cows, IkBα was decreased (P = 0.02), TNFα was increased (P = 0.04), and relative c-Jun phosphorylation was decreased (P = 0.04) in multiparous cows (Figure 3C).
Figure 1. Plasma concentrations of TNFα and haptoglobin during 7 days of rbTNFα or Control administration. (A) Plasma TNFα tended to be increased by rbTNFα treatments (P = 0.09), but no difference was detected between 1.5 and 3.0 μg/kg rbTNFα treatments (P = 0.19). (B) Haptoglobin differed between rbTNFα treatments and Control (P = 0.01), but not between 1.5 and 3.0 μg/kg rbTNFα treatments (P = 0.68). Values are least squares means 6 SEM, n = 10–11. doi:10.1371/journal.pone.0080316.g001
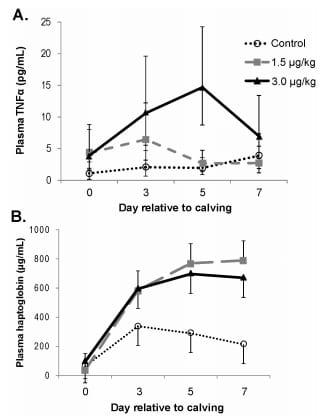
Figure 2. Composite plasma concentration of anti-inflammatory eicosanoids during the first 5 days of rbTNFα or Control administration. The total anti-inflammatory eicosanoid concentration represents the sum of resolvin D1 and D2, protectin, lipoxin A4, 7- maresin 1, 9-oxoODE, and 13-oxoODE concentrations [27]. The 3.0 μg/ kg dose tended to differ from the 1.5 μg/kg rbTNFα dose (P = 0.08), but no overall rbTNFα was detected (P = 0.22). A tendency for a dose by time interaction was also observed (P = 0.06), with a significant dose contrast on day 5 (P,0.01). Values are least squares means 6 SEM, n = 10–11. doi:10.1371/journal.pone.0080316.g002
Table 3. Concentrations of plasma eicosanoids in early-lactation dairy cows during the experimental period.
Energetics
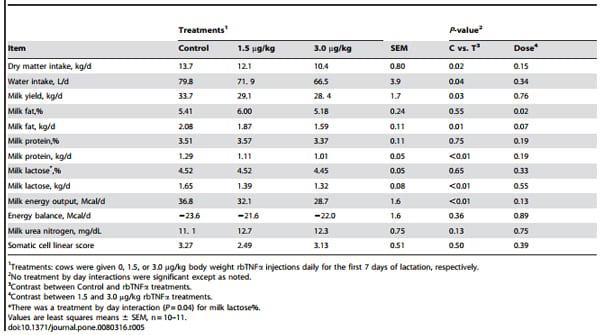
Dry matter and water intake were decreased (P<0.05) by rbTNFα treatments, but no dose effect (P>0.10) was observed (Table 5). Cows were in negative energy balance during the experimental period, and the energy balance values were not affected (P>0.10) by treatments. Milk yield was decreased (P = 0.03) by rbTNFα treatments, with no dose effect (P = 0.76). Similar to milk yield, milk energy output was decreased (P<0.01) by rbTNFα administration. Milk fat percentage was decreased (P = 0.02) by 3.0 μg/kg rbTNFα compared with the 1.5 μg/kg dose, but overall, rbTNFα treatments did not differ from Control (P = 0.55). Nevertheless, milk fat yield was decreased (P = 0.01) in cows treated with rbTNFα, and there was a tendency for decreased (P = 0.07) milk fat yield for the 3.0 μg/kg rbTNF dose compared with 1.5 μg/kg. Milk protein and lactose content were unaffected by treatment (P>.0.10), but yields of both were decreased (P<0.01) by rbTNFα administration. Milk urea nitrogen concentration and somatic cell linear score were not affected (P>0.10) by treatments.
Metabolism
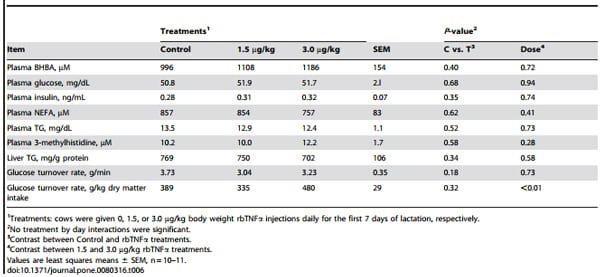
Plasma concentrations of glucose, insulin, BHBA, NEFA, TG, and 3-methylhistidine, and liver TG were not affected (P>0.10, Table 6) by rbTNFα treatment. Glucose turnover rate (Table 6) was unaffected (P =0.18) by rbTNFα treatments. When expressed relative to dry matter intake (daily glucose turnover rate/day 7 dry matter intake), 3 μg/kg rbTNFα was greater (P,0.01) than other treatments.
Table 4. Concentrations (across treatments) of plasma eicosanoids in early-lactation dairy cows with significant (P<0.05) day effects during the experimental period.
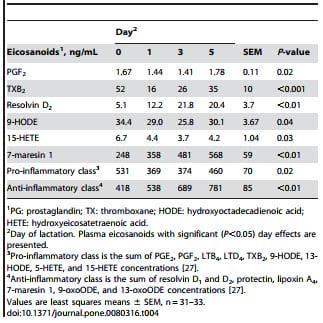
Figure 3. Hepatic mRNA abundance of TNFα and protein abundance of key mediators involved in inflammatory pathways. Liver samples were collected after 7 days of rbTNFα or Control administration. (A) Hepatic TNFα transcript abundance was increased by 3.0 vs. 1.5 μg/kg rbTNFα treatments (P = 0.02), but did not differ between rbTNFα treatments and Control (P = 0.73). (B) Western blot images are shown for 6 cows along with densitometry data from analysis of all samples for hepatic IkBα (37 kDa), TNFα (17 kDa), and total and phosphorylated c-Jun (39 kDa). There was a tendency for treatment by parity interaction (P = 0.07) for IkBα, reflecting increased (P = 0.04) IkBα abundance by rbTNFα treatment in primiparous cows (data not shown). No treatment effects (P.0.10) were observed for hepatic TNFα, c-Jun, or relative c-Jun phosphorylation. (C): Parity significantly affected hepatic IkBα (P = 0.02), TNFα (P = 0.04), and relative c-Jun phosphorylation (P = 0.04). Values are means 6 SEM, n = 10–11 (A and B) or 9–24 (C). doi:10.1371/journal.pone.0080316.g003
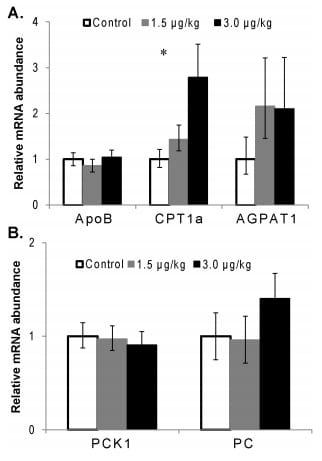
As shown in Figure 4, the mRNA abundance of mitochondrial carnitine palmitoyltransferase 1a (CPT1a) was increased (P<0.01) by rbTNFα treatments, with 3 μg/kg greater (P = 0.04) than 1.5 μg/kg rbTNF. No treatment effects (P>0.10) were detected for apolipoprotein B (ApoB), 1-acylglycerol-3-phosphate O-acyltransferase 1 (AGPAT1), phosphoenolpyruvate carboxykinase 1 (PCK1), or pyruvate carboxylase (PC).
Health Disorders
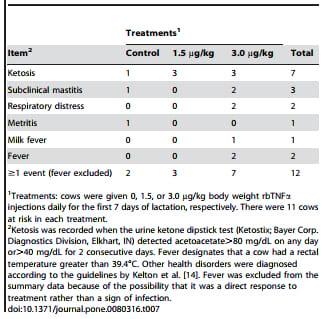
Incidence of health disorders is shown in Table 7. There was a tendency for increased (P = 0.08) risk of experiencing 1 or more health disorders for 3 μg/kg compared with 1.5 μg/kg rbTNFα, although the overall rbTNFα effect was not significant (P = 0.25). Ketosis incidence reported in Table 7 was based on detection of urine ketones; of the cows identified by this method, 5 cows (1 control, 2 on each of the rbTNFα treatments) had plasma BHBA concentrations that exceeded 3 mM on at least one day, identifying them as clinical cases, whereas the 2 others exceeded the 1.4 mM threshold for subclinical ketosis [3].
Discussion
Our previous research demonstrated that administration of 2 μg/kg body weight rbTNFα daily for 7 d was adequate to mimic a chronic low-grade inflammatory state without causing acute systemic inflammation in late-lactation cows [11]. Therefore, in the present study, we administered 1.5 and 3 μg/kg rbTNFα in an attempt to characterize a similar low-grade inflammation in early lactation cows, which experience dramatic energy demands of milk production and tremendous metabolic stress compared with late-lactation animals. Although blood samples were collected 16 h after the previous injection, we still observed a tendency for elevated plasma TNFα concentrations in treated cows, indicating a sustained chronic inflammation status in cows receiving rbTNFα. Moreover, 3 μg/kg rbTNFα administration increased hepatic transcript abundance of TNFα, further supporting that treatment enhanced pro-inflammatory responses.
We also evaluated plasma concentrations of haptoglobin and eicosanoids, and the protein abundance of key inflammatory mediators in the liver. Haptoglobin is an acute phase protein primarily released by the liver in inflammation [24]. Our finding that rbTNFα increased haptoglobin agrees with a previous study that daily administration of 2.5 μg/kg rbTNFα for 7 d dramatically elevated plasma haptoglobin in lactating cows [25]. Interestingly, haptoglobin elevation has been associated with bovine fatty liver [4], suggesting that liver TG accumulation may be associated with inflammation. However, recent research indicated that excess NEFA influx to the liver, rather than hepatic TG accumulation per se, causes liver damage through promoting lipotoxicity, oxidative stress, and inflammatory reactions [26]. In the present study, neither NEFA nor liver TG were affected by treatments, suggesting that rbTNFα increased haptoglobin independent of altered lipid mobilization.
Eicosanoids are a family of signaling molecules produced by oxidation of 20-carbon essential fatty acids. They exert complex control over inflammation, and can either enhance (such as certain types of prostaglandins, thromboxanes, and leukotrienes) or resolve (such as resolvins, protectins, and maresins) inflammatory responses depending on their types and the timing of production [27]. The increased lipolysis and elevated plasma NEFA in early lactation may increase the supply of fatty acid substrates for eicosanoid production, thereby affecting the duration and magnitude of inflammation. In the present study, 6 out of the 16 measured plasma eicosanoids were significantly altered over time, but few treatment effects were detected for eicosanoids. One interesting finding was that the highest dose of rbTNFα tended to suppress the anti-inflammatory eicosanoid class, primarily reflecting decreased concentrations of 7-maresin 1, protectin, and 9- oxoODE. We are unaware of evidence in the literature of cytokines inhibiting release of anti-inflammatory eicosanoids, but such an effect is consistent with the pro-inflammatory effects of TNFα [7]. We cannot rule out the possibility that decreases in anti-inflammatory eicosanoids may have been driven by an unknown mediator rather than a direct effect of TNFα. Still, it is intriguing that rbTNFα administration apparently did more to suppress the production of resolving lipid mediators than to enhance the production of inflammatory lipids, and this result should inform choices about measures of interest in future studies.
Table 5. Production responses in early-lactation dairy cows during the experimental period.
Table 6. Plasma metabolites and hormones, liver triglycerides, and glucose turnover rate in early-lactation dairy cows.
Figure 4. Hepatic abundance of transcripts involved in lipid metabolism (A) and gluconeogenesis (B). Liver samples were collected after 7 days of rbTNFα or Control administration. Differences were observed between rbTNFα treatments and Control (P,0.01), and between 1.5 and 3.0 μg/kg rbTNFα treatments (P = 0.04) for CPT1a. No treatment effects (P.0.10) were detected for ApoB, AGPAT1, PCK1, or PC. AGPAT1: 1-acylglycerol-3-phosphate O-acyltransferase 1; ApoB: apolipoprotein B; CPT1a: mitochondrial carnitine palmitoyltransferase 1A; PC: pyruvate carboxylase; PCK1: phosphoenolpyruvate carboxykinase 1. Values are means 6 SEM, n = 10–11. doi:10.1371/journal.pone.0080316.g004
Table 7. Health disorders in early-lactation dairy cows during the experimental period.
We found that concentrations of pro-inflammatory eicosanoids, including certain types of prostaglandins and thromboxanes, were elevated around parturition and decreased during the first week of lactation, whereas pro-resolving metabolites, such as resolvin D2 and 7-maresin 1, increased after parturition. Consistent with the results of the above-mentioned eicosanoids, the composite proinflammatory class was elevated at parturition and decreased thereafter, whereas the anti-inflammatory class changed in the opposite direction. Although the inflammatory state of postpartum dairy cows has been well documented [28], these are the first data to document an increase in anti-inflammatory eicosanoids during the resolution of inflammation as lactation proceeds. The causative role of eicosanoids in this resolution phase should be a fruitful area for further investigation.
Nuclear factor-kB (NF-kB) is a key transcription factor that plays crucial roles in inflammation [29]. In nonstimulated cells, NF-kB is bound to inhibitory IkB proteins and sequestered in the cytoplasm. Activation of NF-kB primarily occurs via the phosphorylation, ubiquitination, and degradation of IkB proteins; subsequently, the liberated NF-kB is translocated to the nucleus to drive expression of inflammatory genes [30]. One of the major IkB proteins in inhibiting NF-kB activation is IkBα, the abundance of which can be used to estimate anti-inflammatory status. In this study, hepatic IkBα abundance was significantly increased by rbTNFα in primiparous cows. This observation is unexpected, because TNFα is a potent activator of IkBα degradation [29], and suggests the involvement of compensatory anti-inflammatory adaptations in response to rbTNFα.
We also investigated the inflammatory mediator c-Jun, which is a key component of the pro-inflammatory transcription factor activator protein-1. The transcriptional activity of c-Jun is increased by phosphorylation of serine residues in response to various stimuli, including inflammation [31]. As for the NF-kB pathway, we found no evidence of hepatic c-Jun activation in response to rbTNFα. Collectively, rbTNFα treatment did not significantly alter the hepatic protein abundance of inflammatory mediators, but nevertheless greatly increased the plasma concentration of haptoglobin, an acute phase protein induced primarily by inflammatory signals in the liver [32]. It is possible that haptoglobin was primarily induced by transcription factors other than NF-kB or activator protein-1.
In this study, feed intake and milk production were decreased by rbTNFα treatments by 18 and 15%, respectively. TNFα is a key mediator causing anorexigenic responses in various diseases, and many of the effects of TNFα are dependent on its actions in the hypothalamus [33]. Interestingly, our previous research in late lactation cows showed that 2 μg/kg rbTNFα treatment daily for 7 d also decreased feed intake by 18%, but did not significantly alter milk production [11]. Kushibiki et al. [25] reported that daily administration of 2.5 μg/kg rbTNFα for 7 d dramatically decreased feed intake (by ~ 34%) and milk yield (by ~ 15%). As expected, cows were in negative energy balance during the immediate postpartum period, indicating that their energy expenditure, driven largely by lactation requirements, greatly exceeded their energy intake. However, energy balance values were not affected by rbTNFα administration because the magnitude of decreased milk production was comparable to that of decreased feed intake.
Administration of rbTNFα did not alter plasma markers of lipid metabolism or promote fatty liver. As a lipolytic mediator in adipose tissue [34], previous studies found that rbTNFα administration at 2.5 μg/kg significantly increased plasma NEFA concentrations in mid-lactation cows [25] and heifers [35]. We also previously reported that 7-d rbTNFα administration at 2 μg/ kg daily increased liver TG by ~2-fold [11]. It is possible that because plasma NEFA and BHBA concentrations, as well as liver TG content, were already dramatically elevated in response to negative energy balance in the periparturient period, the doses of rbTNFα used in this study were insufficient to promote further alterations in lipid metabolism. On the transcriptional level, our previous work [11] in late-lactation cows showed that 2 μg/kg rbTNFα administration daily for 7 d increased the transcript abundance of AGPAT1 (which catalyzes the esterification of a fatty acyl-CoA to the sn-2 position of the glycerol backbone in TG synthesis), tended to decrease CPT1a (which catalyzes transport of fatty acids into mitochondria for oxidation), and did not affect ApoB (which is a key component of very low-density lipoprotein that mediates hepatic TG exportation). Here, we did not find treatment effects for AGPAT1 or ApoB, and found that rbTNFα increased CPT1a abundance dose-dependently. Collectively, rbTNFα did not promote the pathways favoring hepatic lipid accumulation in early-lactation cows.
Lactating cows rely heavily on hepatic gluconeogenesis to meet glucose requirements because the majority of dietary carbohydrates are fermented in the rumen. Under steady-state conditions, the rate of glucose appearance equals the rate of its disappearance, and the calculated glucose turnover rate approximately equals gluconeogenesis in ruminants, because net portal appearance of glucose is negligible [5]. In this study, there were no treatment effects on plasma glucose or insulin, abundance of key gluconeogenic transcripts, or plasma glucose turnover rate, indicating that low-grade inflammation did not affect hepatic gluconeogensis in early-lactation cows. Previous data regarding TNFα effects on gluconeogensis have been inconsistent. Short-term recombinant human TNFα administration at 10 μg/kg, but not 3.5 μg/kg, significantly increased glucose production (likely from glycogenolysis) and metabolic clearance rate in dogs; coupled with decreased fatty acid flux, the authors concluded that TNFα given in a high dose causes a shift toward carbohydrate as an energy substrate [36]. In a subsequent study, Sakurai et al. [37] infused 2.5 μg/kg TNFα in dogs for 2 h and did not observe a change in glucose production.
The primary substrate for gluconeogenesis in ruminants is propionate, a short-chain fatty acid derived from ruminal fermentation; as a result, liver glucose production in cows is often a function of energy intake [38]. To assess whether gluconeogenesis was affected by substrate supply, we expressed glucose production relative to feed intake. Interestingly, this analysis revealed that the 3 μg/kg rbTNFα treatment increased the apparent efficiency of gluconeogenesis from dietary substrates, primarily because of the low feed intake for that treatment. Given that propionate is used for glucose production at.90% efficiency in ruminants [39], increased metabolic efficiency was not likely the reason for this response. When requirements are greater than nutrient intake, such as in early lactation, the contributions of lactate, glycerol, and amino acids from body tissues to gluconeogenesis increase markedly [40]. Glycerol is released primarily from adipose TG mobilization, which was likely unaffected by treatments (based on unaltered plasma NEFA). In an attempt to evaluate whether 3 μg/kg rbTNFα-treated cows had greater amino acid supply from protein mobilization, we measured concentrations of plasma 3-methylhistidine, a marker of muscle protein breakdown that has been shown to increase rapidly during the periparturient period and peak at 1 week after parturition [41]. Treatment effects on plasma 3-methylhistidine were not significant; however, the 3 μg/kg rbTNFα treatment mean was numerically 20% greater than the other treatments. It seems likely that a combination of slightly enhanced muscle proteolysis and decreased amino acid use for milk protein synthesis resulted in greater supply of amino acids for gluconeogenic substrate in the 3 μg/kg rbTNFα treatment.
Despite the lack of dramatic alterations in metabolism, the higher dose of rbTNFα tended to impair the health of postpartum cows. Health disorders affect considerable numbers of periparturient dairy cows, compromising animal welfare, milk production, and fertility. Ketosis is considered the most important metabolic disease in the U.S. dairy industry [3], and ketotic cows are also at increased risk for other disorders, such as displaced abomasum and metritis [42]. Ketosis may increase the risk of infectious disorders through negative effects of ketone bodies on immune cell function [43]. In this study, rbTNFα increased the incidence of ketosis by 3-fold in the first week of lactation, accounting for much of the increase in total disease incidence. There are numerous mechanisms by which rbTNFα may have promoted subclinical ketosis, but poor feed intake in early lactation is a key risk factor for ketosis [1], and it is likely that the suppression of intake by rbTNFα played a role in this study. Decreased feed intake did not decrease energy balance or increase lipolysis in this study, but low intake affects more than just energy status; decreased protein, mineral, vitamin, or lipid intake may have adversely affected health.
Conclusions
In conclusion, rbTNFα treatment during the first 7 d of lactation decreased feed intake, reduced milk production, and tended to impair health status, but did not significantly alter glucose or lipid metabolism. These data indicate that in response to low-grade inflammation, early-lactation cows compensate for the reduced intake by suppressing milk production rather than further compromising their energy balance or systemic metabolism. This coordinated physiological response to inflammatory mediators can be considered a biological tradeoff between lactational performance and survival [44]. However, because effects on feed intake and milk yield occurred simultaneously, it is unclear whether one or the other was a secondary response. Further studies are needed to investigate if inflammation directly alters mammary or neurological function. Nevertheless, this study indicates that preventing excessive inflammation in early lactation has the potential to improve productivity and health of dairy cows.
Acknowledgments
We thank Cheryl Armendariz, Brande Iseman, Hunter Sbisa, Sara Stoakes, Marilyn Diemer, Isabelle Withrock, Sydney Danner, and Michael Scheffel at Kansas State University for animal care and technical assistance. This is contribution number 13-379-J from the Kansas Agricultural Experiment Station.
Author Contributions
Conceived and designed the experiments: BJB. Performed the experiments: KY JKF LKM LMS. Analyzed the data: KY JKF BJB. Wrote the paper: KY JKF BJB.
This article was originally published in PLoS ONE 8(11): e80316. doi:10.1371/journal.pone.0080316. This is an Open Access article distributed under the terms of the Creative Commons Attribution License. References
1. Grummer RR (1995) Impact of changes in organic nutrient metabolism on feeding the transition dairy cow. J Anim Sci 73: 2820–2833.
2. Grummer RR (2008) Nutritional and management strategies for the prevention of fatty liver in dairy cattle. Vet J 176: 10–20.
3. Oetzel GR (2007) Herd-level ketosis: diagnosis and risk factors. In: Am Assoc Bov Pract Proc. Vancouver, BC, , Canada. pp. 67–91.
4. Bobe G, Young JW, Beitz DC (2004) Invited review: pathology, etiology, prevention, and treatment of fatty liver in dairy cows. J Dairy Sci 87: 3105–3124.
5. Young JW (1977) Gluconeogenesis in cattle: significance and methodology. J Dairy Sci 60: 1–15.
6. Gregor MF, Hotamisligil GS (2011) Inflammatory mechanisms in obesity. Annu Rev Immunol 29: 415–445.
7. Hotamisligil GS, Arner P, Caro JF, Atkinson RL, Spiegelman BM (1995) Increased adipose tissue expression of tumor necrosis factor-a in human obesity and insulin resistance. J Clin Invest 95: 2409–2415.
8. Ametaj BN, Bradford BJ, Bobe G, Nafikov RA, Lu Y, et al. (2005) Strong relationships between mediators of the acute phase response and fatty liver in dairy cows. Can J Anim Sci 85: 165–175.
9. Schoenberg KM, Perfield KL, Farney JK, Bradford BJ, Boisclair YR, et al. (2011) Effects of prepartum 2,4-thiazolidinedione on insulin sensitivity, plasma concentrations of tumor necrosis factor-a and leptin, and adipose tissue gene expression. J Dairy Sci 94: 5523–5532.
10. Ohtsuka H, Koiwa M, Hatsugaya A, Kudo K, Hoshi F, et al. (2001) Relationship between serum TNF activity and insulin resistance in dairy cows affected with naturally occurring fatty liver. J Vet Med Sci 63: 1021–1025.
11. Bradford BJ, Mamedova LK, Minton JE, Drouillard JS, Johnson BJ (2009) Daily injection of tumor necrosis factor-a increases hepatic triglycerides and alters transcript abundance of metabolic genes in lactating dairy cattle. J Nutr 139: 1451–1456.
12. NRC (2001) Nutrient Requirements of Dairy Cattle. 7th rev. ed.Washington, DC. Natl. Acad. Press.
13. Shook GE (1993) Genetic improvement of mastitis through selection on somatic cell count. Vet Clin North Am Food Anim Pract 9: 563–581.
14. Kelton DF, Lissemore KD, Martin RE (1998) Recommendations for recording and calculating the incidence of selected clinical diseases of dairy cattle. J Dairy Sci 81: 2502–2509.
15. Farney JK, Mamedova LK, Godsey BH, Bradford BJ (2011) Technical note: validation of an ELISA for measurement of tumor necrosis factor alpha in bovine plasma. J Dairy Sci 94: 3504–3509.
16. Farney JK, Mamedova LK, Coetzee JF, KuKanich B, Sordillo LM, et al. (2013) Anti-inflammatory salicylate treatment alters the metabolic adaptations to lactation in dairy cattle. Am J Physiol Regul Integr Comp Physiol 305: R110– 117.
17. Schulze E, Fuhrmann H, Neitzel ES, Giese WW, Sallmann HP (1991) Glucose entry rate in dairy cattle as determined by stable isotope 13C-labelled glucose at different stages of reproduction. Comp Biochem Physiol B 100: 167–171.
18. Tserng KY, Kalhan SC (1983) Estimation of glucose carbon recycling and glucose turnover with [U-13C] glucose. Am J Physiol Endocrinol Metab 245: E476–482.
19. Morey SD, Mamedova LK, Anderson DE, Armendariz CK, Titgemeyer EC, et al. (2011) Effects of encapsulated niacin on metabolism and production of periparturient dairy cows. J Dairy Sci 94: 5090–5104.
20. Starke A, Haudum A, Busche R, Beyerbach M, Da¨nicke S, et al. (2010) Technical note: Analysis of total lipid and triacylglycerol content in small liver biopsy samples in cattle. J Anim Sci 88: 2741–2750.
21. Bradford MM (1976) A rapid and sensitive method for the quantitation of microgram quantities of protein utilizing the principle of protein-dye binding. Anal Biochem 72: 248–254.
22. Fronk TJ, Schultz LH, Hardie AR (1980) Effect of dry period overconditioning on subsequent metabolic disorders and performance of dairy cows. J Dairy Sci 63: 1080–1090.
23. Mamedova LK, Robbins K, Johnson BJ, Bradford BJ (2010) Tissue expression of angiopoietin-like protein 4 in cattle. J Anim Sci 88: 124–130.
24. Hachenberg S, Weinkauf C, Hiss S, Sauerwein H (2007) Evaluation of classification modes potentially suitable to identify metabolic stress in healthy dairy cows during the peripartal period. J Anim Sci 85: 1923–1932.
25. Kushibiki S, Hodate K, Shingu H, Obara Y, Touno E, et al. (2003) Metabolic and lactational responses during recombinant bovine tumor necrosis factoralpha treatment in lactating cows. J Dairy Sci 86: 819–827.
26. Neuschwander-Tetri BA (2010) Hepatic lipotoxicity and the pathogenesis of nonalcoholic steatohepatitis: the central role of nontriglyceride fatty acid metabolites. Hepatology 52: 774–788.
27. Sordillo LM, Contreras GA, Aitken SL (2009) Metabolic factors affecting the inflammatory response of periparturient dairy cows. Anim Health Res Rev 10: 53–63.
28. Bionaz M, Trevisi E, Calamari L, Librandi F, Ferrari A, et al. (2007) Plasma paraoxonase, health, inflammatory conditions, and liver function in transition dairy cows. J Dairy Sci 90: 1740–1750. 29. Karin M, Ben-Neriah Y (2000) Phosphorylation meets ubiquitination: the control of NF-kB activity. Annu Rev Immunol 18: 621–663.
30. Ha¨cker H, Karin M (2006) Regulation and function of IKK and IKK-related kinases. Sci STKE 357: re13.
31. Lee SA, Dritschilo A, Jung M (2001) Role of ATM in oxidative stress-mediated c-Jun phosphorylation in response to ionizing radiation and CdCl2. J Biol Chem 276: 11783–11790.
32. Nakagawa-Tosa NN, Morimatsu MM, Kawasaki MM, Nakatsuji HH, Syuto BB, et al. (1995) Stimulation of haptoglobin synthesis by interleukin-6 and tumor necrosis factor, but not by interleukin-1, in bovine primary cultured hepatocytes. J Vet Med Sci 57: 219–223.
33. Romanatto T, Cesquini M, Amaral ME, Roman EA, Moraes JC, et al. (2007) TNF-a acts in the hypothalamus inhibiting food intake and increasing the respiratory quotient--effects on leptin and insulin signaling pathways. Peptides 28: 1050–1058.
34. Zhang HH, Halbleib M, Ahmad F, Manganiello VC, Greenberg AS (2002) Tumor necrosis factor-alpha stimulates lipolysis in differentiated human adipocytes through activation of extracellular signal-related kinase and elevation of intracellular cAMP. Diabetes 51: 2929–2935.
35. Kushibiki S, Hodate K, Ueda Y, Shingu H, Mori Y, et al. (2000) Administration of recombinant bovine tumor necrosis factor-alpha affects intermediary metabolism and insulin and growth hormone secretion in dairy heifers. J Anim Sci 78: 2164–2171.
36. Sakurai Y, Zhang XU, Wolfe RR (1993) Short-term effects of tumor necrosis factor on energy and substrate metabolism in dogs. J Clin Invest 91: 2437–2445.
37. Sakurai Y, Zhang XJ, Wolfe RR (1996) TNF directly stimulates glucose uptake and leucine oxidation and inhibits FFA flux in conscious dogs. Am J Physiol 270: E864–872.
38. Reynolds CK, Aikman PC, Lupoli B, Humphries DJ, Beever DE (2003) Splanchnic metabolism of dairy cows during the transition from late gestation through early lactation. J Dairy Sci 86: 1201–1217.
39. Steinhour WD, Bauman DE (1988) Propionate metabolism: a new interpretation. In: Dobson A, Dobson MJ, editors. Aspects of digestive physiology in ruminants. Ithaca, N.Y.: Comstock Pub. Associates. pp. 238–256.
40. Bell AW (1995) Regulation of organic nutrient metabolism during transition from late pregnancy to early lactation. J Anim Sci 73: 2804–2819.
41. Blum JW, Reding T, Jans F, Wanner M, Zemp M, et al. (1985) Variations of 3- methylhistidine in blood of dairy cows. J Dairy Sci 68: 2580–2587.
42. Duffield TF, Lissemore KD, McBride BW, Leslie KE (2009) Impact of hyperketonemia in early lactation dairy cows on health and production. J Dairy Sci 92: 571–580.
43. Grinberg N, Elazar S, Rosenshine I, Shpigel NY (2008) b-Hydroxybutyrate abrogates formation of bovine neutrophil extracellular traps and bactericidal activity against mammary pathogenic Escherichia coli. Infect Immun 76: 2802– 2807.
44. Ballou MA (2012) Inflammation: role in the etiology and pathophysiology of clinical mastitis in dairy cows. J Anim Sci 90: 1466–1478.







.jpg&w=3840&q=75)