Dairy nutrition models
Dairy nutrition models: their forms and applications
For some years it has been evident that dairy cow nutrition models are vital to the continued success of the dairy industry. This is especially true as we recognize the importance, for example, of ruminal microbes and metabolism in body tissues to nutrient requirements. In addition, our production emphasis has shifted from only milk volume and fat to include milk protein percentage and yield. Mathematical models of nutrition have been in use for over three decades and have stimulated improvement in feeding cattle. However, more complete data sets available in recent years combined with more precise mathematical approaches have now allowed us to improve models of nutrient use tremendously. Such models will be used more frequently in the future for support of decisions not only on the nutrition of cattle, but for other aspects including farm economics and environmental impact.
Dairy nutrition models: forms and roles
Nutritional models vary in complexity according to objectives. A typical scheme of model levels needed to represent a system is found in Table 1. Information about a system must be at least one level below the system explored with the model. Thus, models describing herds operate at the animal level or below, those describing animals require details at the organ level and lower and so on.
In practice, models only need details that have significant bearing on consequences of changes arising from inputs to the system (Production Model) or as much detail as is necessary to explore the system in new and different ways (Scientific Model). Salient properties of production and scientific models are presented in Table 2.
Table 1. Model levels1.
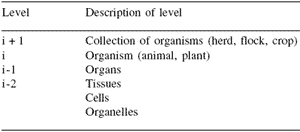
1Adapted From France and Thornley (1984).
SCIENTIFIC MODELS
Scientific models are usually developed upward from basic experimental data pertaining to metabolic processes. Scientific models assume that a living system can be described in terms of a set of ‘critical’ metabolic transactions encapsulated in organs. The goal is to translate in vitro experimental data into chemical reactions representing the essential metabolic processes. Differential equations of the mass balance and Michaelis Menten forms are used to describe substrate level changes as the system equilibrates to a (new) steady state because of nutritional and digestive inputs. Implicit to these models are two basic assumptions: firstly, that in vivo metabolic pathways can be represented using the critical transactions modeled from in vitro experimental data, and secondly, that cellular level metabolic processes can be aggregated to the organ level to effectively model whole animal function. Baldwin, at the University of California, and his colleagues (Baldwin et al., 1987a,b,c) have produced a comprehensive integrated model that describes digestion and metabolism of the dairy cow with dynamic, mechanistic equations of physiological processes.
Table 2. Properties of production and scientific models1.

To enlarge the image, click here
1Adapted from Boston et al. (2003)
PRODUCTION MODELS
Production models are primarily used to portray animal responses to different inputs. They are usually created from collections of response surface models that are developed from animal or herd level experiments. Thus, these models are developed downward. They are valid within the domain of data underpinning the individual response surfaces and are as accurate as the response models themselves.
A theme for the development, refinement and deployment of empirical production models is seen in the development and implementation of the National Research Council dairy cow models (NRC, 1978; 1989; 2001). In 1978, response equations were used to predict crude protein and energy needs of the dairy cow. The 1989 model used a system of protein utilization that partitioned dietary protein into rumen degradable (DIP) and rumen undegradable (UIP) fractions (NRC, 1985). Growth of microorganisms in the rumen was driven by energy intake (TDN, NEL). In 2001, the National Research Council released a new dairy cow model that contains some of the mechanistic approaches in the CNCPS/CPMDairy that are described below.
Other empirical production models include the VEM-DVE/OEB (Dutch; Tamminga et al., 1994), AFRC (British; AFRC, 1990; 1992), CSIRO (Australian; CSIRO, 1990) and INRA (French; INRA, 1989) systems. These early production models stimulated more precise thinking and experimentation. Better data were incorporated into newer versions of models. Largely because of concepts in these increasingly precise models, rations for dairy cows usually now contain feed ingredients that are resistant to ruminal degradation. This increases overall efficiency of dairy cow feeding.
The need for more accurate models to define rumen bacterial and whole animal requirements, to assess feed utilization and to predict production responses led to the development of the Cornell Net Carbohydrate and Protein System (Fox et al., 1992; O’Connor et al., 1993; Russell et al., 1992; Sniffen et al., 1992). The CNCPS is a mix of empirical and mechanistic approaches that describe feed intake, ruminal fermentation of protein and carbohydrate, intestinal digestion and absorption, excretion, heat production, and utilization of nutrients for maintenance, growth, lactation and pregnancy. When the CNCPS was evaluated with data from individual dairy cows where the appropriate inputs were measured and changes in energy reserves were accounted for, 90% of the variation in actual milk production of individual cows was explained with a 1.3% bias. The model accounted for 76% of the variation in individual cow milk production with an 8% underprediction bias when energy was first limiting and 84% of the variation with a 1.1% overprediction bias when protein was first limiting (Fox et al., 2004).
Dairy nutrition software
Dairy nutrition models often do not contain tools for computer assisted ration formulation. Software included with the 1989 and 2001 NRC dairy nutrition models allowed calculation of nutrient requirements and evaluation of rations but did not provide for formulation of rations.
AUTO-BALANCING
The usual objective of auto-balancing is to produce an ‘optimal ration’ at the lowest cost. Constraints (minimum and maximum amounts) are set for both nutrients and feed ingredients. Nutritional constraints describe the requirements of cows to perform specific or multiple functions (maintenance, growth, lactation, pregnancy). Nutritional constraints include dry matter intake, energy (metabolizable and net), protein (crude, soluble, bypass and metabolizable), carbohydrates (fiber and non-fiber), fat, minerals; and in the case of newer models like the CNCPS/ CPM-DAIRY, amino acids and rumen available nitrogen (peptides and ammonia) are included. Feed ingredients are selected on the basis of the major nutrients that they provide (i.e. fiber from forages, non-fiber carbohydrates from grains, protein from oilseed meals). Feed constraints are set based on the availability of purchased ingredients and inventory of ingredients on the farm or contracted for purchase.
The amount of an ingredient specified is often adjusted by the formulator to take into account a minimum amount that the formulator feels rations should contain or the maximum amount that the formulator feels can be tolerated by the animal. The amount of a feed ingredient should not be limited by high cost because optimization programs will control the inclusion of expensive feeds. Thus, the autobalancing (optimization) task is to find the least cost combination of feed ingredients within their minimum and maximum constraints that provide nutrients that are within the specified minimum and maximum ranges. When the foregoing is achieved, the auto-balancing process has provided a solution to the specifications defined by the formulator.
Ration formulators often are discouraged when the optimization process does not give a solution as defined above. This simply means that a combination of feed ingredients in amounts within the minimum and maximum ranges cannot provide nutrients within the specified ranges. To find a solution, the formulator should either expand (relax) the feed ingredient and nutrient constraints or include additional ingredients that are good sources of limiting nutrients. Older optimization methods simply indicated that there was ‘no feasible solution’. This provided no direction to obtaining a solution. Newer optimization methods provide direction by listing nutrient constraints that are not met.
In both empirical models and in the CNCPS/CPMDAIRY, nutrients like crude protein, fat, carbohydrates (fiber and non-fiber) and minerals are constant proportions of the ingredient regardless of the amount of feed consumed. Thus, supply of these nutrients is a linear function of intake. In empirical dairy cow models, metabolizable protein and energy (metabolizable and net) values also are not affected by intake and thus are constant. Thus linear programming can be used for auto-balancing. The CNCPS/CPM-DAIRY has a dynamic rumen submodel wherein the passage rate of feeds (determined mainly by feed intake but also adjusted by ration forage content and particle size) determines the outflow of nutrients from the rumen system. Thus, nutrients like metabolizable protein, metabolizable energy, amino acid content of metabolizable protein, and rumen available protein (peptides and ammonia) are not constant but vary according to feed consumption and ration ingredients. These features of the dynamic digestion models mean that the problem of dairy cow ration optimization is no longer the province of linear programming and nonlinear programming packages are required. Implementing constrained, nonlinear optimization is not without problems. If the nutrition model contains discontinuous (break-point) functions, continuous mathematical models must be developed to describe the discontinuous functions (Boston et al., 2000).
Whereas a linear programming problem can be solved from any starting point, a nonlinear programming problem requires a ‘good’ feasible starting point to ‘effectively’ start the solution process. Finally, a linear programming optimization problem has just one solution. This is not so for nonlinear optimization.
Ration formulation was one of the first applications of linear programming. Not only could solutions be found in seconds, but building on contributions of Dantzig (1995) to operational research, we also were able to derive an array of other very helpful economic properties (shadow prices) relating to our optimal solution. For example, we could discover the cost ranges over which feeds within the optimal ration remained there, as well as which amongst the feeds not selected in the optimal ration were candidates for inclusion if cost decreased.
Bath and Bennett (1980) at The University of California were amongst the earliest to employ linear programming to formulate rations for maximum income over feed costs. Galligan and coworkers (1986) at the University of Pennsylvania programmed the 1978 NRC dairy nutrition model into Lotus 1-2- 3 with auto-balancing of rations provided by Einfin.
Spartan represented an excellent effort in software development by the group at Michigan State University that was based on NRC models and included auto-balancing (Vandehar et al., 1992).
CPM-Dairy is a combined effort by researchers at Cornell University, the University of Pennsylvania and the W.H. Miner Agricultural Research Institute (Boston et al., 2000). CPM-Dairy contains the CNCPS and is a field efficient program for use with growing, lactating and dry cows. The optimization scheme was developed by the Systems Programming Group at the University of Maryland (Zhou and Tits, 1997) and employs a forward sequential quadratic programming approach. Version 1, released in 1998, also contained a modification of NRC (1989).
Versions 2 and 3 only contain the CNCPS and are in beta testing with release anticipated in 2004. Version 3 has expanded carbohydrate fractions, a lipid submodel (Moate et al., 2004) and incorporates NRC (2001) mineral requirements.
COMMERCIALLY AVAILABLE SOFTWARE
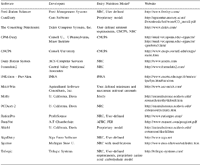
Table 3 contains a list of commercially available software for formulation of dairy cattle rations. NRC, INRA and CNCPS dairy nutrition models are used in some of the software packages whereas proprietary or user-defined models are used in others. Linear programming is used for auto-balancing in empirical models. In CNCPS, biological values for metabolizable energy, metabolizable protein, passage rate, bacterial yield efficiencies and degradation rate of available fiber, which depend upon feed intake and the ingredients selected, are first estimated and then rations are balanced using linear programming. In CPM-Dairy, a nonlinear optimizer is used to autobalance rations according to the CNCPS (Zhou and Titts, 1997).
Table 3. Some commercially available dairy nutrition software.
To enlarge the image, click here
N.RC, National Research Council; CNCPS; Cornell Net Carbohydrate and Protein System; INRA, Institut National de la Recherche Agronomique, MOLLY, a dynamic, mechanistic computer model of a dairy cow; AFRC, Agricultural and Food Research Council; PDI (INRA), Proteines varies reellenment digestibles dans l’Intestin grele.
Application of dairy nutrition models CPM-Dairy is used by veterinarians, nutrition consultants and the feed industry to evaluate and formulate rations for dairy cattle.
At New Bolton Center, our Field Investigation Unit was presented with a case where milk production in a 200-cow dairy was only 30 kg/d although cows were milked three times daily and were treated with bST. Early lactation cows frequently went off feed and had diarrhea. Feces contained undigested corn, believed to be high moisture corn.
There were two high production groups (heifers and high cows) and a low production group. The heifers and high production cows were housed in a new free-stall barn with excellent ventilation and cow comfort. Cows were fed three times daily with frequent ‘push-up’ of feed. Feed bunk space was 1.7 feet per cow with no headlocks, and cows had good water access. Remaining milking cows were housed in a renovated free-stall barn. They were fed twice daily with frequent ‘push-up’ of feed. Feed bunk space and ventilation were good. Non-lactating cows were housed on a bedded pack.
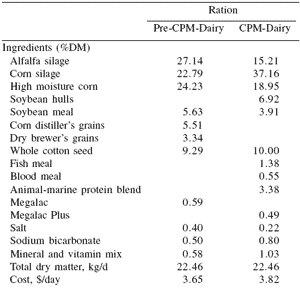
CPM-Dairy was used to evaluate the existing rations and to formulate new rations. In Table 4 are details of pre-CPM-Dairy and CPM-Dairy rations for the high producing animals (heifers and high cows).
The pre-CPM-Dairy ration was formulated for a target of 39 kg/d milk with 3.6% fat and 3.1% crude protein. According to CPM-Dairy, this ration was low in metabolizable protein and would only support 34.4 kg/d milk. Poor amino acid ratios (Met/ MP=1.89; Lys/MP=6.24) could reduce milk production by 1.6 kg/d so that expected milk on the basis of metabolizable protein and balance of amino acids was only 32.8 kg/d. The ration was marginal in eNDF (21% vs the guideline of 23% of ration DM) and contained 41.5% non-fiber carbohydrate (NFC). High moisture corn, which has an initial high rate of fermentation in the rumen, contributed a substantial amount of NFC.
Table 4. Field application of CPM-Dairy.
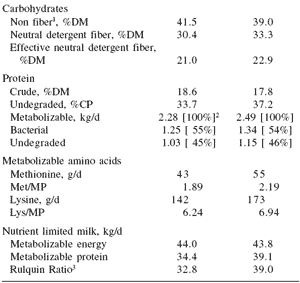
1. Includes sugars, starch, pectin, B-glucans and acids produced during silage fermentation. Silage acids are not fermented further in the rumen and do not provide energy for bacterial growth.
2. Values in brackets are percentages of metabolizable protein
3. Responses to amino acid ratios calculated according to equations in Rulquin and Verite (1993) and added to metabolizable protein-limited milk.
Objectives in formulating the new ration were to 1) provide less NFC without compromising total carbohydrate fermentability, 2) increase eNDF, 3) correct the deficiency of metabolizable protein, and (4) improve amino acid balance.
Reducing amounts of high moisture corn (19 vs 24% DM) and alfalfa silage (15 vs 27% DM), increasing the amount of corn silage (37 vs 23% DM) and including soybean hulls (7 vs 0% DM) reduced NFC (39.0 vs 41.5%). Although NFC was lower, total fermentable carbohydrates were higher (45 vs 43% ration DM) because of the high ruminal fermentation of NDF in soybean hulls and corn silage. Increasing ration forage (52 vs 50% DM) and including soybean hulls increased NDF (33.3 vs 30.4%) and eNDF (22.9 vs 21.0%).
Replacing a portion of the soybean meal and all of the corn distiller’s grains and dried brewer’s grains with animal and marine proteins increased the supply of metabolizable protein from rumen undegraded protein by 0.12 kg (1.15 vs 1.03 kg/d). Metabolizable protein from ruminal bacteria was increased (1.34 vs 1.25 kg/d) for two reasons. First, bacterial growth is driven mainly by energy derived from fermentation of carbohydrates. As noted above, the CPM-Dairy ration contained more rumen fermentable carbohydrates (45 vs 43 % DM, 10.05 vs 9.76 kg/d) than the pre-CPM-Dairy ration. Second, bacterial growth is decreased when rumen pH decreases. The CPM-Dairy ration contained more eNDF than the pre-CPM-Dairy ration. This stimulates cud chewing, increases salivary flow and improves ruminal buffering. More metabolizable protein from rumen escape protein and from bacterial protein alleviated the deficiency of metabolizable protein so that milk yield based on metabolizable protein provided by the CPM-dairy ration was 39.1 kg/d compared to 34.4 kg/d for the pre CPM-dairy ration.
Animal and marine proteins and ruminal bacteria are excellent sources of lysine. Thus, the combination of ruminal escape and bacterial protein improved Lys/ MP (6.94 vs 6.24). Fish meal, but not blood meal nor rumen bacteria are good sources of methionine.
Met/MP (2.19 vs 1.89) was improved by using Megalac Plus (Alimet in calcium salts of LCFA) to supplement methionine in rumen escape and bacterial protein. Amino acid balance of the CPM-Dairy ration would only reduce milk 0.1 kg/d compared to 1.6 kg/d with the pre CPM-Dairy rations. Thus, on the basis of metabolizable protein supply and amino acid balance, expected milk was 39 kg/d or 6.2 kg/d more than on the pre CPM-dairy ration.
After one week on the new high production rations and a similarly formulated low production ration, total herd milk production was 4 kg/d higher. Cud chewing increased and manure consistency improved. Off-feed problems were dramatically reduced. Two weeks after the ration change, manure still contained excessive undigested high moisture corn. Grinding the high moisture corn through a 0.635 cm screen reduced corn in feces and milk production increased another 2 kg/d. Herd milk production now averaged 36 kg/d. For the next 12 months, average milk production for the total herd was 36 to 38 kg/d.
References
Agricultural and Food Research Council. 1990. Technical Committee on Responses to Nutrients, Report no. 5. Nutritive requirements of ruminant animals: energy. Nutrit. Abstr. and Rev. Series B 60:729-804.
Agricultural and Food Research Council. 1992. Technical Committee on Responses to Nutrients, Report no. 5. Nutritive requirements of ruminant animals: protein. Nutrit. Abstr. and Rev. Series B 62:787-835.
Baldwin, R.L., J. France and M. Gill. 1987a. Metabolism of the lactating cow I. Animal elements of a mechanistic model. J. Dairy Res. 54:77-105.
Baldwin, R.L., J.H.M. Thornley and D.E. Beever. 1987b. Metabolism of the lactating cow II. Digestive elements of a mechanist model. J. Dairy Res. 54:107-131.
Baldwin, R.L., J.H.M. Thornley and D.E. Beever. 1987c. Metabolism of the lactating cow III. Properties of mechanistic models suitable for evaluation of energetic relationships and factors involved in the partition of nutrients. J. Dairy Res. 54:133-145.
Bath, D.L. and L.F. Bennett. 1980. Development of a dairy feeding model for maximizing income above feed costs with access by remote computer terminals. J. Dairy Sci. 63:1397-1389.
Boston, R., D. Fox, C. Sniffen, E. Janczewski, R. Munson and W. Chalupa. 2000. The conversion of a scientific model describing dairy cow nutrition and production to an industry tool: The CPM-Dairy project. In: Modeling Nutrition of Farm Animals (J.P. McNamara, J. France and D.E. Beever, eds). CAB International, UK, pp. 361-377.
Boston, R., Z. Dou and W. Chalupa. 2003. Models in nutritional management. In: Encyclopedia of Dairy Sciences (H. Roginski, J. Fuquay and P. Fox, eds). Elsevier Science, pp. 2378-2389.
Commonwealth Scientific and Industrial Research Organization. 1990. Feeding Standards for Australian Livestock. CSIRO Publications, East Melbourne, Australia.
Dantzig, G.B. 1955. A proof of the equivalence of the programming problem and the game problem. In: Activity Analysis of Production and Allocation (T.C. Koopmans, ed). John Wiley, NY, pp. 330- 335.
Fox, D.G., C.J. Sniffen, J.D. O’Conner, J.B. Russell and P.J. Van Soest. 1992. A net carbohydrate and protein system for evaluating cattle diets. III. Cattle requirements and diet adequacy. J. Anim. Sci. 70:3578-3596.
Fox, D.G. L.O. Tedeschi, T.P. Tylutki, J.B. Russell, M.E. Van Amburgh, L.E. Chase, A.N. Pell and T.R. Overton. 2004. The Cornell Net Carbohydrate and Protein System model for evaluating herd nutrition and nutrient excretion. Anim. Feed Sci. Tech. 112:29-78.
France, J. and J.H.M. Thornley. 1984. Mathematical Models in Agriculture. Butterworths. London. Galligan, D.T., J.D. Ferguson, C.F. Ramberg, Jr. and W. Chalupa. 1986. Dairy ration formulation and evaluation program for microcomputers. J. Dairy Sci. 69:1656-1664.
Institut National de la Recherche Agronomique. 1989. Ruminant Nutrition. Recommended allowances and feed tables (J. Jarrige, ed). John Libbey Eurotext, London.
Moate, P.J., W. Chalupa, T.C. Jenkins and R.C. Boston. 2004. A model to describe ruminal metabolism and intestinal absorption of long chain fatty acids. Anim. Feed Sci. Tech. 112:79-105.
National Research Council. 1978. Nutrient Requirements of Dairy Cattle. National Academy Press, Washington, D.C.
National Research Council. 1985. Nitrogen Usage in Ruminants. National Academy Press, Washington, D.C.
National Research Council. 1989. Nutrient Requirements of Dairy Cattle, Update 1989. National Academy Press, Washington, D.C.
National Research Council. 2001. Nutrient Requirements of Dairy Cattle. National Academy Press, Washington, D.C.
O’Connor, J.D., C.J. Sniffen, D.G. Fox and W. Chalupa. 1993. A net carbohydrate and protein system for evaluating cattle diets. IV. Predicting amino acid adequacy J. Anim. Sci. 71:1298-1311.
Rulquin, H and R. Verite. 1993. Amino acid nutrition in dairy cows. In: Recent Advances in Animal Nutrition (P.C. Garnsworthy and D.J.A. Cole, eds.). Nottingham University Press, UK, pp. 55-77.
Russell, J.B, J.D. O’Connor, D.G. Fox, P.J. Van Soest and C.J. Sniffen. 1992. A net carbohydrate and protein system for evaluating cattle diets. I. Ruminal fermentation. J. Anim. Sci. 70:3551-3561.
Sniffen, C.J., J.D. O’Connor, P.J. Van Soest, D.G. Fox and J.B. Russell. 1992. A net carbohydrate and protein system for evaluating cattle diets. II. Carbohydrate and protein availability. J. Anim. Sci. 70:3562-3577.
Tamminga, S., W.M. Van Straalen, A.P.J. Subnel, R.G.M. Meijer, A. Steg, C.J.G. Wever and M.C. Blok. 1994. The Dutch protein evaluation system: the DVE/OEB system. Livestock Prod. Sci. 40:139.
VandeHar, M., H. Bucholtz, R. Beverly, R. Emery, M. Allen, C. Sniffen and R. Black. 1992. Spartan Dairy Ration Evaluator/Balancer. Michigan State Univ., East Lansing.
Zhou, J.L. and A.L. Tits. 1997. User’s Guide for FFSQP Version 3.5. Electrical Engineering Dept. and Institute for Systems Res. Univ. Maryland, College Park.
Authors: WILLIAM CHALUPA, RAY BOSTON and ROBERT MUNSON
School of Veterinary Medicine, University of Pennsylvania, Kennett Square, Pennsylvania, USA






.jpg&w=3840&q=75)