Alfalfa and Atriplex in Sheep diets
Utilization of Alfalfa and Atriplex for Feeding Sheep under Saline Conditions of South Sinai, Egypt
Published: May 7, 2012
By: Afaf M. Fayed (Department of Animal & Poultry Nutrition, Desert Research Center, Cairo, Egypt), Abeer, M. El- Essawy, E.Y. Eid, Hassan Goda Helal, Ahlam, R. Abdou & H. M. El Shaer
Abstract: The objective of this study was to assess the influence of replacing percent of alfalfa by percent of Atriplex as roughage fed to animals. Twenty four adult Barki lambs weighed an average 49± 77 kg and age 3 years were used in six digestibility trials (4 animals each). Experimental diets were made of alfalfa and Atriplex nummularia in different ratios to each other as follow:R1: 75 % alf + 25% At, R2: 50 % alf + 50 % At, R3: 25 % alf + 75 % At, R4: 100 % At, T5: 100 % alf furthermore R6: berseem hay (BH) . All animals were fed barley at 25 % of energy requirements in R1, R2, R3, R4 and R5 while R6 fed concentrate feed mixture (CFM) .
Results obtained indicated that: all experimental diets had comparable values of dry matter (DM). Mixing of plants affecting chemical composition of feed ingredients where highest crud protein (CP) was recorded in R5 and least one was in R4. Crude fiber (CF) values were decreased as follow in R6, R5, R1, R2, R3 and R4, respectively. R6 and R4 had comparable values of condensed tannins while highest saponin levels were recorded in R4. Animals fed on R5 showed highest DM and total digestible nutrients (TDN) intake g/kg BW followed by those fed R1 and R2. Nitrogen intake showed higher values in R5 followed by R1, R2, R3, R6 then R4. Nitrogen retention also was maximum in R5 and minimum in R6. Animals fed At alone showed highest water intake with significant (P< 0.05) differences when compared with other treatments. There is a sampling time effect (zero and 6 hrs post feeding) on serum metabolites, liver enzymes and some minerals. Indeed the prefeeding rumen parameters (NH3 – N) and TVFA,s were increased significantly to reach the peak value at 8 hr post feeding. Some minerals Na, K, Ca and P were analyzed.Na and P intake increased with increasing Atriplex level while Ca and K intake increased with increasing alfalfa level. Finally R2 is nutritious despite the generally low nutritive value and energy content.
Key words: Salt tolerant fodders, digestibility, antinutritional factors, voulantry intake, rumen and blood metabolites, sheep
Introduction
South Sinai is hyper arid region with salt affected natural resources (water, soil, plants, etc). Therefore, feed resources in the region are that represent one of the main obstacles for animal production development in the region. Salt tolerant forage species could play an important role in the region. Atriplex nummularia has great potentialities since it is known to be tolerant to salinity and drought (El Shaer., 2010). In addition to high content of crude protein, fiber and mineral contents.. However, it is deficient in energy and around 65% of nitrogen is non- protein nitrogen (Ben Salem et al, 2005 b). The high salt level in Atriplex limits its intake and digestion by ruminants (Hassan, 2009). Also Atriplex species contain some secondary metabolites as condensed tannins which may restrict feed intake and lead to a negative impact on animal performance (Ben salem., 2005). Alfalfa is the main cultivated legume crops in saline lands due to its high productivity,its high nutritional value and palatability (Anon , 2009 ). Mixing alfalfa with Atriplex as green fodders to sheep may increase the palatability and consequently intake and utilization of Atriplex which lead to improvement of the performance of animal . The objective of the study was to compare the nutritional evaluation of mixtures of alfalfa and Atriplex with different proportions fed to sheep in South Sinai.
Materials and methods
The study was carried out at South Sinai Research Station, Ras Sudr, South Sinai Governorate where the experimental forages diets Atriplex nummularia (At) and Alfalfa (Medicago sativa) (alf) were cultivated in saline soils and irrigated with saline water (total salinity 8500 ppm in ground water)
Animals and feeding management
Twenty four adult Barki lambs, weighing 49 ±1.62 kg and 3 years old, were used in the study where the sheep were equally divided into six treatments (4 animals / treatment) and allocated to one of six dietary treatments. Animals received the experimental diets for 30 days as a preliminary feeding period followed by a 15- day digestibility trial where animals were kept in individual metabolic cages. The first ten days of the digestibility trial were devoted as an adjustment period. The weighed tested forages were offered twice daily, at 8.00 am and 3.00 pm. Measured amounts of drinking fresh water were left free choice for all animals. Barley grains were offered once daily at 12.00 pm as an energy source to all animals in R1, R2, R3, R4 and R5 and CFM to aimals in R6. Feed and refusals were collected, weighed and recorded during the preliminary period. In the following five days (collection period) measurements of 24 hours urine and fecal samples were collected for chemical analysis. At the end of the collection period, blood samples were taken before the morning feeding, then 6 hours post feeding. Rumen liquor were collected by stomach tube before feeding, 4 and 6 hrs post feeding. Live body weight and forage intake were recorded. Alf and (At) grown at the experimental farm were daily harvested, collected separately and chopped into small pieces (2-3 inches) then mixed in different ratios in the following basal rations (R) as follows: R1: 75% alf + 25% At; R2: 50% alf + 50% AT; R3: 25% alf + 75% At; R4: 100% At; R5: 100% alf and R6: Berseem (Trifolium alexandrinum, 4th cut) hay (BH) as a control group. All animals were given feed supplements to cover 25% of TDN maintenance requirements according to Kearl (1982). Barley grains were given to animals in R1, R2, R3, R4, and R5 where animals in the control treatment (R6) were fed concentrate feed mixture (CFM). The CFM consisted of 25% cotton seed cake, 30% yellow corn, 35% wheat bran, 3% rice bran, 3% molasses, 1% urea, 2% limestone and 1% common salt.
Analytical methods
Proximate chemical analysis for all feed ingredients, refusals, fecal samples and urine were determine according to( A.O.A.C., 1997). Neutral detergent fiber (NDF), acid detergent fiber (ADF) and acid detergent lignin (ADL) (Goering and Van Soest, 1970). In addition, Sodium (Na) and potassium (K) were measured using flame model (Jenway PFP7) photometer and calcium (Ca) and phosphorus (P) were determined using Atomic absorption Spectrophotometer model (Unicam 929) in all dietary, fecal and urinary samples.
Anti-nutritional factors (ANF) analysis
Qualitative and quantitative estimation of condensed tannins (CT) and saponins (Sap) as the main ANF in all feed ingredients was carried out by Porter et al. (1986) and Balbaa et al. (1981), respectively.
Rumen and blood analysis:
Rumen liquor was withdrawn by stomach tube just after the end of the collection period before feeding, 4 hr and 8 hrs post feeding. Blood samples were collected before morning feeding and 6 hrs post feeding. The pH of rumen liquor was immediately recorded using Gallen Kamp pH Stick pH K-120 – B. Rumen liquor samples were analysed to determine total volatile fatty acids (TVFA ´s) according to Warner, (1964) and ammonia – nitrogen (NH3) (A. O. A. C. 1997). All serum samples were analyzed for Sodium (Na) and potassium (K) using flame photometer model (Jenway PFP7), calcium (Gitelman, 1967), inorganic phosphorus (Goodwin, 1970), triglycerides (Trinder, 1969), cholesterol (Roeschlau et al., 1974), total protein (Reinhold, 1953), albumin (Rodkey, 1965), urea –N (Berthelot, 1959), creatinine (Seelig and Wust, 1969), alanine amino transferase (ALT) and aspartate amino transferase (AST) (Wilkison et al., 1972). All kits used from Human Co. (Germany) using Jenway spectrophotometers (UK).
Statistical analysis:
Analysis of variance (ANOVA) was used to test the obtained data using the general linear modeling procedure (SAS, 2000). The used design was one way analysis. Duncan ´s multiple tests (1955) were applied for comparison of means .
Results and Discussion
Chemical composition:
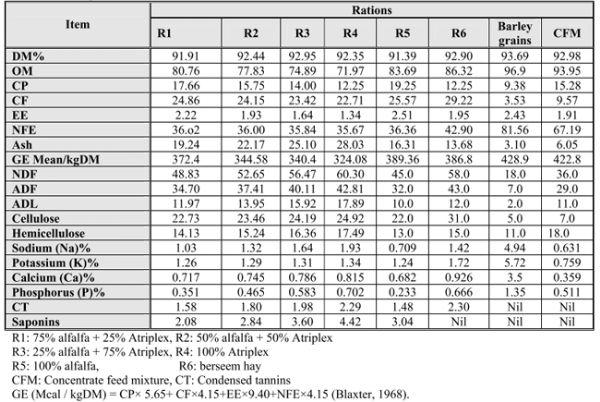
Considerable variations were observed among the chemical composition of the studied forage crops (Table 1). Berseem hay (BH) fed to animals in R6 and Atriplex nummularia (At) had similar CP concentrations (averaged 12.25%) while alfalfa (alf) contained higher CP concentration (19.25%). Similar figures were recorded by El-Shaer et al. (2001) and Ben Salem et al.,(2005). However, the CP of At may lower than those reported by other workers Aganga et al. (2003) that could be attributed to different climatic, environmental, stage of growth factors. At, as a halophyticshrurb, contained lower concentrations of energy (324.087 GE, Mcal / kgDM) and organic matter (81.93%) compared to the other feed materials. Therefore, CP, OM and energy values in the mixture forage treatments were decreased as alfalfa ratio decreased and the increased portions of Atriplex in the forages diets. Such results are in agreement with those found by El –Shaer et al. (1991) and Ben Salem et al. (2005)
The OM was highest in BH followed by alf diet, while it was the lowest in At. On the other hand, NDF, ADF and ADL concentrations were higher in At compared to alf and BH. At attained the highest lignin content followed by R3, R2, R6, R1 then R5 (alf). Fiber fractions in the forage mixtures diets (R1, R2, R3) were increased by increasing the inclusion of At (R4) portion in the diets.
Data in Table (1) showed that Na, K, Ca and P levels were higher than probable dietary requirements (0.09 – 0.18, 0.50 – 0.80, 0.36 – 0.42 and 0.29 – 0.31%, for Na, K, Ca and P, respectively, as described by (NRC, 1985) but still below maximum tolerable levels (4.0, 2.0, 1.5 and 0.6 %, respectively as reported by (NRC, 1980) . The higher levels of minerals Na, K, Ca and P in saltbush offered to sheep could be due to the high content of these minerals in saltbush leaves. Saltbush leaves are more palatable than other plant parts (Gihad and El – Shaer, 1992). P value in alf was similar to those reported by Karabulut et al. (2006) while values of Na, K and Ca were different. These differences may possibly be due to maturity differences in alfalfa used in this experiment.
Phytochemical screening of the experimental feed materials revealed that they contained saponins (sap) and condensed tannins (CT) except the BH. which was free from sap.. Also, barley grains as energy source and concentrate feed mixture (CFM) were free from both (sap) and (CT). Therefore, quantitative determination for such materials was necessary before using such feed materials for feeding sheep.
The levels of ANF´s are varied from plant to plant and from season to season (El-Shaer et al., 2005). At. (R4) and BH. (R6) showed the highest levels of CT followed by R3, R2, R1 then R5, respectively. Thus, the concentrations of CT declined as the proportions of At. decreased in the dietary mixture. The present levels of CT ranged from 1.48 to 2.30 mg/ 100g DM. So, it is safe for animals according to the previous studies. At. (R4) showed the greatest level of sap. followed by R3, R5. R2 then R1
Table (1): Chemical composition and secondary metabolites levels of the feed ingredients(roughages,barley and CFM) on DM% bases.
Feed intake, digestion coefficients and nutritive values:
Results in Table (2) indicated that the highest DMI ( P≤ 0.05) was observed for animals fed alf (R5) followed by those in R1, R2, R3, R4 while the lowest value was recorded for animals fed R6 ( the control group). These findings may be due to the fact that fresh alf. and At. were more palatable compared to berseem hay (BH) in R6. These results were in- agreement with those reported by Shawket and Ahmed (2009).
The present data clearly indicated a significant (P≤ 0.05) effect of the roughage type on DMI. Daily DMI was negatively affected by saltbush. This is attributed to higher salt content and higher levels of fiber especially ADL and NDF in At. Similar results were reported by Ben Salem et al. (2005), Masters et al. (2006), and Hassan (2009). Moreover, due to high ash content, at forage is relatively low in energy. As shown in table (2); the apparent digestibility of OM, CF, NFE, ADF and ADL were higher with fresh alf than other groups containing At with no significant difference. However the control group R6 has the lowest (p≤0.05) CP digestibility. Similar trend was observed by Abdel – Malik et al. (2001) who found that CP digestibility of berseem was lower than that of alf. Introducing of At. instead of alf in other treatments slightly decreased the digestibility coefficients of CP, CF, NFE, cellulose with no significant differences. Similarly, Al Owaimer et al. (2008) concluded the same result. These results may be due to higher salt content of Atriplex which is the major negative component in Atriplex species (Wilson, 1992) thus leading to increment of animal water intake and shortening the rumen turnover time with consequential influences on rumen physiology and metabolism (Warner and Casson, 1992 and Konig, 1993).
Table (2): Average daily feed intake, digestion coefficients and nutritive values of animals fed the experimental diets
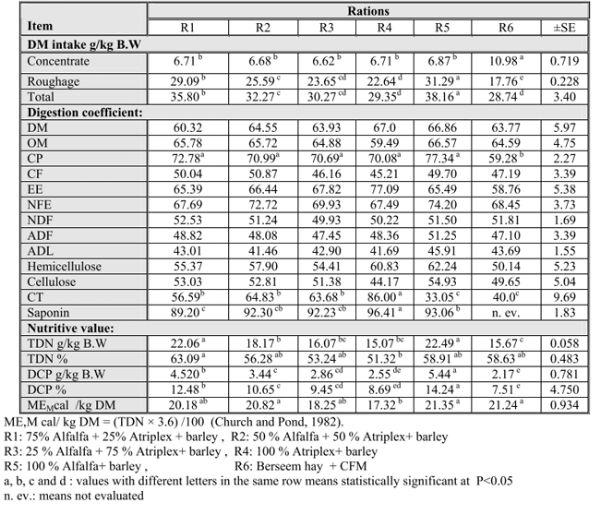
Such results might be also attributed to the secondary metabolites in At which include oxalates, tannins and saponins which might decrease the production of volatile fatty acids in the rumen. The same results were reported by Shawket and Ahmed (2009) and Abu – Zanat and Tabbaa (2005). Inclusion of Atriplex in diet up to 50% insignificantly increased OM, CP, CF, NFE, NDF and cellulose than At alone. Getachew et al. (2008) found that digestibility of NDF and nitrogen was reduced by all levels of tannic acid compared with control.
Furthermore, Positive digestibilities of the CT were reported in the present study and the variations among groups were significant (P≤ 0.05). The highest digestibility of CT was in R4 followed by those fed R2, R3, R1, R6 then R5 (alf), respectively.
It is clear that R4 contained the highest concentration of CT as mentioned before in table (1). This finding could be explained by DM intake. In general, as DM intake increased, apparent digestibility decreased in sheep which could be due to higher rumen turnover rates observed in both sheep and cattle (Mulligan et al., 2001). Also, the same finding was reported in case of saponins.
R4 fed animals showed the highest saponin digestibility followed by R5, R3 and R2 showed a comparable value of digestibility then R1 was the lowest one. Saponin was absent from R6 (BH) so, it is not evaluated in BH fed animals.
When the nutritive values expressed as TDN and DCP a significant difference (P≤ 0.05) was observed for TDN g/kg BW values. Alfalfa diets showed the highest values & R4 showed the lowest one . Moreover, TDN% of intake was significantly (P≤ 0.05) increased in R1 followed by R5, R6, R2, R3 and R4, respectively. The elevation of TDN in alf. may be due to the highest digestibility of OM, CP, CF and NFE than those of At. Al- Owaimer et al. (2008) consistent with our results where they noticed that lambs fed alf hay had higher TDN than those fed At Ahmed et al. (2001) showed that the value of TDN for ration containing At was lower by 7.15% than that containing BH. Shawket, (1999) reported that the nutritive value expressed as TDN was 55.7 and 67.8%, respectively for diets containing At alone and with energy supplement.
Digestible crude protein (DCP) g/kg BW value increased (P≤ 0.05) significantly on (R5) followed by R1, R2, R3, R4 then R6. Similar observations were reported by Abdel – Malik et al. (2001). Results obtained may be attributed to higher CP content of alf and its rapid fermentation followed by At and BH. The percentage of DCP of intake had the same trend.
ME, Mcal / Kg DM varied significantly (P≤ 0.05) among treatments. Results indicated that the values of ME Mcal / Kg DM were decreased (P≤ 0.05) with 100% and 75% At. than other treatments. However 50% At + 50% alf expressed comparable values with those of 75% alf +25% At.
This finding may be due to lower energy content of At than alf and BH. Shawket, (1999) concluded similar results, she found that the utilization of At was enhanced with the energy supplementation. Ben Salem et al. (2005) found that animal performance was improved by feeding At supplemented with barley than those fed At alone.
Nitrogen balance:
As shown in Table (3); Total nitrogen intake (NI) expressed as gm / head / day for animals fed R5 was the highest (p≤0.05) followed by R1 and the lowest one was R4. These differences may be due to the type of forage and its content of nitrogen and also these findings were matched with the CP intake in the experiment. These results are in agreement with those of Shawket et al., (2005) and Al – Owaimer et al., (2008). Results showed that the main pathway of N excretion was through urine for all tested roughages except BH group.
Table (3): Nitrogen balance ( gm / head / day) of animals fed the experimental diets
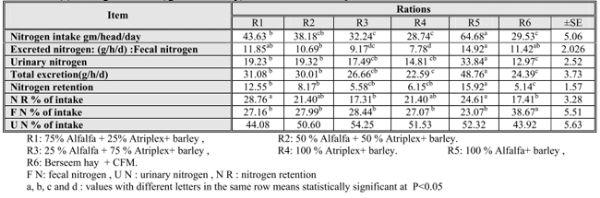
These findings may be attributed to the rapid hydrolysis of alf and At CP in the rumen which led to accumulation of ammonia (Weston et al., 1970) which is inefficiently increase urinary nitrogen excretion. Values of total nitrogen excretion clearly indicated that animals fed on 100% alf lost higher (p≤0.05) values of nitrogen followed by R1 and R2 and the lowest one was R4.
Nitrogen retention (NR) was higher in animals fed R5 and the lowest value was in R6. However R3 and R4 had comparable values of NR which have higher percent of At. This may be due to higher CP content and its higher digestibility in alf than At and BH. Data of NR% of intake showed that R1 indicated the highest (p≤0.05) nitrogen utilization while R6 was the lowest one.
Water balance:
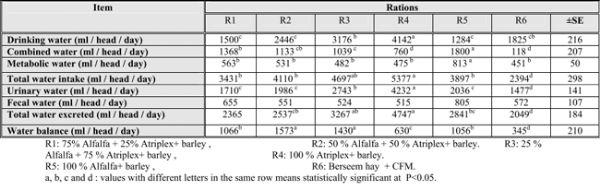
As shown in Table (4); the highest water intake was observed in animals of R4 and R3 and this attributed to At. with high salt content. The lowest amount of water intake was recorded in sheep fed control diet with significant (p≤0.05) differences among the experimental groups.These results are inharmony with those reported by Bhatti et al. (2009), Hassan (2009), Shawket &Ahmed (2009) and Shawket et al. (2005) who reported that the salt content of At. can influence the animal water requirements because additional water is required to excrete their high salt content.
As expected urinary water was higher in R4 followed by R3 (P≤ 0.05), respectively and R6 was the lowest one. These findings are in agreement with El Aich (1987), Eid (2003) and Allam et al. (2006) who indicated that the high content of ash in halophytes lead to push animals to increase excretion of urine as natural channel to excrete minerals.
Water balance ml/h/day values for sheep fed R2 and R3 are significantly higher (p≤0.05) than those of animals fed R1 and R5. While the lowest was R6.
Table (4): Water balance (ml / head / day) of animals fed the experimental diets.
Rumen parameters:
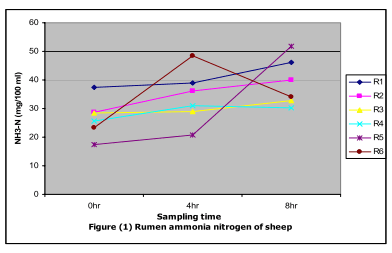
Data revealed that the ammonia–N (NH3–N) concentration mg/100ml rumen liquor (RL) was significantly (p≤0.05) higher in R5 which is rich diet with CP than those of R1, R6, R2,R3 and R4, respectively (Figure 1).
The prefeeding ammonia–N values increased significantly to reach to the peak value at 8 hr post feeding (Fig 1). Mehrez et al. (2001) found that 20.61mg/100 ml RL NH3–N would satisfy microbial needs for N and hence maximize the rate of fermentation of the experimental diet in the rumen. Hassan (2009) also reported that ruminal microbial protein synthesis requires an adequate supply of nitrogen to achieve maximal efficiency. Also, because of lower nitrogen content uncoupled fermentation could occur (McMeniman, 1976).
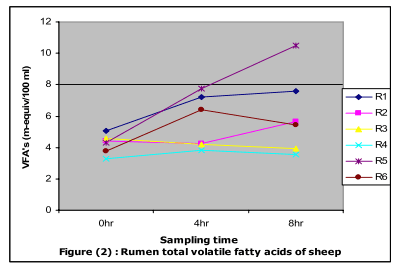
The average values of ruminal total volatile fatty acids (TVFA´s) (Fig. 2) showed that the highest (p≤0.05) value was recorded in R5 and the lowest in R4 . This result may be due to higher salt and lower energy contents of Atriplex which shortening the rumen turnover time with consequential influences on rumen physiology and metabolism (Warner and Casson; 1992 and Konig, 1993) and decrease the production of VFA ´s in the rumen (Shawket and Ahmed, 2009).
The prefeeding TVFA´s values (Fig.2) significantly (p≤0.05) increased to reach the peak value at 8 hr post feeding.
Blood metabolites:
Blood metabolites (Table 5) were used to monitor nutrient status. In the current study, there was a sampling time effect after feeding for all the studied parameters. Serum biochemistry was within the range that was reported by other authors (Rankins et al. 1991 and Getachew et al. 2008) and there were different variations among the studied groups before and after feeding.
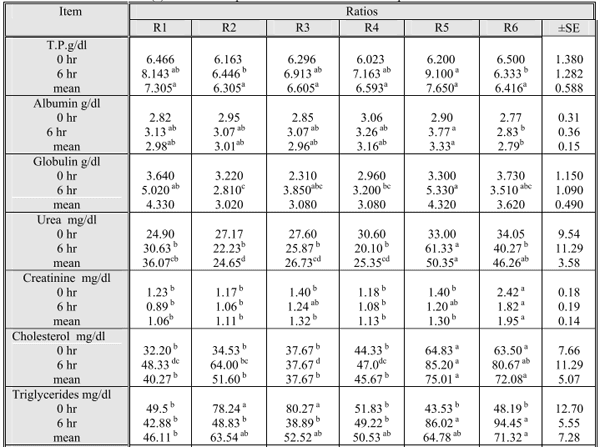
Serum total protein (TP) showed a significant (p≤0.05) elevation post feeding (Table 5). The lowest value was recorded in control group and the highest one in R5. These findings agree with the fact of dietary CP which was highest in R5 (alfalfa) and lowest in BH and R4 (At). Moreover, dietary CT was highest in BH and R4 and lowest in R5. Although Getachew et al. (2008) found that alfalfa protein is poorly utilized by ruminants due to its rapid degradation in rumen. Indeed, the alfalfa digestibility was reduced in the diet containing barley grains (Jahani-Azizabadi et al.,2009). CT may share in these variations as CP forms a complex with tannins under aerobic conditions causing a lowering in the available protein intake (Wina et al, 1999). Also, the ability of tannins to precipitate different proteins varies considerably (Bennick, 2002).
BH was free from saponins as previously reported and At (R4) was the highest ration in saponins. Saponins reduce protein digestibility by the formation of less digestible saponin – protein complexes affecting the nutritive value of the diet (Potter et al,1993). In addition the complementarity´s of tannin – rich shrubs and a saponin-rich shrub positively influenced biomass intake (Rogosic et al,2006) . Alao, CT and saponin alleviate the adverse effect of each other (Makkar, 2003).Neglecting the sampling time, there was no significant variations among experimental rations. Albumin showed the same pattern among groups where the highest levels were recorded in R5 and the lowest ones in R6 . Significant (p≤0.05) differences were reported when neglecting sampling time. Globulin showed significant (p≤0.05) diet effect among the studied groups.
Urea –N was decreased (P≤0.01) in post feeding and when neglecting time (Table 5) reflecting low protein intake by sheep fed the experimental diets. Present results were in agreement with those reported by Rankins et al,(1991) who mentioned that low protein intake although serum total protein, albumin and globulin were elevated but protein intake was not low enough to compromise protein synthesis by liver. Samanta et al. (2003) showed that plasma urea – N reflects the dietary CP intake. Getachew et al. ( 2008) found that only blood urea – N was affected by both the level of tannin and sampling time after feeding although other metabolites were affected by sampling time. They proved the blood urea –N was elevated at 2h after feeding and started to decline to the pre – feeding level. Romero et al. (2000) also showed that sheep fed with tanniferous diet had reduced blood urea-N level than sheep fed lower dietary tannin.
Creatinine levels were elevated significantly (p≤0.05) before and after feeding and indicating impairment of renal functions (Brenner et al., 1987).
As can be observed, considerable decrease in cholesterol levels in all studied groups except R5 and R6 was recorded before and after feeding even when neglecting time. This result is consistent with those reported by Potter et al. (1993) and Matsuura (2001) who found that saponins from different sources causing lower serum cholesterol levels in a variety of animals as several dietary saponins have a hypocholesterolaemic action (Francis et al, 2002). Also, if causes a delaying of the intestinal absorption of dietary fat by inhibiting pancreatic lipase activity (Han et al., 2000). On the other hand, tannins play a considerable role in lipids digestibility by complexing with fatty acids(Romero et al., 2000) causing a decrease in cholesterol absorption and increase in fat excretion (Bravo et al., 1993).
Cocerning serum enzymes, AST was significantly (p≤0.05) increased post feeding and on neglecting the time factor. This elevation could be attributed to tannin content of the diet. Reed (1995) and Silanikove et al. (1996) reported hepatotoxicity and elevated AST in goats and cattle fed on tanniferous forages, while Romero et al. (2000) did not find such elevation. Fitcher (1993) explained the elevated AST to be due to muscle destrophy. ALT showed nonsignificant variations except post feeding values. Makkar et al. (1988) assumed that the inhibitory or stimulatory effect of tannins on enzyme activity may result from a change in the conformation of the enzyme in the presence of tannins leading to a variable variability of substrate at the catalytic site of the enzyme.
Table (5): Some blood parameters in animals fed the experimental diets .
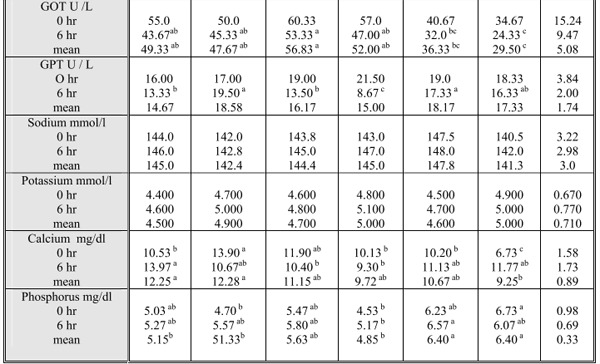
As show in Table (5), indicated that Sodium and potassium levels in blood serum of the studied animals were not differed significantly among the studied groups neither at 0 hr nor at 6 hr post feeding. Na and K were within the normal concentrations which are in agreement with the findings of El – Shaer et al. (2001). On the other hand sheep fed R2 had higher (P≤ 0.05) Ca level than sheep fed saltbush alone, alfalfa or the traditional ration (BH) at 0 hr. There were also considerable variations in P level in the blood serum of the studied sheep where the highest P levels were recorded in those fed R6. This elevated P level in this group could be due to that P content in At and BH was slightly higher than maximum tolerable levels (NRC, 1980) (0.702 and 0.666 % vs. 0.6%. Generally, these hypocalcemia in R6 could be attributed to the presence of high levels of CT in BH because tannins can disturb the absorption of minerals by chelation of them within the gastrointestinal tract of the animal (Cowieson et al., 2004) and / or increase the endogenous losses of the minerals such as Ca (Mansoori and Acamovic, 1997). Also, BH may contain oxalic acid which binds with Ca to form a non soluble, non digestible Ca oxalate (Cheeke, 1995). Moreover, the imbalanced Ca: P ratio in this group might be responsible for decreasing Ca availability of sheep in the same group (McDowell, 1992) while the rest of animal groups were within normal levels of both minerals (9 -12, and 4.5-6mg/dl) respectively for Ca and P as described by Kincaid (1993).
Minerals retention:
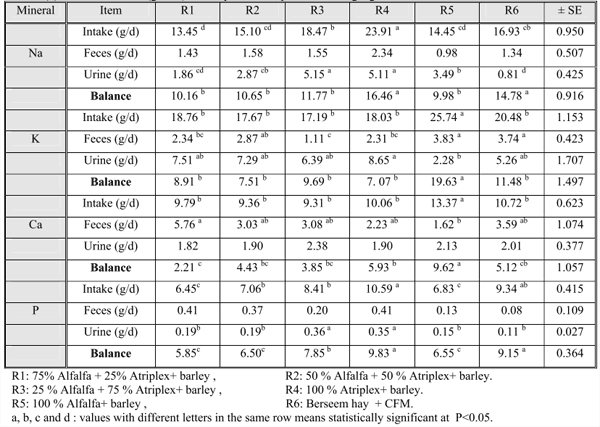
As shown in Table (6), Na intake was increased as the ratio of Atriplex increased. This results was matched with the fact of that Atriplex contain the highest concentration of Na (table 1). Sodium intake increased in the following order from R1, R5, R2, R6, R3 and R4, respectively. Wilson (1996) consistent with our results in that high amount of Na and K salts found in Atriplex species. Differences in Na intake among studied groups were significant (P≤0.05) while fecal Na excreted without significant differences . Urine is generally accepted as main pathway for the excretion of Na (McDowell and Arthington, 2005). Significant (p≤0.05) urinary sodium loss was noticed among tested animals . The highest urinary sodium was reported in R3 and R4 (the highest Na intake groups and highest percent of Atriplex). Sodium balance also follows the same pattern where Na balance increased as a result of increasing Atriplex (from R1, R2, R3 and R4). R5 (100% alf) revealed the least sodium balance with significant (p≤0.05) differences.
It is clear that animals fed alfalfa alone had the highest K intake followed by control animals R6 then R1, R4, R2 then R3. Differences among groups were significant (P≤0.05). Potassium content of alf and Atriplex were comparable but K intake in R5 could be attributed to highest DM intake in R5 (Table 2) however, the lowest K intake in R3 was attributed to lowest DM intake in the same group. Fecal and urinary K output varied significantly (p≤0.05) among treatments but most of the excreted K was via urine and this consistent with the fact that urine is the major pathway for the excretion of potassium (McDowell and Arthington, 2005). Potassium balance was slightly different among groups.
The highest (p≤0.05) Ca intake was recorded in R5 while R1, R2 and R3 revealed comparable values of Ca intake. R4 and R6 were also comparable. Fecal Ca revealed significant (p≤0.05) differences among groups . It is well known that feces is the main route of Ca excretion (McDowell and Arthington, 2005). The present study revealed that fecal Ca was affected by saltbush percentage in the diet which contains high levels of secondary metabolites mainly oxalic acid which binds with Ca to form calcium oxalate, non – soluble, non – digestible compound ( Alazzeh and Abu Zanat, 2004 :Cheeke, 1995). Generally, urinary Ca loss tended to remain low and constant. There are no differences among groups in urinary Ca . Calcium balance was positive for all different groups with significant (p≤0.05) differences.
The higher levels of P intake in diets as a result of increasing saltbush to reach its peak in R4 could be due to the high content of P in saltbush as reported in Table (1). Al azzeh and Abu – Zanat (2004) reported similar conclusion where saltbush leaves are rich in minerals and more palatable than other parts of the plant. Feces is the main pathway for P excretion in ruminants (McDowell and Arthington, 2005). There were no differences among studied animals in fecal phosphorus. The highest fecal P was recorded in R4 and this finding consistent with the experimental findings which recorded that saltbush had the highest level of P and animals of this group showed highest P intake. However, the least level was in R6 where animals fed traditional ration.
Urinary P was different significantly (P≤0.05) among groups. The highest urinary P was recorded in R3 and R4. R1 and R2 showed comparable values. The lowest levels were noticed in R5 and R6, respectively. Phosphorus balance was positive in the present study with significant (p≤0.05) variations .
Feeding saltbush to sheep affecting minerals status in animal body leading to a decrease in Ca and P levels in blood as noticed in Table (5) whether saltbush was introduced as a complementary feed or alone. Also, all studied minerals were in positive balance because alf can alleviate constrains of saltbush in diets. Therefore, special attention should be taken when feeding saltbush to sheep for long periods.
Table (6): Mineral balance (gm/ dl) of sheep fed the experimental roughage
Conclusion and recommendation:
From the aforementioned results we could conclude that: Atriplex nummularia had a pronounced nutritive value as a fodder component when mixed with other plant species for livestock as previously detected in (R1, R2 and R3) rather than its intake alone (R4). The main disadvantages of using A. nummularia alone as animal feed are: high in ash and minerals contents and has insufficient energy density for sheep. This fact affecting negatively on its DMI, DCP and TDN as appeared in R4. Finally R2 is nutritious despite the generally low the nutritive value and energy content.
References:
1. Abdel–Malik, W. H.; El–Sayes, M. F.; Khinizy, A. E. M.; and Soliman,E. (2001): Yield and quality of Berseem and Alfalfa cultivated in newly reclaimed sandy soil in response to foliar trace mineral fertilization and its effect on lamb performance. Egyptian J. Nutr. And Feeds (4), Special Issue: 167 – 177.
2. Abu – Zanat, M. M. W. and Tabbaa, M. J. (2005): Effect of feeding Atriplex brows to lactating ewes on milk yield and growth rate of their lambs. Small Ruminant Research, 1-10.
3. Aganga, A. A. ; J. K. Mthetho and S. Tshwenyane. (2003): Atriplex Nummularia (Old Man Saltbush) : A Potential Forage Crop for Arid Regions of Botswana. Pakistan Journal of Nutrition 2 (2): 72-75.
4. Ahmed, M.H., Khatab, I.M., Borhami, E.B. and W.G. Fahmy. (2001): Effect of energy source supplementation of the utilization of some desert forage by growing Lambs. J. Adv. Agric Res., 6: 255-277.
5. Alazzah, A. Y. and Abu – Zanat, M. M. (2004): Impact of feeding saltbush (Atriplex sp.) on some mineral concentrations in the blood serum of lactating Awassi ewes. Small Ruminant Research, 54: 81 – 88.
6. Allam, Sabbah, M.; Youssef, K. M.; Ali, M. A. and AboBakr, S. Y. (2006): Using some fodder shrubs and industrial by products in different forms for feeding goats in Sinai. J. Agric. Sci. Mansoura Univ., 31(3): 1371 – 1385.
7. Al-Owaimer A. N.; Zahra, S. M. and AlBassam, B. A. (2008): Effect of feeding some types of Atriplex spp. in complete diet on growth performance and digestibility of growing lambs. Res. Butt., No. (161), Food Sci. and Agric. Res. Center, King Saud Univ. pp (5 – 19).
8. Anon, (2009): Introduction of salt tolerant forage production systems to salt – affected lands in Sinai Peninsula in Egypt: a pilot demomstration project. Final Report, DRC, Egypt – ICBA, UAE.
9. A.O. A. C. (1997): Official Methods of Analysis. 16th Ed. Assoc. Offic. Anal. Chem., Arlington, VA.
10. Balbaa, S.I.; S.H. Hilal and A.Y. Zaki (1981): Medicinal plants constituents. 3rd ed. General Organization for University Books, Cairo, Egypt. 644 pp.
11. Bennick, A. (2002) : Interaction of plant polyphenols with salivary proteins. Critical reviews in Oral Biology and Medicine 13, 184 – 196.
12. Ben Salem, H.; Nefzaoui, A.; Makkar, H. P. S.; Hochlef, H.; Ben Salem, I. and Ben Salem, L. (2005b) : Effect of early experience and adaptation period on voluntary intake, digestion and growth in Barbarine lambs given tannin – containing (Acacia cyanophylla Lindl. foliage) or tannin – free (oaten hay) diets. Anim. Feed Sci. and Tech. 122, 59 – 77.
13. Ben Salem,H.; Makkar,H.P.S.; Nefzaoui,A.; Hassayoum,L. and Abidi, S. (2005): Benefit from association of small amounts of tannin – rich shrub foliage (Acacia cyanophylla LindI.) with soya bean meal given as supplements to Barbarine sheep fed on oaten hay. Anim. Feed Sci. Technol., 122: 173 – 186.
14. Berthelot, M. (1959): Estimation of serum urea. Report Chem. Applique 1: 248.
15. Bhatti, J. A., M. Younas, M. Abdullah, M. E. Babar and H. Nawaz. (2009): Feed intake, weight gain and haematology in nili-ravi buffalo heifers fed on mott grass and berseem fodder substituted with saltbush (atriplex amnicola). Pakistan Vet. j., 2009, 29(3): 133-137.
16. Blaxter, K. L. (1968): The energy metabolism of ruminants. 2nd Ed. Hutchinson and Co. Lted. London.
17. Bravo, L.; Manas, E. and Caixto, F. S. (1993): Dietary non extractable condensed tannins as indigestible compound. Effect on fecal weight and protein and fat excretion . J. Sci. Food Agric., 63: 68.
18. Brenner, B.; Coe, F. L. and Rector, F. C. jr. (1987): Renal physiology in health and disease. W. B. Saunders, Philadelphia
19. Cheek, P. R. (1995): Endogenous toxins and mycotoxins in forage grasses and their effect on livestock. J. Anim. Sci. 73, 909 – 918.
20. Church, D . C . and W . G . Pond (1982): Basic Animal Nutrition and Feeding , 2 nd ed .Johnwiley and Sons, New York, U. S .A .
21. Cowieson, A. J.; Acamovic, T. and Bedford, M. R. (2004): The effects of phytase and phytic acid on loss of endogenous amino acids and minerals from broiler chickens. British Poultry Sci., 45: 101 – 10
22. Duncan, D. B., (1955): Multiple range and multiple Ftests. Biometrics, 11: 1-42.
23. Eid, E. Y. A. (2003): Feed utilization and performance of animal fed the natural and cultivated fodder shrubs in Sinai. Ph D. Thesis, Fac. Of Agric. Cairo univ. Egypt.
24. El Aich, A.,( 1987): Fodder trees and Shrubs in range and farming systems in North Africa. Food and Agricultural (FAO) report. Rome.
25. El – Shaer, H. M. (2010); Halophytes and salt tolerant plants as potential forage for ruminants in the Near East region. Small Ruminant Res. 91: 3- 12.
26. El-Shaer, H. M.; Ali F.T. ; Morcos N.Y.S. ; Emam S.S. and Essawy A.M. (2005): Seasonal changes of some antinutritional factors contents of some halophytic shrubs and the effect of processing treatments on their utilization by sheep under desert conditions of Egypt. EgyptianJ.Nutr.Feeds,8 (1) SpecialIssue:417-431.
27. El – Shaer H. M.; Fahmy, A. A.; Abdul Aziz, G. M.; Shalaby, A. S. and Abd El Gawad, A. M. (2001): Nutritional evaluation of non – conventional fattening diets fed to sheep under arid conditions of Egypt. Proceeding of International Conference, Tunisia, 8 -10 Nov.
28. El-Shaer, H.M., Kandil, N.M. and Khamis, H. S. (1991): Salt marsh plants ensiled with dried broiler litter as feedstuff for sheep and goats. J. Agric. Sci. Mansoura Univ., 16(3): 1524 – 1534.
29. Fitcher, L.R. (1993): Grazing ryegrass endophyte associations and their effect on animal health and performance. In: Proc. 2nd . Int. Symp. On Acremonium Grass Interactions: Plenary papers. P. 115. Ag Research. Grasslands Research center, palmerston.
30. Francis, G.; Kerem, Z.; Makkar H. P. S. and Klaus Becker. (2002): The biological action of saponins in animal systems: a review. British Journal of Nutrition, 88, 587–605
31. Getachew, G.; Pittroff, W.; DePeters, E. J.; Putnam, D. H.; Dandekar, A. and Goyal, S. (2008): Influence of tannic acid application on alfalfa hay: in vitro rumen fermentation, serum metabolites and nitrogen balance in sheep. Animal, 2:3, pp381 – 390.
32. Gihad, E. A. and El – Shaer, H. M. (1992): Utilization of halophytes by livestock on rangelands. In: Squires, V. R.; Ayoub, A. T. (Eds.), Halophytes as a source for livestock and for rehabilitation of degraded lands. Kluwer Academic publishers, Dordrecht, pp. 77 – 96.
33. Gitelman, H. (1967): Determination of serum calcium using O-cresalphathalein complexone. Annal. Biochem. 18: 521.
34. Goering, H.K. and P.J. Van Soest (1970): Forage fiber analysis. Agricultural Handbook, No. 379, USDA, Washington. DC, U. S. A.
35. Goodwin, J.F. (1970): Quantitative estimation of inorganic phosphorus. Clin. Chem., 16 (9): 776 – 80.
36. Han, L.K.; Xu B.J, Kimura Y, Zheng ,Y.N. and Okuda, H. (2000): Platycodi radix affects lipid metabolism in mice with high fat dietinduced obesity. Journal of Nutrition 130, 2760–2764.
37. Hassan, A. A. (2009): Effect of some Enrichment and Nawaz biologicaltreatments on a melioration utilization of Atriplex nummularia fed by sheep. Egyptian J. Nut. And Feed. (12) : (3) Special Issue : 553-566.
38. Jahani–Azizabada, H.; Mesgaran, D. M.; Valizadeh, R. and Moghaddam, N. H. (2009): Comparison of in vivo with in situ mobile bag and three step enzymatic procedures to evaluate protein disappearance of alfalfa hay and barley grain. Iranian J. of Veterinary Research, Shiraz University, Vol. 10, No. 3, Ser. No. 28, 2009.
39. Karabulut, A.; OzgurOzkan, C.; Kamalak, A. and Canbolat, O. (2006): Comparison of the nutritive value of a native Turkish forages, tumbleweed hay (Gundelia tournefortii L.), wheat straw and alfalfa hay using in situ and in vitro measurements with sheep. Arch Latinoam. Prod. Anim. Vol. 14 (3): 78 – 83.
40. Kearl, L.C. (1982): Nutrient requirements of ruminants in developing countries. Utah Agric. Exp. St., Utah State Univ. Logan, UT, U. S. A.
41. Kincaid, R. (1993):Macroelements for ruminants. In: Church, D. C. (Ed.), Ruminant Animal Digestive Physiology and Nutrition. Prentice – Hall, Englewood Clifs, NJ, pp: 326 – 341.
42. Konig, K. W. R. (1993): Influence of saltbush (Atriplex spp.) as diet component on performance of sheep and goats under semi arid range condition. Ph D. dissertation, Reihe Agrarwissenschaft, Institute for animal production in the tropic and subtropics, Aachen, Germany (ISBN: 3 – 86 111706-1).
43. Makkar, H.P.S. (2003): Effects and fate of tannins in rumunant animals, adaptation to tannins, and strategies to overcome detrimental effects of feeding tannin-rich feeds. Small Rumin. Res. 49: 241-256.
44. Makkar, H. P. S.; Singh, B. and Dawra, R. K. (1988): Effect of tannin- rich leaves of oak (Quercus incana) on various microbial enzyme activities of the bovine rumen. Br. J. Nutr., 60: 287 – 296.
45. Mansoori, B. and Acamovic, T. (1997): The excretion of minerals from broilers fed tannic acid with and without gelatin. Proc. Spring Meeting of the world poultry Science Association. Pp. 25 – 26 .
46. Masters D. G., N. Edwards, M. Sillence, A. Avery, D.Revell, M. Friend, P. Sanford, G. Saul, C. Beverly and J. Young, (2006): The role of livestock in the management of dryland salinity. Aust. J. Exp. Agri., 46(7): 733- 741.
47. Matsuura, M. (2001): Saponins in garlic as modifiers of the risk of cardiovascular disease. Journal of Nutrition 131, s1000S–1005S.
48. McDowell, L. R. and Arthington, J.D. (2005): Minerals for grazing ruminants in tropical regions. 5th Ed. 86pp. University of Florida, Gainesville, F1.
49. McDowell, L. R. (1992): Minerals in animal and human nutrition. Academic Press, New York, pp. 265 – 293 .
50. McMeniman, N. P. (1976) : Studies on the supplementary feeding of sheep fed mulga under pen conditions. Australian J. of Experimental Agricultural and Animal Husbandry. 16: 818 – 822.
51. Mehrez, A. Z.; Soliman, E. M.; El – Ayek, M. Y.; El Ayouty, E. A. and El Kholany, M. E. (2001): Influence of roughage to concentrate ratio and type of roughage on digestibility, some rumen parameters and fiber fractions degradability of treated rations with ruminants. Egyptian J. Nutrition and feeds (4). Special Issue: 193
52. Mulligan, F. J.; Caffrey, P. J.; rath,, M.; Callan, J. J. and O ´ Mara, F. P. (2001): The relationship between feeding level, rumen particulate and fluid turnover rate and the digestibility of soya hulls in cattle and sheep (including a comparison of Cr-mordanted soya hul;ls and Cr2o3 as particulate markers in cattle. Livestock Production Science 70,191 – 202.
53. NRC (National Research Council), (1980): Mineral Tolerance Of Domestic Animals. Washington, D. C. National Academy Press.
54. NRC (National Research Council), (1985); Nutrient Requirements of sheep. National Academy Press, Washington, DC, pp. 45 – 48.
55. Porter, L.J.; L.N. Hrstich and B.G. Chan (1986): The conversion of procyanidins and prodelphinidins to cyaniding and delphinidin. Phytochemistry 1: 223- 230.
56. Potter, S.M.; R. Jimenez-Flores; J. Pollack; T.A. Lone and M.D. BerberJemenez (1993): Protein saponin interaction and its influence on blood lipids. J. Agric. Food Chem. 41: 1287 – 1291.
57. Rankins, Jr., D.L.; G.S. Smith and D.M. Hallford (1991): Altered metabolic hormones, impaired nitrogen retention and hepatotoxicosis in lambs fed Kochia scoparia hay. J. Anim. Sci. 69: 2932.
58. Rasool, E.; Rafique, S.; Haq, I. U.; Khan, A. G.; Thomson, E. F. (1996): Impact of fourwing saltbush on feed and water intake and on blood serum profile in sheep. Asian – Australian. J. Anim. Sci, 9: 123 – 126.
59. Reed, J. D. (1995): Nutritional toxicology of tannins and related polyphenols in forage legumes. J. Anim. Sci. 73: 1516 – 1528 .
60. Reinhold, J.G. (1953): Total protein, albumin and globulin. In: M. Sleigson ed.: Standard Methods of Clinical Chemistry. Academic Press, New York, vol. 1: p. 88.
61. Rodkey, F.L. (1965): Separation and determination of the total globulins of human serum. Clin. Chem. 11: 488 – 494.
62. Roeschlau, P.; E. Bernt and W.J. Gruber (1974): Estimation of cholesterol. Clin. Chem. Clin. Biochem. 12: 403.
63. Rogosic, J.; R.E. Estell and D. Skobic (2006): Role of species diversity and secondary compound complementarity on diet selection of Mediterranean shrubs by goats. J. Chem. Ecol. 32: 1279 – 1287 .
64. Romero, M.J.; J. Madrid; F. Hernandez and J.J. Ceron (2000) : Digestibility and Voluntary Intake of Vine Leaves (Vitis vinifera L.) by sheep, Small Rumin. Res. 38: (2) 191-195.
65. Samanta, A. K.; Singh, K. K; Das, M. M.; Maity, S. B and Kundu, S. S. (2003) : Effect of complete feed block on nutrient utilization and rumen fermentation in Barbari goats. J. small Rum. Reas., 48: 95 – 102.
66. SAS (2000) : Statistical analysis systems, release 8.01 Statistical analysis systems institute Inc., Cary, NC
67. Seelig, H.P. and H. Wust (1969): Determination of serum creatinine. Arztl Labor, 15: 34.
68. Shawket, S.M. (1999): Effect of energy level supplementation on the utilization of some pasture plants by goats. J. Agric. Sci. Mansoura Univ., 24: 4565-4573.
69. Shawket, M. Safinaz ; Ahmed, M. H. Borhami, B. E. and Allam, A. M. (2002): A comparative study on the performance of lambs and goats fed on halophytic forage and supplemented with different sources of energy under arid and semi – arid conditions. Int. Symp. On Optimum Resources Utilization In Salt – Affected Ecosystems In Arid and Semi – Arid Regions, Cairo, 8 – 11 Apr. 2002.
70. Shawket, M. Safinaz and Ahmed, M. H. (2009): Effect of prolonged feeding Atriplex (saltbush) to camels on digestibility, nutritive value and nitrogen utilization. Egyptian J. Nutr. And Feeds 12 (3) Special Issue: 205- 214.
71. Shawket, M. Safinaz ; Kewan, Z. K.; Nour, M. A. and Mamdouh, A. A.S. (2005): Atriplex and Acacia shrubs as feed stuffs for young male camels and Egyptian semi – arid condition. Egyptian J. Nutr. And Feeds (8): (1) Special Issue: 225 – 241.
72. Silanikove, N.; N. Gilboa; A. Perevolotsky and Z. Nitsan (1996): Goats fed tannin–containing leaves do not exhibit toxic syndromes. Small Rumin. Res., 21(3): 195–201.
73. Trinder, P. (1969): Quantitative enzymatic–colorimetric determination of total and HDL cholesterol in serum or plasma. Ann. Clin. Biochem. 6:24.
74. Warner, A. C. J. (1964): Production of volatial fatty acids ln the rumens methods of measurments.Nut. Abst. Rev., 34 : 39.
75. Warner, B. E. and Casson, T. (1992).:Performance of sheep grazing salt tolerant forages on revegetated salt – land. Aust. Soc. Anim. Prod., 19: 237 – 241.
76. Weston, R. H.; Hogan, J. P. and Hemsly, J. H. (1970): Some aspects of the digestion of Atriplex nummularia by sheep. Aust. Soc. Anim. Prod., 8: 517.
77. Wilson, A. D. (1996): The intake and excretion of sodium by sheep fed on species of Atriplex (saltbush) and Kochia (Bluebush). Aust. J. Agric. Res., 17: 155 – 163. Wilson, R. T. (1992): Factors affecting weight and growth in one– humped camels. Proc. 1st Camel Conf. Dubai, UAE. Pub. R & W.
78. Wilkison, J.H.; D.N. Baron; D.W. Moss and P.G. Walker (1972): Standardization of clinical enzyme assays: A reference method for aspartate and alanine transaminases. J. Clin. Pathol., 25: 940.
79. Wina, E.; Tangedjaja, B.; Palmer, B. and Brooker, J. D. (1999):The effect of drying conditions on condensed tannin estimates in callindra calothyrsus. In: Proc. Internat. Workshop Tannins in livestock and human nutrition. Adelaide, Australia, pp. 106 – 110 .
This article was originally published in the Journal of American Science 2010;6(12):1447-1461]. (ISSN: 1545-1003).
Related topics:
Authors:


Recommend
Comment
Share

Would you like to discuss another topic? Create a new post to engage with experts in the community.


You may be interested in
.jpg&w=3840&q=75)
Balchem Animal Nutrition