Introduction
Mycotoxins are secondary metabolites produced by various fungi in a variety of commodities and foods. These compounds are not directly involved in the basic functioning of fungi, but some appear to play a “chemical offense” role and increase the susceptibility of the host organism to further fungal infection1. As suggested by their name, mycotoxins can cause toxic effects when consumed. The potential harmful effects of mycotoxins vary and a range of both acute and chronic effects ranging from emesis to immunosuppression have been reported2. Two globally relevant mycotoxins often found in cereal grains such as wheat are deoxynivalenol (DON) and ochratoxin A (OTA).
Both DON and OTA are currently regulated in wheat due to their potential hazardous effects and relative importance of wheat in staple foods of many populations. Existing maximum limits for DON in wheat range from 1.0 to 2 mg/kg3,4; most maximum limits for OTA in wheat are 5 g/kg3,5.
Routine testing of wheat for DON and OTA is often employed to ensure compliance with regulations during trade. It is particularly challenging to relate an analytical test result for DON or OTA from a sample back to a bulk volume of wheat because of these mycotoxins’ uneven distributions in bulk grain lots. Studies have demonstrated this variability of DON and OTA concentrations within truckloads6,7 and stored grain8.
The heterogeneity of grain with respect to DON and OTA is influenced by a variety of factors at different stages of grain production. To begin, the occurrence of these mycotoxins is variable due to such factors as precipitation and temperature during the growing season, storage time and conditions after harvest, as well agronomic factors such as selection of cultivars, tillage, and use of fungicides, which affect fungal production. The conditions that promote fungal growth and mycotoxin production vary amongst fungi. For example, the growth of Fusarium graminearum and subsequent production of DON is promoted by cool and wet conditions around the time of flowering. However, OTA is produced during storage of grain when Penicillium verrucosum flourishes and outcompetes other microorganisms.
After harvest and storage, there are other processes that can affect the presence and heterogeneity of mycotoxins in grain. In the bulk handling systems for cereal grains in North America, grain can be cleaned by using optical sorters or separators based on size or density to remove infected and contaminated kernels. Grain from various sources is also combined to produce the high volumes needed for bulk shipments. And during the transport of grain from farms to primary and terminal elevators, as well as to processing facilities, bulk volumes experience shaking which can lead to stratification of the grain.
The heterogeneity of grain with respect to mycotoxins results in measurement variability, and therefore, uncertainty in mycotoxin testing results and how they relate back to a consignment of grain. With this uncertainty comes business risk, and in the worst cases, health risks.
This paper outlines the challenges with analysing grain for mycotoxins, specifically as it pertains to sampling and processing samples and their associated variance. This paper also presents some of our research performed to characterize the challenges with analysing grain for mycotoxins. This paper presents work on the characterization of the wheat kernel to-kernel variation of two mycotoxins relevant to the international grain trade (OTA and DON), and the characterization of the heterogeneity of large wheat lots with respect to OTA and DON.
Methods and materials
Kernel-to-kernel variability of OTA and DON
Existing research activities were leveraged to obtain wheat containing DON or OTA. Due to the low frequency of occurrence of OTA during grain monitoring, wheat was inoculated and incubated to produce samples of contaminated grain. P. verrucosum-infected wheat kernels were prepared in the laboratory as a source of OTA test material. Test tubes were filled with 100 kernels of wheat at 20% moisture content (m/m) and then autoclaved to inactivate any potentially interfering or competing organisms. A kernel of wheat inoculated with an isolate of P. verrucosum known to be a prolific OTA-producer was placed on top of the sterilized kernels. The test tubes were placed inside an incubator along with controls that did not contain P. verrucosum-inoculated kernels.
At each sampling time point, an inoculated and a control tube were removed from the incubator. Individual kernels from the inoculated test tube were analysed for OTA. Initially, sampling occurred every 7 days. After 19 sampling points as the fungal spread within the tubes (assessed visually) slowed, sampling frequency was adjusted to every 14 days, ending after 413 days.
Each kernel was weighed, crushed, and placed into a 15 mL glass culture tube for extraction and analysis by liquid chromatography with fluorescence detection using a modification of Tittlemier et al.9 to increase the ratio of extraction solvent from 5:1 (v/m) to 50:1 (v/m). Blank wheat matrix and wheat certified reference material was analysed with samples from each time point to monitor method performance over the course of the study.
Kernels selected from harvest samples of western Canadian wheat, as well as durum, which were visually inspected by Canadian Grain Commission (CGC) inspectors and categorized as having no, mild, or severe Fusarium damage10 were obtained from another research project. Kernels were individually weighed, enveloped in white paper, and then crushed by a hammer. Each crushed kernel was quantitatively transferred to a glass vial and extracted and analysed for DON by gas chromatography with mass spectrometry as described in Gräfenhan et al.11 Blank wheat matrix and wheat certified reference material was analysed with samples from each batch to monitor method performance over the course of the study.
Variability of OTA and DON within large lots
Three lots of bulk wheat were sampled as the grain was being loaded onto vessels. Sampling of the wheat during loading was performed by CGC inspectors according to standardized procedures using CGC-approved automated cross-stream sample diverters and dividers12. A general schematic of the sampling process used to obtain increments, sub-lot composites, and cargo composites is shown in Figure 1. Increment samples were taken from the moving grain flow by cross-stream sample diverters at a constant interval during the entire loading of the lots. The increment samples taken from each 500 t portion of grain flow were then combined into a 500 t sub-lot composite sample. A Boerner divider (Seedburo Equipment Company) was used to divide the 500 t sub-lot composite sample into a 2 kg laboratory sample as well as a separate portion that was subsequently used to prepare the cargo composite.
The portions of all 500 t sub-lot composite samples obtained during the loading of an entire lot were combined to form the cargo composite. A Boerner divider was used to divide the cargo composite into a 10 kg laboratory sample.
The 10 kg cargo composite laboratory samples of whole grain were processed according to the method described in Tittlemier et al.13 The 2 kg sub-lot composite laboratory samples of whole grain were processed in a similar fashion. Comminution was performed on the Retsch rotor beater mill, and the entire mass of ground grain was homogenized and divided into 10 x 200 g portions on the RSD. After the first division into 10 x 200 g, all 10 portions were recombined in the RSD hopper and divided into 10 x 200 g again. Five of the 200 g portions were randomly selected and combined, and the 1 kg combined sample was then homogenized and divided on the RSD into 10 test portions of 100 g of ground grain.
Samples were analysed for OTA and DON using validated and published methods9,11.
Figure 1. Schematic of sampling process used to obtain increments, sub-lot composites, and cargo composites.
Results and discussion
Kernel-to-kernel variability of OTA and DON
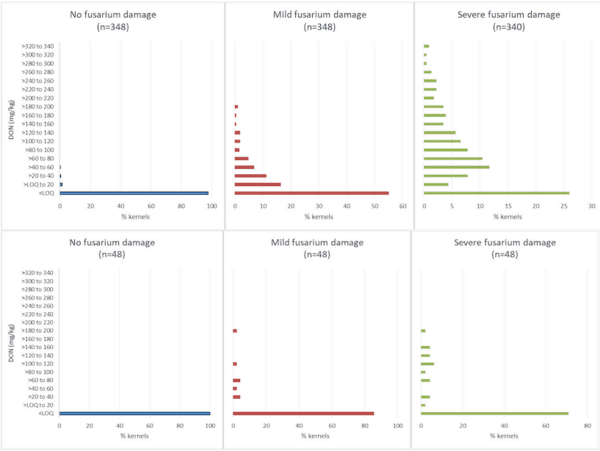
Concentrations of DON in individual kernels with no, mild, or severe Fusarium damage ranged from less than the limit of quantitation (0.3 mg/kg) to 414 mg/kg. As expected, DON was more frequently detected, and at higher concentrations, in kernels characterized as having severe Fusarium damage (Figure 2). Concentrations of OTA in individual kernels (n=3497) sampled and analysed from all time points ranged from less than the limit of quantitation (0.02 mg/kg) to 583 mg/kg.
Analysis of the distribution of concentrations and comparison between the two mycotoxins was limited due to the nature of the sample sets available for use; one was naturally infected kernels (DON) and the other was inoculated and incubated under laboratory conditions (OTA). The original aims of both sample sets were not related to determining the distribution of the two mycotoxins amongst kernels. However these sample sets still provide valuable information on the compositional heterogeneity of grain with respect to OTA and DON. Data on this type of compositional heterogeneity are very limited.
Concentration ranges in the individual kernel sample sets spanned over 4 orders of magnitude for OTA and differed with incubation time. For example, kernels with measurable OTA appeared after 28 days. At this time point, only 4% of kernels contained measurable OTA. After 49 and 91 days, the proportion of kernels containing measurable OTA increased to 66% and 93%, respectively. Median kernel OTA concentrations were 0.26 mg/kg and 4.4 mg/kg after 49 and 91 days, respectively. Figure 3 provides a snapshot of kernel OTA concentration distribution at two time points.
This sample set of kernels is very comprehensive as it covers a range of storage times and would include kernels at the initial stages of infection and OTA production, to highly infected and contaminated kernels. As a whole, this sample set is likely a good representation for “hot spots” of OTA contamination in bulk grain at later steps of the grain handling chain. At these later steps, bulk lots are composites of grain from many sources that have been subject to potentially many different storage conditions.
Concentration ranges in the individual kernel sample sets spanned over 3 orders of magnitude for DON. Range widths depended both upon grain class and degree of Fusarium damage. As illustrated in Figure 2, kernels classified as having more severe Fusarium damage contained DON more frequently and at higher concentrations. DON concentrations ranged from < 0.3 to 55 mg/kg for wheat kernels showing no damage, from < 0.3 to 199 mg/kg for kernels showing mild damage, and < 0.3 to 414 mg/kg for kernels showing severe damage. Wheat kernels also contained DON more frequently, and in a wider range, than durum kernels. For kernels classified as having severe Fusarium damage, 29% of durum kernels contained measurable DON (maximum of 199 mg/kg) as compared to 74% of wheat kernels (maximum of 414 mg/kg).
The distributions provided in Figure 2 reflect DON concentrations in a sub-set of kernels classified with a certain level of Fusarium damage; they do not reflect the distribution of DON in wheat. The kernels selected for study were purposefully chosen to provide approximately equal numbers of kernels displaying no, mild, or severe visual symptoms of Fusarium infection. However, the sample set still provides useful information on factors that will contribute to the variance of DON measurements in wheat.
DON concentrations were significantly negatively correlated with kernel mass (Pearson Product Moment Correlation, r2 = 0.234, p < 0.00034). No association between kernel mass and OTA concentration was observed. As mass decreased, DON concentration increased. The more severely damaged kernels were shrivelled or shrunken and contained higher DON. The ratio of mean mass of severely damaged kernels to those with no damage was 0.65.
The correlation between kernel mass and DON concentration introduces a challenge for proper sampling of bulk wheat for mycotoxin analysis. As bulk wheat is moved along the grain handling chain it will stratify, and the shrunken and shrivelled severely damaged kernels will not be evenly distributed throughout the bulk volume. This will result in the stratification of DON within the bulk volume as well. Such stratification was noted for a truckload of wheat6 as well as multiple truckloads of barley14. Based on the lack of association between kernel mass and OTA concentrations, such stratification is not expected for OTA.
Figure 2. Distribution of DON concentrations in naturally infected individual wheat (top row) and durum (bottom row) kernels visually assessed with various degrees of Fusarium damage.
These experimental results demonstrate that the compositional heterogeneity of grain with respect to OTA and DON depends on a number of factors, and these factors are not constant. For OTA, the length of time wheat has been in storage under the particular conditions needed for OTA production will be a main factor affecting compositional heterogeneity. Annual cycles of OTA concentrations peaking in the late summer and early fall, after a winter of storage reflect the impact of time on OTA occurrence9. For DON, the degree of Fusarium damage, and therefore DON, present in a volume of grain will depend on several interrelated factors including growing location-related precipitation and temperature15. Growing location will also impact the microbiome, which influences the potential of infection and DON production, as certain species or strains produce less, or even no, DON16. These factors can change substantially amongst years. For example, the percentage of samples containing enough Fusarium damaged kernels to be downgraded in quality according to Canadian tolerances varied from less than 5% in 2003 to approximately 60% in 2016, the most previous outbreak of Fusarium head blight in western Canada17. Therefore as wheat from multiple growing locations and years is combined into lots at different times, each lot will have its own compositional heterogeneity.
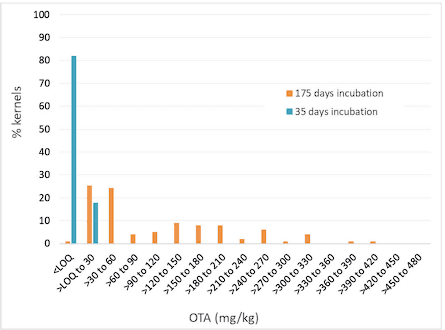
Figure 3. Distribution of OTA concentrations in individual wheat kernels inoculated with P. verrusocum.
Variability of OTA and DON within large lots
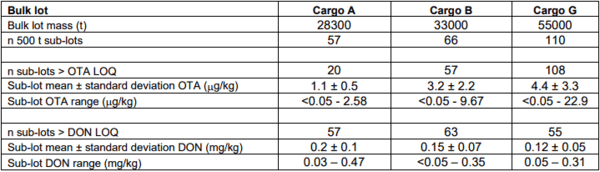
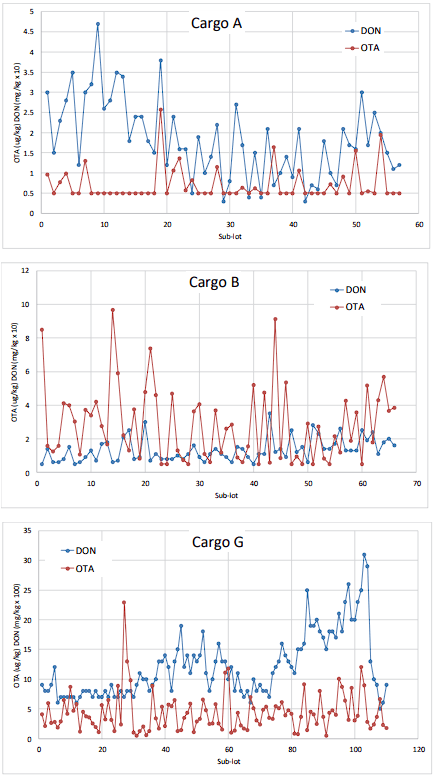
A summary of the OTA and DON results from the analysis of the 500 t sub-lot composites for each of the three bulk wheat vessel shipments is provided in Table 1. Figure 4 illustrates the sequential OTA and DON concentrations for the individual 500 t sub-lot composites prepared during loading of each of the three bulk wheat lots. Visual inspection of the plots suggests that there is minimal spatial dependence of OTA concentrations amongst 500 t sub-lots during loading, but that may not be the case with DON.
Table 1. Summary of OTA and DON results from the analysis of 500 t sub-lots of bulk wheat.
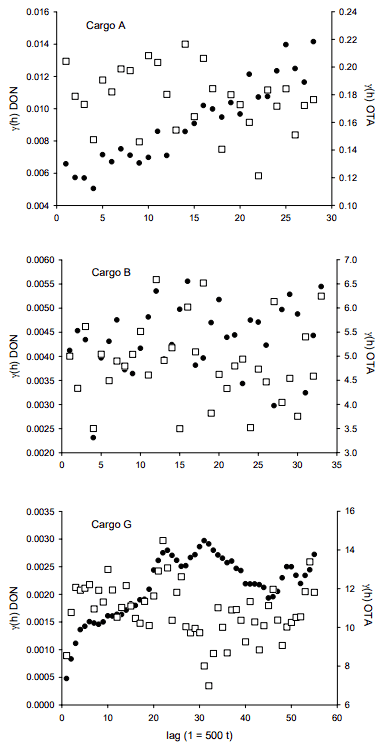
The experimental variograms shown in Figure 5 were used to further explore the spatio-temporal variability of DON and OTA in the three bulk wheat shipments. For OTA in all three cargos and DON in cargo B, no correlation amongst sub-lot composites is apparent. However, the variogram for DON in cargo A suggests a prominent trend in concentration. This is reflected in the line plot in Figure 4 showing a decrease in concentration over the first 47 sub-lots. The variogram for DON in cargo G suggests a cyclical aspect as well as a broader trend in concentrations; the variogram is again a reflection of the observed concentration line plots in Figure 5.
Figure 4. OTA and DON in 500 t sub-lot composites of bulk wheat lots. Results below the limits of quantitation were set equal to the limits (OTA 0.5 g/kg; DON 0.05 mg/kg).
In particular for DON, the differences observed in the variograms from the three cargos indicate that at the end of the grain handling chain, the spatial structure of bulk volumes of wheat with respect to Fusarium damage and DON concentration can take many forms. However, these spatial structures are but a snapshot in time during loading of the bulk volumes. As the grain enters the cargo holds it will flow; it will shift during transit, and will also flow and alter its spatial structure during the process of unloading at destination. As is well-known from the experiences within the Theory of Sampling (TOS) realm, heterogeneity is indeed a transient phenomenon, ever changing when lots are agitated.
Figure 5. Variograms of OTA (white squares) and DON (black circles) in 500 t sub-lot composites of three bulk wheat lots. Results below the limits of quantitation were set equal to the limits (OTA 0.5 g/kg; DON 0.05 mg/kg).
Conclusions
The wide concentration ranges observed for both DON and OTA in individual wheat kernels indicate that there is a well grounded risk for substantial compositional heterogeneity of mycotoxins within wheat in bulk lots. The wider range of OTA concentrations observed in single kernels as compared to DON, also suggested that there is a propensity for greater heterogeneity for OTA in wheat. However, other processes occurring along the grain handling chain were also noted to exert effects upon the heterogeneity of wheat.
As grain moves along the handling chain, it is combined with grain from various sources, which can alter its heterogeneity with respect to the presence of mycotoxins. The processes used in handling will also influence on heterogeneity. For example, the movement of grain in railcars could lead to a stratification of lighter Fusarium damaged wheat kernels, and therefore a stratification of DON within the bulk volume of such lots as the damaged kernels were shown to contain higher concentrations of DON.
Aspects of grain handling at terminal elevators will also influence the changing manifestations of wheat heterogeneity. During loading, grain with various quality aspects is often combined to meet customer specifications. Variograms helped visualizing the spatio-temporal variability of DON and OTA in wheat during loading of bulk volumes for shipment and highlighted both trends and cyclic variation of DON concentrations. These aspects of the DON variograms emphasize the need to take numerous increments during the entire loading process in order to obtain a composite that is representative of the entire bulk wheat volume.
The variability of DON and OTA concentrations in wheat observed at various steps and levels along the grain handling chain, from variation between kernels to variation during loading of tens of thousands of tonnes of wheat, to vessel loading, all contribute to the challenges encountered in sampling bulk grain for the mycotoxin analysis. These challenges are significant, but nothing that cannot be managed and resolved by diligent application of the stipulations in the framework of the Theory of Sampling (TOS)17-19.
This article was originally published in Proceedings of WCSB10: TOS Forum Issue 11, 239–247 (2022). doi: https://doi.org/10.1255/tosf.153. This is an Open Access article under a Creative Commons BY-NC-ND Licence. 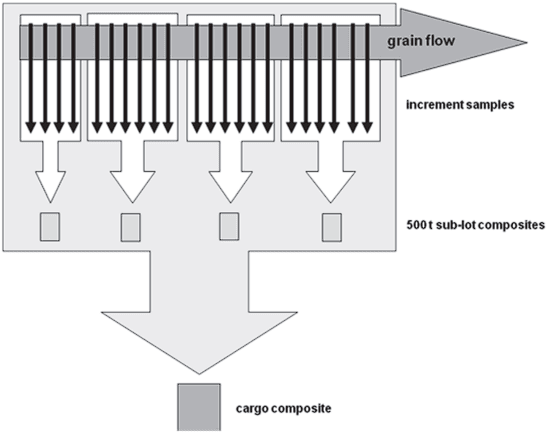


.jpg&w=3840&q=75)