Redefining selenium nutrition using organic selenium: defining maximal acceptable tissue residues in beef
Selenium (Se) is an essential nutrient for humans and livestock. Beef cattle have a general requirement of 0.1 mg/kg of selenium in the diet (NRC, 1996).
Many regions of the United States have soils that are low in Se. Because forage and feedstuff Se concentrations vary with soil Se concentrations, the Se status of US cattle herds is highly variable. Across the country 18.2% of the cows and heifers have blood Se concentrations that are considered low or marginal (Dargatz and Ross, 1996). In the southeastern region of the US, 42.4% of the cattle and 35.8% of the herds evaluated were considered to have at least a marginally deficient Se status. These deficiencies, along with stressors of marketing and transporting, results in many calves arriving at feedlots with varying degrees of Se reserves. As one of the major ingredients in feedlot cattle diets, corn contains a sufficient Se concentration (average = 0.13 mg Se/ kg diet) to meet finishing cattle requirements.
However, standard deviation on the 17 samples reported in the Nutrient Requirements of Beef Cattle (NRC, 1996) was 0.11 mg/kg. Because commodity feedstuffs are not commonly analyzed for microminerals, Se is routinely supplemented to ensure adequacy.
Since 1974, sodium selenate and selenite have been approved for use as supplements for livestock, with the feed industry primarily using the sodium selenite form. The two forms appear to have similar relative biopotencies (Mason and Weaver, 1986; Podoll et al., 1992), but in the functional ruminant, sodium selenite is known to be readily absorbed into feed particles or reduced to insoluble elemental Se or selenides in the acidic environment of the digestive tract (Podoll et al., 1992). This can result in most of the Se from selenite supplementation being excreted in feces (Lopez et al., 1969). This is of concern when supplementing beef cattle diets, because Se supplementation has been restricted to supplying a maximum of 0.3 mg/kg of Se by the US Food and Drug Administration (FDA, 1997). With the supplemental level limitations, it is desirable to have additional, more available sources of Se to use in beef cattle diets.
Selenium found in feedstuffs is most commonly associated with sulfur amino acids where it replaces the sulfur in methionine and cysteine (Levander, 1983). This is similar to the predominant form found in selenium yeast, which is selenomethionine (Kelly and Power, 1995). Research has shown that selenium from yeast is metabolized differently and has a greater availability than sodium selenite. Selenomethionine randomly substitutes for methionine in proteins while selenite is incorporated into selenoproteins (Finley, 2000).
Pehrson et al. (1999) and Gunter et al. (2003) have shown that feeding Se yeast from Sel-Plex® results in greater whole blood concentrations of Se than when sodium selenite is fed. However, data evaluating the effects of Se yeast supplementation on Se tissue concentrations in finishing cattle are not available. Therefore, the objective of this experiment was to determine the effect of feeding a basal diet balanced to meet the finishing cattle Se requirement or the basal diet supplemented with 0.3 mg/kg Se from Sel-Plex® Se yeast on corresponding calf performance, serum Se concentrations and to determine whether edible animal products (liver and muscle) exceed allowable Se concentrations.
Materials and methods
ANIMALS
Thirty-five heifers and 32 steers were purchased through local markets, vaccinated for IBR, BVD, PI3, and BRSV with Triangle 4 plus type II BVD (Fort Dodge, Overland Park, Kansas) and with a Clostridial 7-way plus Somnumune from AgriLabs (St. Joseph, MO). Calves were then delivered to The University of Tennessee Agricultural Experiment Station in Knoxville, Tennessee. Upon arrival, they were ear-tagged and tattooed in both ears, treated for internal and external parasites (EPRINEX®; Merial, Duluth, GA) and treated with Nuflor (Schering-Plough Animal Health, Union, NJ). Calves were maintained on a cool season pasture, and following a minimum interval of 28 days, all calves were weighed and heifers were verified open by ultrasonography. Twenty steers and 20 heifers were selected, blocked by sex and randomly allotted to one of eight groups of five calves. This provided four replicates per treatment (two replicates per sex).
Groups were randomly assigned to pens. Pens were in a partially covered, concrete floor-feeding barn with free choice access to automatic water fountains.
After calves were assigned to pens, they were fed a common diet (Table 1) containing 0.20 mg/kg supplemental Se from sodium selenite. Grain acclimation was accomplished by decreasing the levels of alfalfa pellets from 45% to 35%, 25%, and 15% with the difference being made up by cracked corn.
Fish meal was included in the acclimation diets allowing calves to become accustom to its consumption. High Se concentrations in fish meal allowed it to be an alternate feedstuff to be included in the final diet to maintain an adequate basal diet Se concentration if other feed ingredients varied between lots. Fish meal would replace a portion of corn and urea if needed. After the acclimation period, pens of calves were randomly assigned, within sex, to one of two finishing diet treatments. Treatment finishing diets consisted of a control basal diet (Table 2) balanced to contain 0.20 mg/kg (as-fed) of Se without supplemental Se and the basal diet plus 0.30 mg/kg (as-fed) of Se from Sel-Plex® (Alltech, Nicholasville, KY).
EXPERIMENTAL FINISHING PERIOD
This experiment was conducted as a double-blinded experiment in which only the researcher knew the composition of the Se premixes. Feeding personnel only knew the color code of Se premix to be included in each diet. Similarly, sample codes for lab analyses were labeled with an additional color-coding system so personnel conducting the Se assays did not know which samples corresponded to which dietary treatment code.
Table 1. Composition of initial grain acclimation diet.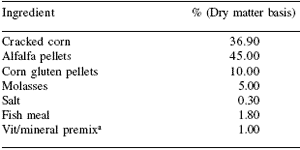
aCO-OP All Purpose Cattle Mineral, Tennessee Farmers Co-op, LaVernge, TN; Ca, 27.00%; P, 4.50%; Salt, 19.20%; Mg, 0.30%; K, 0.10%; Co, 24 mg/kg, Cu, 1,000 mg/kg, I, 36 mg/kg; Mn, 3,000 mg/kg; Se, 20 mg/kg; Zn, 3,500 mg/kg; Vit. A, 528,000 IU/kg; Vit. D, 99,000 IU/kg; Vit. E, 308 IU/kg.
Table 2. Composition of finishing diets.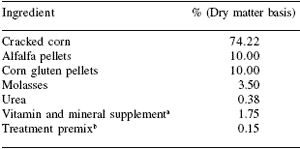
aSee Table 3 for composition of vitamin/mineral supplement.
bSee Table 4 for composition of selenium premixes.
Calf weights were recorded two consecutive days immediately prior to initiation of feeding experimental diets. Calves were weighed every 28 days for the duration of the experiment except for the final period, which was 18 days. Final weights were the average of weights taken the final two days.
Calves were fed their respective diets free choice, with daily replenishment. Prior to daily feeding, any feed present from the previous day’s feeding was removed from the feed bunk, weighed, recorded, and discarded. To verify Se concentrations of the finishing diets, a 0.45 kg sample was collected from each daily batch of complete finishing diet. These samples were collected, composited into a weekly sample, and a 0.91 kg subsample retained for Se analysis.
Additionally, a 0.45 kg sample of all major feed ingredients was collected upon delivery to the animal facility and Se content determined to verify a consistent concentration in the basal diet.
The control treatment premix contained only fine ground corn (Table 4). The Sel-Plex® treatment premix consisted of ground corn with 200 mg/kg of Se from Sel-Plex®. Treatment premixes were sampled and analyzed for Se content before feeding to ensure proper inclusion level. Both treatment premixes were blended in the treatment diets to provide 0 or 0.3 mg/kg of Se to yield total dietary concentration of 0.2 or 0.5 mg/kg Se. Both finishing diets used the same vitamin and mineral supplement, which did not contain supplemental Se, at a rate of 1.75% (dry matter basis) of the total diet. Final feeds were manufactured daily by mixing the major feed ingredients, supplement, and premixes in a horizontal paddle mixer (Marion Mixers, Inc.; Marion, IA) and then slowly adding liquid molasses.
Table 3. Composition of finishing diet vitamin/mineral supplement and mineral premix.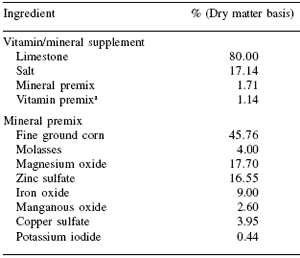
aCO-OP Vitimin ADE Micro Mix, Tennessee Farmers Co-op, LaVergne, TN; Vitamin A, 11,000 IU/kg; Vitamin D, 880 IU/kg, and Vitamin E, 5.5 IU/kg.
Table 4. Composition of finishing diet treatment premixes.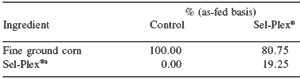
aAlltech, Nicholasville, KY.
Blood was collected from all calves on days 1, 28, 56, 84, 112, and 129. Whole blood was obtained via jugular venipuncture and collected into Vacutainers® (Becton Dickinson and Co., Franklin Lakes, NJ).
Samples were immediately placed on ice, taken to the laboratory the same morning, allowed to coagulate, centrifuged for 20 min (2,600 x g), serum harvested, and frozen (-4°C) for subsequent Se analysis.
HARVEST MEASUREMENTS
On day 130, animals were loaded for overnight transport to a commercial harvest facility. Animals were harvested on day 131. Carcasses were identified, hot carcass weights recorded, and liver samples collected. Liver samples were collected from each liver lobe (approximately 100 g from each lobe for a total of 300 g). Samples were placed in labeled plastic bags and packed in dry ice for transport to the laboratory where they were stored frozen (-4°C) until analyzed. After a 48 hr chill, standard USDA Yield Grade and Quality Grade data were recorded as determined by a USDA grader. Adjusted fat thickness was determined by measuring fat depth ¾ the distance around the longissimus muscle at the 12th rib. This fat measurement was then subjectively adjusted according to USDA guidelines to reflect the overall carcass fatness. Ribeye area (sq cm) was measured using a standard USDA grid. Each 12th rib longissimus muscle area was measured twice and the average recorded. The percentage of kidney, pelvic and heart fat (% KPH) was determined to the nearest 0.5%. These yield grade factors were used in the following USDA Yield Grade formula: YG = 2.50 + (2.50 × adjusted fat thickness) + (0.20 × %KPH) + (0.0038 × hot carcass weight) – (0.32 × ribeye area).
Carcass maturity and marbling degree evaluations were used to determine USDA Quality Grade. After completing the carcass evaluations, loin tissue samples (500 g) were collected at the 12th rib, placed in plastic bags, identified, and packed in dry ice for transport to the laboratory where they were stored frozen (-4°C) until analyzed.
SELENIUM DETERMINATION
Upon retrieval from the freezer and thawing, a scalpel blade was used to remove similar slices (by weight) from each of the three liver lobe sections of each animal to be combined for a single analytical observation. This procedure was repeated two more times to produce triplicate samples. Each loin sample was divided into four approximately equal quadrants and a core sample was obtained from each quadrant using a No. 10 cork borer (150 mm in diameter) so that a sample from each quadrant was represented in each sample for Se analysis. This procedure was repeated two more times to produce triplicate samples. Sample size from this process was approximately 6 g. This was larger than could be digested in available test tubes, so loin samples were predigested and subsampled for Se determination. Feed samples were ground to pass a 1 mm screen in a Wiley Mill (Arthur H. Thomas Company, Philadelphia, PA) prior to analysis. Selenium concentration of all samples (feed, serum, meat and liver) was determined using methodology based upon the fluorometric procedure by Koh and Benson (1983) as published by the American Association of Analytical Chemists (AOAC, 1990). Samples were analyzed for Se in triplicate and a coefficient of variation (CV) determined. If triplicates of a sample had a CV higher than previously determined acceptable, samples were rerun. In addition, a standard from the National Institute of Standards and Technology (No. 1577b bovine liver) of known Se content was assayed with each run of samples. If the bovine liver standard for a run was not within the acceptable range, the run was reanalyzed. All feed, serum and tissue Se concentrations are reported on an as-is basis.
STATISTICAL ANALYSIS
Feed consumption, growth performance, and tissue Se concentrations were analyzed as a randomized complete block design using the Mixed Procedure of SAS (Version 8.2, 1999; Carry, NC). The model included sex, diet treatment and the interaction with pen as the experimental unit. Differences in means were separated using the LSD procedure of SAS. Serum Se concentrations, collected at fixed times throughout the experiment, were analyzed using the repeated measure methodology of SAS (1999). For all response variables measured, results were considered significant at a confidence level of P<0.01.
Results and discussion
DIET SELENIUM
All feedstuffs were purchased from the local feed distributor as mill run ingredients without prior screening for Se content. Five lots of alfalfa pellets had an average Se concentration of 0.64 mg/kg and ranged from 0.47 to 0.94 mg/kg. Twelve lots of corn were all below the NRC (1996) published value of 0.13 mg/kg and averaged 0.08 mg/kg Se with values ranging from 0.05 to 0.11 mg/kg Se. Four lots of dry corn gluten feed pellets Se concentrations averaged 0.35 mg/kg and ranged from 0.35 to 0.38 mg/kg Se.
One lot of fish meal contained 2.79 mg/kg Se. Grain acclimation diets were all supplemented with 0.2 mg/ kg Se from a commercial vitamin/mineral premix (CO-OP All Purpose Cattle Mineral) and received an additional 0.06 mg/kg from fish meal; however, the diet Se concentrations varied due to changing alfalfa pellet:corn ratios. Analysis of feedstuffs used in the finishing treatment occurred after delivery to our research facility and before being incorporated into treatment diets. The control weekly diet Se analysis averaged 0.17 mg/kg Se with a standard deviation of 0.06 mg/kg and the Sel-Plex® diet averaged 0.49 mg/kg Se with a standard deviation of 0.04 mg/kg.
PERFORMANCE MEASURES
Initial body weights averaged 307 (±3.2 kg; Table 5) at allotment and averaged 360.8 (±3.5 kg) at the beginning of finishing diet treatments. Treatment had no effect on body weight on any of the weigh dates.
A tendency (P>0.02) toward heifers being lighter than steers at the initiation of treatments became significant on day 56 due to steers weighing 41.4 kg more than heifers and remained significant at day 84. The sex effect was not significant (P>0.02) for weights taken on day 112 or the final weights and there was no treatment by sex interaction for any of the body weight measurements. Treatment had no effect on the average daily gain, feed intake, or gain:feed ratio for any of the four 28-day periods, the final 18 days, or the total treatment period. There were no significant sex effects or treatment by sex interactions for average daily gain, feed intake or gain:feed ratio.
Lack of change in growth performance, feed intake, and feed efficiency determined in this experiment were expected due to both diets exceeding the Se requirements of the cattle. The general recommendation for beef cattle dietary Se is 0.1 mg/ kg (NRC, 1996) and the computer model, adjusted for conditions of this experiment, predicts a requirement of 1.48 mg/day. The average daily consumption of Se throughout the experiment was 2.85 times greater for the Sel-Plex® treatment with Controls consuming 1.71 mg/day and the Sel-Plex® group consuming 4.88 mg/hd/day of Se. No calves from either treatment showed signs or were treated for illness while consuming experimental diets indicating that the addition of 0.3 mg/kg Se from Se yeast did not result in any negative health effects.
Table 5. Weight gains, average daily gains, feed intakes and gain:feed ratios.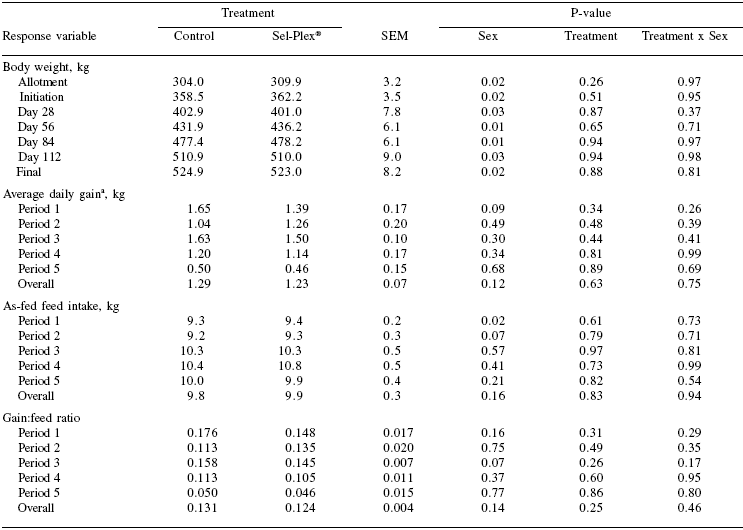
To enlarge the image, click here
aPeriod 1 = days 1 to 28; Period 2 = days 29 to 56; Period 3 = days 57 to 84; Period 4 = days 85 to 112; Period 5 = days 113 to 130; Overall = days 1 to 130.
These results agree with research from Hintze et al. (2002) in which steers were fed 55% concentrate diets that contained 0.62 or 11.9 mg/kg Se from feedstuffs. Other results from additional Se in deficient diets have been variable. When growing heifers, deemed to be receiving a Se deficient diet (Maas, 1998), were dosed with boluses releasing 3 mg of Se from sodium selenite each day, no performance differences were detected. In contrast, Nunn et al. (1996) determined that additional Se from Se boluses increased feed efficiency of steers offered a diet of Se deficient hay.
CARCASS MEASURES
No treatment differences were detected in hot carcass weight (average = 321.2 kg; Table 6), 12th rib fat (average = 1.41 cm), % KPH fat (average = 2.67), ribeye area (average = 83.25 sq cm), USDA yield grade (average = 3.0) or USDA quality grade (average = Choice0). No sex effect or treatment by sex interaction was detected for any measure. The lack of changes in carcass measures agrees with the lack of differences determined in performance.
SERUM SELENIUM
Concentrations of serum Se were affected by treatment, time and a treatment × time interaction (Figure 1). Serum Se was not affected by sex, a sex × time interaction or a treatment × time × sex interaction. On day one, there was no difference in serum Se concentration between the treatments. There was a difference between the Control and Sel-Plex® treatments at all subsequent measurements. Within the Control treatment, serum Se dropped from day 1 to 56 (0.091 to 0.078 μg/ml) and then reached a plateau (average = 0.080 μg/ml) with no point differing from the previous time point for the remainder of the experiment. This drop is associated with the change in dietary concentrations. Grain acclimation diets all had 0.2 mg/kg of supplemental Se in addition to varying levels from feedstuffs while the Control treatment had a total concentration of 0.2 mg/kg Se. In the Sel-Plex® treatment, serum Se increased between day 1 and 28 and then reached a plateau at an average concentration of 0.11 μg/ml.
Table 6. Carcass weight, 12th rib fat, KPHa fat, ribeye area, yield grade and quality grade.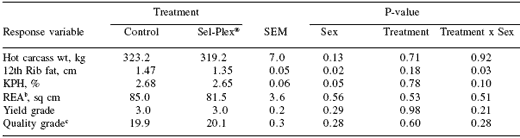
aKidney, pelvic and heart fat.
bREA = ribeye area.
c19 = Choice-, 20 = Choice0 and 21 = Choice+.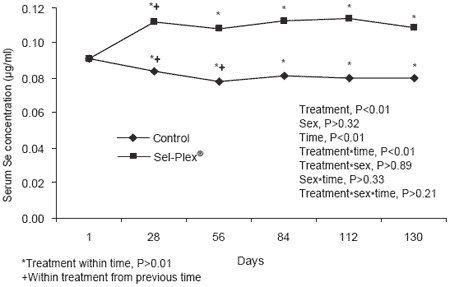
Figure 1. Serum selenium concentrations.
While this was 1.39 times the concentration in the Control, the design of this experiment did not allow differentiation between effects caused by increasing dietary Se concentrations in general or specific effects from Se yeast.
Hintze et al. (2002) conducted an experiment with growing beef cattle diets to determine if cattle from areas with naturally high Se feedstuffs could be viable sources of Se for human diets. They obtained steer calves from areas with moderate and high Se soil concentrations and consequently feedstuffs consumed by cattle. Those steers were fed diets containing 0.62 or 11.9 mg/kg Se. Steers from the high Se area had an initial plasma Se concentration of 0.56 μg/ml and steers from the moderate area had concentrations of 0.12 μg/ml. The serum levels from the moderate area are comparable to calves at initiation of the present experiment, but levels from the high Se areas are greater than any levels measured in the current experiment. Neither steers from the high Se area fed the 11.9 mg/kg diet or steers from the moderate area fed the 0.62 mg/kg diet showed a change in plasma Se concentrations. Steers from the moderate area fed the 11.9 mg/kg diet had increased plasma Se concentrations within two months to levels similar to steers previously exposed to high Se. Steers previously exposed to high Se levels and placed on the 0.62 mg/kg diet had plasma Se levels drop to concentrations that, at the end of the 105-day feeding period, were not different from calves originating from the moderate area and receiving the same diet.
The lowest level of Se fed by Hintze et al. (2002) was slightly higher than the levels fed in our Sel- Plex® treatment and higher than our Control. Calves fed the 0.62 mg/kg diet in the experiment of Hintze et al. (2002) had similar plasma Se concentrations to serum concentrations in our Sel-Plex® calves (0.13 μg/ml vs 0.11 μg/ml, respectively). Both values are in a range described as normal (~0.10 μg/ml; Maas, 1998). Awadeh et al. (1998) found similar results when growing calves were fed diets containing 0.41 mg/kg (basal) and basal + sodium selenite to 0.73 mg/kg Se and showed that serum Se increased with dietary Se supplementation (0.12 μg/ml vs 0.29 μg/ ml, respectively). Results from the above experiments, along with the changes during the initial points of the current experiment demonstrate serum Se concentrations closely following dietary levels of Se.
MEAT SELENIUM
Average meat Se concentration was 0.12 mg/kg higher for the Sel-Plex® treatment than Control (Figure 2) but was not affected by sex or a treatment by sex interaction. The Se content of the loin muscle, as collected in this experiment, has been determined to be representative of several of the edible muscle tissues including cuts from the round, sirloin, shoulder clod and ribeye muscles (Hintze et al., 2002).
While there was a 1.9-fold increase in the muscle Se concentration between the Control and Sel-Plex® treatments (Figure 2), both values are still lower than values obtained from calves in moderate or high Se areas of the United States and those fed diets consisting of feedstuffs raised in high Se regions.
They were also lower than sheep fed a corn-based diet with the addition 0.3 mg/kg inorganic Se (Podoll et al., 1992) or the upper level determined normal by the US Food and Drug Administration (FDA, 1997; 0.4 mg/kg). In the experiment by Hintze et al. (2002), steers purchased from high Se regions arrived with muscle biopsy Se concentrations of 2.10 mg/kg, while calves from moderate regions averaged 0.40 mg/kg. After those calves were fed diets containing 11.9 or 0.62 mg/kg of Se, steers from the high region and fed the 11.9 mg/kg diet had ribeye muscle Se concentrations of 2.06 mg/kg and the moderate area with 0.62 mg/kg diet contained 0.35 mg/kg. While analyzing ground beef from animals raised in various regions of the US, Finley et al. (1996) found that Se concentrations varied from 0.34 mg/kg in samples obtained from cattle raised in eastern North Dakota to 0.06 mg/kg for samples from cattle raised in southwestern Missouri. These experiments show that there is currently great variability in the Se content of beef reaching the retail market.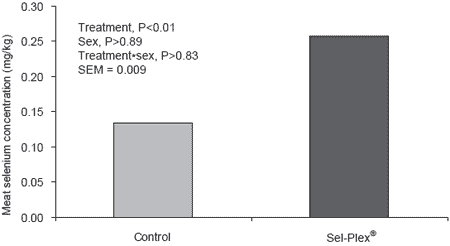
Figure 2. Meat selenium concentrations.
Hintze et al. (2002) suggested based on their data that 2.1 to 2.5 mg/kg could be the maximum amount of Se that can be incorporated into muscle. This would be consistent with findings that Se present in proteinaceous tissue is primarily selenomethionine and selenocysteine with the ratio of these forms depending on the feedstuffs consumed (Beilstein and Whanger, 1988). Because methionine and cysteine contents of muscle are not affected by Se addition to the diet, Se content of muscle could only increase to a relative level based on the proportions of methionine and cysteine containing Se. Therefore, differences in the incorporation rates of Se into muscle tissues due to form (inorganic vs organic) of dietary Se would be expected. Several publications have reported muscle incorporation comparisons between feeding of inorganic and organic Se sources and shown that Se from organic sources is more readily incorporated into tissues than inorganic sources of Se (Ullrey et al., 1977; Ammerman et al., 1980; Beilstein and Whanger, 1988; Ekholm et al., 1991). Despite incorporation rate differences between dietary forms, Hintze et al. (2002) noted there is high correlation between dietary and meat Se concentrations.
LIVER SELENIUM
Liver Se concentrations were affected by treatment, sex and a treatment × sex interaction (Figure 3).
Average liver Se concentrations for cattle on the Sel- Plex® treatment were 0.41 mg/kg higher than that of the Control treatment. Liver concentrations of Se are generally related to dietary Se concentration, but not as highly correlated as other tissues (Hintze et al., 2001). Podoll et al. (1992) reported that sheep fed a high corn diet with 0.3 mg/kg Se supplementation from selenate or selenite had similar liver concentrations (1.79 and 2.10 mg/kg, respectively).
Steers in the experiment of Hintze et al. (2002) had liver Se concentrations ranging from 0.89 to 5.94 mg/kg. Both of these experiments consisted of diets meeting the 0.3 mg/kg supplemental Se restriction, but have liver concentrations greater than the range of 0.1 to 1.2 mg/kg determined as normal by the FDA or those observed in this experiment.
The sex effect was a result of heifers within each treatment having higher liver Se concentrations than steers. The authors know of no other data that demonstrate an effect of sex on liver Se. While differences between sexes on the Control diet were small (0.02 mg/kg), heifers on the Sel-Plex® treatment had higher liver Se concentrations (0.19 mg/kg) than did steers on the same treatment, which led to the treatment × sex interaction. Because calves for this experiment were purchased through local market channels and most likely represent many sources and varied backgrounds, liver differences that occurred could be a carryover effect from prior management. Serum Se concentrations were not different at the initiation of the experiment, but they are noted to be more representative of Se status over a shorter period than liver tissues (Podoll et al., 1992).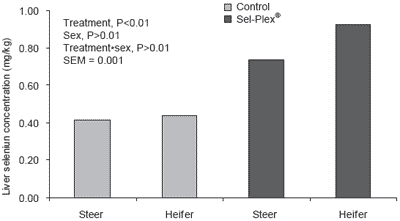
Figure 3. Liver selenium concentrations.
Differences in responses of liver tissues to supplementation may be due to an adaptation to prolonged high dietary Se concentrations. Hintze et al. (2002) determined that calves from a moderate Se background and fed a high Se diet had higher liver Se concentrations than steers from a high Se background and fed high Se diets. They proposed that this resulted from differences in the up-regulation of Se methylation by S-adenosylmethionine, which is necessary for Se excretion. Another potential explanation, demonstrated in the rat liver, may be that 83% of Se is associated with GSH-Px compared to relatively low levels of that form in muscle (Behne and Wolters, 1983).
Implications
Results of this experiment indicate that supplementing 0.30 mg/kg of selenium from selenium yeast in a feedlot diet adequate in selenium does not affect animal performance, but does increase serum and tissue selenium concentrations. However, the range of normal liver concentrations provided by the Food and Drug Administration is 0.1 to 1.2 mg/kg of selenium. Selenium in meat is noted to be one-third to one-fourth the levels in the liver. This results in normal meat Se levels ranging from 0.025 to 0.4 mg/kg. Calves fed Sel-Plex® selenium yeast at 0.3 mg/kg had average liver selenium concentrations of 0.83 mg/kg and meat samples averaged 0.29 mg/kg. Therefore, selenium residues in edible tissue from feedlot beef cattle supplemented with 0.3 mg/kg selenium from selenium yeast do not exceed allowable levels or other published levels.
Acknowledgements
This project was conducted with support from Alltech Inc. (Nicholasville, KY). We express our appreciation to Howard Blalock, Linda Miller, Del Harris, Malinda Burkhart, Eddie Jarboe, and R. Brent Pugh from the Animal Science Department along with Drs. John Hodges and Bobby Simpson and their staff from the University of Tennessee-Knoxville Experiment Station for their help in completing this project.
References
Ammerman, C.B., H.L. Chapman, G.W. Bouwman, J.P. Fontenot, C.P. Bagley, and A.L. Moxon. 1980. Effect of supplemental selenium for beef cows on the performance and tissue selenium concentrations of cows and suckling calves. J. Anim. Sci. 51:1381- 1386.
AOAC. 1990. Official Methods of Analysis (15th Ed.). Association of Official Analytical Chemists, Arlington, VA.
Awadeh, F.T., R.L. Kincaid and K.A. Johnson. 1998. Effect of level and source of dietary selenium on concentrations of thyroid hormones and immunoglobulins in beef cows and calves. J. Anim Sci. 76:1204-1215.
Behne, D., and W. Wolters. 1983. Distribution of selenium and glutathione peroxidase in the rat. J. Nutr. 113:456-461.
Beilstein, M.A., and P.D. Whanger. 1988. Glutathione-peroxidase activity and chemical forms of selenium in tissues of rats given selenite or selenomethionine. J. Inorgan. Biochem. 33:31-46.
Dargatz, D.A., and P.F. Ross. 1996. Blood selenium concentration in cows and heifers on 253 cow-calf operations in 18 states. J. Anim. Sci. 74:2891-2895.
Ekholm, P., P. Varo, P. Aspila, P. Koivistoinen and L. Syrjalaovist. 1991. Transport of feed selenium to different tissues of bulls. Br. J. Nutr. 66:49-55.
FDA. 1997. Food additives permitted in feed and drinking water of animals. Selenium. Fed. Regist. 62:44892-44894.
Finley, J., L. Matthys, T. Shuler and E. Korynta. 1996. Seleium content of foods purchased in North Dakota. Nurt. Res. 16:723:728.
Finley, J.W. 2000. Does selenium accumulation in meat confer a health benefit to the consumer? Proc. Am. Soc. Anim. Sci., 1999. Available at: http:// w ww. asas.org /JAS/symposia /proceedings /0911.pdf.
Gunter, S.A., P.A. Beck and J.M. Phillips. 2003. Effects of supplementary selenium source on the performance and blood measurements in beef cows and their calves. J. Anim. Sci. 81:856-64.
Hintze, K.J., G.P. Lardy, M.J. Marchello and J.W. Finley. 2001. Areas with high concentrations of selenium in the soil and forage produce beef with enhanced concentrations of selenium. J. Agric. Food Chem. 49:1062-1067.
Hintze, K.J., G.P. Lardy, M.J. Marchello and J.W. Finley. 2002. Selenium accumulation in beef: Effect of dietary selenium and geographical area of animal origin. J. Agric. Food Chem. 50:3938- 3942.
Kelly, M.P. and R.F. Power. 1995. Fractionation and identification of the major selenium containing compounds in selenized yeast. J. Dairy Sci. 78(Suppl.1):237(Abstr.).
Koh, T.S., and T.H. Benson. 1983. Critical reappraisal of fluorometric method for determination of selenium in biological materials. J. Assoc Off. Anal. Chem. 66:918-926.
Levander, O. 1983. Considerations in the design of selenium bioavailability studies. Fed. Proc. 42:1721-1725.
Lopez, P.L., R.L. Preston and W.H. Pfander. 1969. Whole-body retention, tissue distribution and excretion of selenium-75 after oral and intravenous administration in lambs fed varying selenium intakes. J. Nutr. 97:123-132.
Maas, J. 1998. Studies on selenium metabolism in cattle: Deficiency, supplementation, and environmental fate of supplemented selenium. STDA Sixth International Symposium.
Mason, A.C. and C.M. Weaver. 1986. Metabolism in rats of selenium from intrinsically and extrinsically labeled isolated soy protein. J. Nutr. 116: 1883-1888.
NRC. 1996. Nutrient Requirements of Beef Cattle (7th Ed.). National Academy Press, Washington, DC.
Nunn, C.L., H. A. Turner, and D.J. Drake. 1996. Effect of selenium boluses on weight gain and feed efficiency of wintering beef steers. J. Anim. Sci. 74(Suppl. 1):294(Abstr.).
Pehrson, B., K, Ortman, N. Madjid and U. Trafikowska. 1999. The influence of dietary selenium as selenium yeast or sodium selenite on the concentration of selenium in the milk of suckler cows and on the selenium status of their calves. J. Anim. Sci. 77:3371-3376.
Podoll, K.L., J.B. Bernard, D.E. Ullrey, S.R. DeBar, P.K. Ku and W.T. Magee. 1992. Dietary selenate versus selenite for cattle, sheep, and horses. J. Anim. Sci. 70:1965-1970.
Ullrey, D.E., P.S. Brady, P.A. Whetter, P.K. Ku, and W.T. Magee. 1977. Selenium supplementation of diets for sheep and beef cattle. J. Anim. Sci. 45:559-565.
Authors: C.J. RICHARDS and H.D. LOVEDAY
Animal Science Department, University of Tennessee, Knoxville, Tennessee, USA