Home
Search
Explore
Publish
Explore

Advertise on Engormix
Home
Publish
Search

Genetic variation within ABCE1 is associated with the chicken L blood system

Published: October 20, 2026
Source : Janet E. Fulton 1; Amy M. McCarron 1; Anna Wolc 1,2; Abigail Mullen 1; Catelyn Foerstner 1; Brandi Sparling 3; Wioleta Drobik-Czwarno 4; Robert L. Taylor Jr. 5*.
Summary

Author details:

1 Hy-Line International, Research and Development, PO Box 310, Dallas Center IA, USA; 2 Department of Animal Science, Iowa State University, Ames IA, USA; 3 College of Veterinary Medicine, Western University of Health Sciences, Pomona CA, USA; 4 Department of Animal Genetics and Conservation, Institute of Animal Science, Warsaw University of Life Sciences, Warsaw, Poland; 5 School of Agriculture and Food Systems, West Virginia University, Morgantown WV, USA.

Chicken nucleated red blood cells have thirteen alloantigen systems (A, B, C, D, E, H, I, J, K, L, N, P, R) that have been identified using specific alloantisera and molecular analyses. Until recently, the only alloantigen with its genetic region identified was the B system which is the chicken MHC. This study sought to identify the chromosomal location and the gene encoding chicken L alloantigen. Multiple unrelated genetic resources for which both DNA and serologically defined L alloantigen information were utilized including segregating pedigreed samples, elite commercially utilized egg production lines with known L system serological information, and genome sequence from selected research lines with known L system alleles. Genomic information was obtained from 600 K or 54 K SNP arrays, or low pass sequence information and utilized in GWAS to identify a candidate region. A strong GWAS peak was identified on chromosome 4 between 29.8 and 32 Mbp from multiple sample sets. The candidate gene identified was ABCE1, whose mammalian gene product is non-membrane bound. The specific mechanism by which the ABCE1 gene product in chickens impacts a serological determinant detected by hemagglutination remains unknown.

Keywords: L alloantigen ABCE1 Chicken L blood system

Introduction

Blood types or blood systems are due to inherited antigenic differences between individuals of the same species. These substances are found on the surface of red blood cells and may also be present on other tissues. Blood types were discovered by Landsteiner (1901) for which he received the Nobel Prize for Physiology or Medicine in 1930. There are 47 human blood group systems identified by the International Society of Blood Transfusion (2025), with the most widely recognized ones being the ABO and Rh blood systems. Not only do these antigenic differences play a fundamental role in immune recognition, but they are also responsible for blood transfusion reactions and organ transplantation rejections between individuals.
The discovery of chicken blood systems was first reported by Landsteiner and Miller (1924). Subsequently, more detailed research primarily by Elwood and Ruth Briles, and Doug Gilmour identified 13 blood systems, named alphabetically by their order of discovery (A, B, C, D, E, H, I, J, K, L, N, P and R) [Briles, 2001; Taylor et al., 2016]. The most well studied blood system is the B system, which was subsequently determined to be the chicken Major Histocompatibility Complex (MHC), a cluster of immune function related genes on chromosome 16 (Schierman and Nordskog, 1961; Miller and Taylor, 2016). Variation within the MHC has been shown to strongly influence resistance to multiple bacterial, parasitic, and viral pathogens (Miller and Taylor, 2016).
Variation within each blood system was originally identified by hemagglutination of red blood cells after mixing with alloantisera specific for each allele. This limited the application of blood system typing as it required the prior production of highly specific alloantisera and the availability of fresh blood cells. Alloantisera production was not always repeatable, and interlaboratory comparisons were needed to ensure identity between reagents (Fulton, 2020). With the development of the chicken genome sequence, and bioinformatics tools for DNA analysis, DNA-based detection methods to identify variation responsible for the blood type differences have been established. Because of the strong association between the B blood system and disease related traits, there was much interest in determining if other blood systems could impact multiple traits of interest, including production traits. DNA-based detection has proven to be invaluable in identifying B system (MHC) variation (Fulton et al., 2006, 2016). Recently, the genes encoding several of the chicken blood systems and their allele specific variants have been identified. Thus, DNA based detection methods for allelic variation are now available for five chicken blood systems; A, B, D, E and I (Fulton et al., 2022, 2023, 2024). Continued efforts are needed to identify the causative genes and their variants responsible for more of the chicken blood systems.
The chicken alloantigen system L was independently identified by Gilmour (1959, 1962) and Briles (1962). The system was initially designated F by Briles (1962) but after evaluation showed that the L and F systems were identical, the name was later changed to L as first in order of discovery. Two alleles were described for the L alloantigen which were expressed on erythrocytes and leukocytes (F. Kopti and W. E. Briles, Department of Biological Sciences, Northern Illinois University, DeKalb, IL 60115, unpublished data). Molecular weight of the L1 and L2 alleles was shown as around 35 to 40 and 70 to 80 kD in SDS-PAGE using allele specific alloantisera (Ameiss, 2002). Thus, the expected L alloantigen is predicted to have similar molecular weights.
Multiple studies have evaluated the effects of alloantigen L on physiological traits and disease responses. These studies have been facilitated because the system has only two alleles, designated as L1 and L2. Gilmour (1960) suggested a survival advantage for L system heterozygotes because that alloantigen was among three systems that retained segregation after eighteen generations of full-sib mating which began with an outbred population. Differential fertility and embryo survival effects were described by DeSilva (1965) who found increased fertility in matings using one L system heterozygous parent than in other matings having two homozygous parents.
The genetic background of the B complex genotype showed variable effects of the L system on Rous sarcoma growth. In B2 B5 and B5 B5 MHC backgrounds, the L system was the only alloantigen among eight non-B systems tested that affected tumor growth (LePage et al., 2000). Birds of the B2 B5 L1 L2 genotype had higher tumor growth, higher tumor profile indices (TPI) and higher mortality compared with the B2 B5 L1 L1 genotype. By contrast, B5 B5 chickens had higher mortality in the L1 L2 genotype than in the L1 L1 genotype. In a different experiment in which there was full segregation of the B and L alleles, the L system effect on Rous sarcoma was found in the most progressive MHC genotype, B5 B5 but the study also had a different genetic background and virus dose (Medarova et al., 2002). Genotype B5 B5 L1 L2 progeny had lower tumor scores, tumor profile indices (TPI) and mortality compared with B5 B5 L1 L1 and B5 B5 L2 L2 progeny.
Responses against Eimeria tenella were examined in birds segregating for multiple alloantigen systems. Only alloantigen L influenced the response to E. tenella infection. When the L system segregated in B2 B2 chickens, both the L1 L2 and L2 L2 genotypes had lower cecal lesion scores compared with the L1 L1 genotype. Eimeria tenella lesion scores in B2 B5 chickens were not affected by the L system (Taylor and Briles, 2000).
Antibody against two different antigen classes was influenced by the L alloantigen system. The B system alleles interacted with the L system alleles when tested for antibody response against the T cell-dependent antigen SRBC. Birds of the L1 L1 and L2 L2 genotypes that were also B5 B5 had higher primary antibody titers compared with the L1 L2 genotype (Medarova et al., 2003). No L system effect was observed on the secondary antibody titers in B5 B5 birds. On the other hand, genotypes L1 L2 and L2 L2 had higher total and mercaptoethanol (ME)-resistant titers against SRBC in the MHC B2 B5 context when compared with B2 B5 L1 L1 chickens (Medarova et al., 2003). Responses against T cell-independent antigen Brucella abortus (BA) were affected by L genotype in B2 B5 chickens. Both total and ME-resistant secondary BA titers were higher in L1 L1 chickens versus L2 L2 chickens (Medarova et al., 2003).
Selection for bursa of Fabricius size in New Hampshire (NH) chickens altered alloantigen L frequencies. The L2 allele frequencies were 0.02 in the large bursa line (LBL) and 0.54 in the small bursa line (SBL). The L1 allele was fixed in the founder population, LJD strain of NH chickens. The L allele frequency in the LJD was not determined but the L2 allele must have been present when selection began but was lost in later generations. In addition, the L2 allele frequency increased in selecting for small bursa size (Scott et al., 1988). In a different selection experiment, no effect of the L system on antibody response against SRBC could be determined as both the high antibody (HAS) or low antibody (LAS) response lines were fixed for the same L allele (Dunnington et al., 1984; Martin et al., 1990).
Monocyte phagocytosis was altered by L genotype independent of the B genotype. Birds of the L1 L1 genotype had higher phagocytosis compared with L1 L2 chickens with either the B19B19 or B19B21 type (Qureshi et al., 2000). Macrophage production of IL-6 showed an interaction between B and L systems. The amount of IL-6 produced by B19B19 macrophages was less in the L1 L1 type versus the L1 L2 genotype. The opposite B genotype macrophages, B19B21, had lower IL-6 production by L1 L2 cells than by L1 L1 cells (Qureshi et al., 2000). Neither macrophage nitrite nor IL-6 levels were affected by segregating L system alleles in B2 B2 or B2 B5 genotypes (M. A. Qureshi, Department of Poultry Science, N. C. State University, Raleigh, NC 27695, unpublished data).
The ABC (ATP synthase (ATP)-binding cassette transporters) gene superfamily consists of many genes involved with transportation of various substrates across both extra- and intra-cellular membranes (Dean et al., 2022). The gene family is widespread across species, from prokaryotes to humans. All ABC gene family members contain transmembrane domain sequences except for ABCE. The genes of the ABCE subfamily do not contain transmembrane domain sequences and thus are not expected to be present on the cell surface (Dean et al., 2022). ABCE1 is a highly conserved protein which inhibits the action of ribonuclease L, an important component for antiviral activity in mammals (Ramnani et al., 2021). It has been suggested that the ABCE1 protein may impact the role of ribosomes in regulation of gene expression (Navarro-Quiles et al., 2018). Little is known about the function of the ABCE1 protein in chickens.
The chicken L blood system warrants further research to understand the impact on multiple disease-related phenotypes found in various studies described above. DNA from multiple independent sets of samples for which the L blood system alleles had been determined serologically was available. These samples came from the NIU laboratory of Dr. Elwood Briles and from the DNA bank of the primary poultry breeding company, Hy-Line International, which included samples from numerous elite lines that had been serologically typed by Dr. Briles in the early 2000′s. Furthermore, DNA was available from laboratory lines whose serotypes had been previously defined. This study’s objective was to identify the chromosomal location and gene responsible for the chicken L blood system using the available unique genetic resources. Developing DNA-based techniques for L alloantigen haplotype identification facilitates further study of the effects in disease responses.

Materials and methods

Genetic material
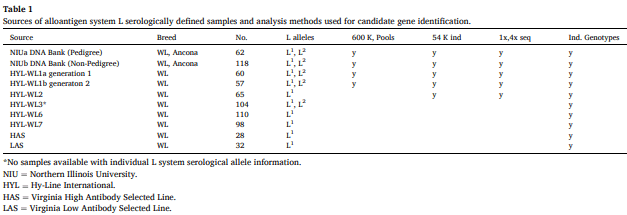
DNA with known L alleles were available from multiple sources as shown in Table 1. The NIU (Northern Illinois University) DNA bank consists of approximately 2500 samples for which at least one of the chicken blood system types as determined by alloantigen specific antisera is known. We had access to two independent sets of samples from NIU with L system allele information: NIUa samples were produced from pedigree matings designed to produce progeny with L1 and L2 segregation and NIUb samples were unrelated non-pedigree birds also with L system allele information. The HYL (Hy-Line) samples were from 5 elite White Leghorn (WL) lines used to produce commercial egg laying varieties. These lines had been typed by serology for the L system for multiple generations from 2003 to 2010 by Elwood Briles at NIU and DNA was available from these individuals. For line WL1 we had two generations of individual samples with known L system alleles. Line WL3 had been identified as segregating for L1 and L2 , but no individual serological data was available, and lines WL2, WL4 and WL5 had been identified as fixed for L1 . Additional resources included genomic sequence from three inbred lines; the UCD001 line is the inbred Red Jungle Fowl line from which the original genome reference was derived (no L allele information known), UCD003 and ADOL-15I5 are both previously reported as having L1 allele (Hala, 1987). The HAS/LAS lines are a pair of lines divergently selected for antibody response to sheep red blood cells. They were reported as L1 homozygous (Martin et al., 1986) A subsequent publication indicated the lines were L2 homozygotes (Martin et al., 1990), but this was determined to be an error (Paul Siegel, personal communication). Table 1 also includes the number of samples tested, the previously identified L system allele they contained, and the analysis method for which each set was utilized within this study.

DNA analyses

Five sets of DNA pools were produced from three different sources as indicated in Table 1; two sets from NIUa, one from NIUb and two from HYL-WL1 (two different generations). Each set consisted of three pools of equivalent amounts of DNA from individuals of known L allele status (L1 L1 , L1 L2 , or L2 L2 ) with the number of samples per pool ranging from 3 to 15.
The DNA pools were genotyped using the 600 K SNP Affymetrix Axiom array (ThermoFisher, Santa Clara, US). For all other samples genetic information was obtained from individual DNA samples. Individual genotype information was obtained from individuals whose L allele status had been previously determined.

GWAS analysis using 600K genotypes and DNA pools

Affymetrix Analysis Power tools were used to perform genotype calling, QC (removing SNPs with minor allele frequency below 0.1 and call rate below 90 %) and generating signal intensity files. Individual SNP intensity was used in a regression equation to explain the variation in allele counts of L blood group determined based on serology. The coefficient of determination and p value were calculated for each of the 580,961 SNPs left after the QC providing strength of evidence for SNPs segregating in a similar pattern as L blood group alleles.

GWAS analysis using 54K genotypes and individual DNA samples

Sample sets from NIUa, NIUb, HYL-WL1a, HYL-WL1b, and HYL-WL2 (Table 1) were individually genotyped with a 54 K Axiom chicken SNP array. More stringent QC criteria were applied for individual genotypes than for pools, with the minimum call rate required to be above 99 % and minor allele frequency of 0.05 resulting in 49,760 SNPs available for further analysis. With individual genotypes, a genome wide association analysis was performed coding L blood group allele as case for L1 L1 , and control for L1 L2 or L2 L2 . Association signal exceeding Bonferroni corrected negative log10 (p value) of 6.000512 was considered significant. GWAS results were presented as Manhattan plot using the qqman package in R (Turner, 2018).

Sequence analysis

To increase the GWAS resolution, for the samples with known individual L blood group alleles, 4x low pass sequence was obtained by sequencing each sample at 1x four times and combining the resulting bam files within line for the serologically determined phenotypes (L1 L1 , L1 L2 , or L2 L2 ). Association analysis based on SNP frequency difference between the merged files of shared L blood group was performed in PLINK (Purcell et al., 2007) within DNA sources (HYL-WL1 separately from NIUb DNA Bank). All DNA analyses were performed with the galGal6 reference genome, unless otherwise indicated.

Genetic profiling of distinct research lines

Genotypes at the earlier determined 40 fixed chr4 sites (galGal6/ NC_006091.5) were obtained either from Ensembl Gallus gallus Variation table (Release 106, April-2022 archive; accessed September 2025) [Dyer et al., 2025] for UCD001 (RJF; treated as homozygous REF; records present at 37/40 sites), and by targeted calling from aligned reads. For UCD003 and ADOL-15, public Illumina whole-genome and, where available, ATAC-seq reads (Kranis et al., 2013; Halstead et al., 2020; Rice et al., 2023) were aligned to galGal6 (BWA-MEM v0.7.17-r1188 or minimap2 v2.26-r1175) (Li, 2013, 2018); sorted, duplicate-marked, and indexed (SAMtools/HTSlib v1.19) (Danecek et al., 2012; Bonfield et al., 2021); technical replicates were tracked via read-group SM tags so they could be pooled per biological replicate, and sites were genotyped (BCFtools v1.19; mpileup -R, -q20, -Q13, –no-BAQ; call -m -A; norm -f) (Danecek et al., 2012) (GT/DP/AD/ADF/ADR) for concordance assessment.

Identification of candidate gene

Two criterion were used to indicate possible candidate genes responsible for the L system. First, the candidate gene product must be expressed on the cell surface as the L blood system variants are detected by hemagglutination of red blood cells. The second criterion is the presence of SNP variants that are predicted to change amino acids within the candidate gene product or potentially result in some other major change in gene product, such as a deletion, insertion, or an early protein termination. Sequence information from samples known to have different L alleles was examined to identify variants that fit with the expected L system segregation.

SNP selection and detection

SNP detection assays were developed for those genetic variants that were observed in genomic sequences of the HYL lines within the identified GWAS peak. SNP were chosen based on their segregation patterns observed in genome sequence of the HYL lines; they must segregate within the two lines known to be segregating for L alleles (WL1 and WL3) and be fixed in lines known to be fixed for L system alleles (WL2, WL6, WL7). Allele-specific detection used PACE® (PCR Allelic Competitive Extension) chemistry (3CR Bioscience Ltd., Harlow, UK), which requires one common, and two allele specific primers, with fluorescent detection of end point reads (Somyong et al., 2022). Initial SNP detection focused on the SNP predicted to alter an amino acid, or other physical change for a gene product. Additional SNP were added, regardless of their predicted impact to aid in identification of gene or gene region that correlated with the L phenotype.

Splice site variant analysis

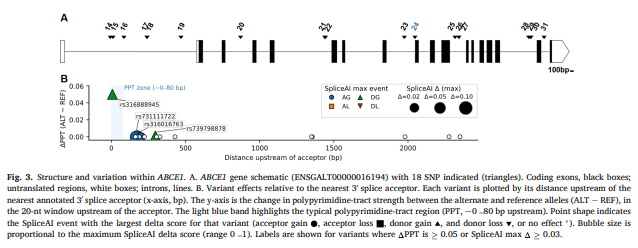
The gene locus with perfect concordance between cohorts was analyzed and retrieved from the online UCSC Genome Browser. The gene structure (untranslated regions, exons, and introns) was visualized using the Exon-Intron Graphic Maker (wormweb.org). The primary predictor of splice impact was SpliceAI v1.3.1 (±200 bp context; mask off) (Jaganathan et al., 2019). As orthogonal checks, we examined for canonical and cryptic site propensity with ASSP (Wang and Marín, 2006), splice site strength using MaxEntScan (Yeo and Burge, 2004), distance to the nearest annotated 3′ acceptor, a polypyrimidine-tract score in the − 80…0 bp window (PPT = (C + T)/20; ΔPPT = ALT–REF), RBPmap RNA-binding motifs (v1.2, ± 100 bp) (Paz et al., 2014), and local secondary structure with RNAfold (± 50 bp region) (Gruber et al., 2008).

Results and discussion

GWAS

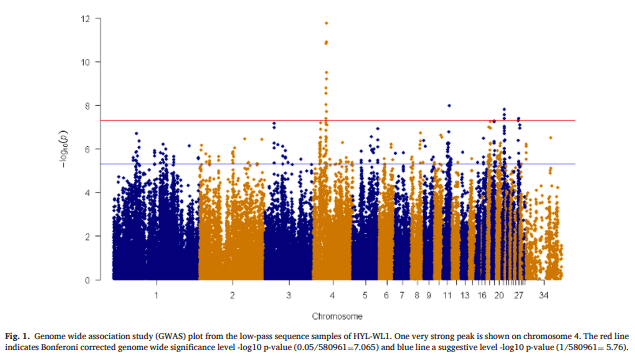
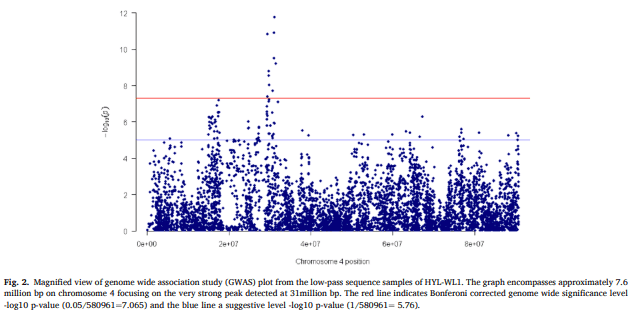
The GWAS analysis utilizing 600 K genotypes of DNA pools from the NIUa pedigree, NIUb non-pedigree and WL1 sources showed one very strong peak on chr 4, with the most significant SNP (p < 6.31E-61), being rs314182912 (bp 30,971,816), located within intron 1 of the gene ANAPC10. The GWAS analyses with 54 K genotypes and genome sequence information showed the same regions on chr 4 as found for the pools analysis. Zoom in on this region shows that the peak is relatively narrow with highest point at about 31mbp, which is consistent with the 600 K SNP-based GWAS mentioned previously. The top identified SNP was rs14445484 (bp 30,810,164) which is intergenic, and upstream of ANAPC10. The GWAS analysis was also done utilizing the low pass sequence information from HYL-WL1 and showed the same genomic peak on chromosome 4, centered at about 31 M bp (see Figs. 1 and 2).

Candidate genes

Within the vicinity of the peak region identified by the GWAS (chr 4 from 29.77Mbp-31.93 Mbp), four genes fit the cell membrane category: RNF150, HHIP, SLC10A7, and EDNRA. Sequence information for WL1 and WL3 lines known to be segregating for L system alleles was examined followed by identification and genotyping of segregating SNP variants. The genotype segregation patterns of SNP within these four genes did not fit the known L system allele segregation for both sample sets, thus eliminating them as candidates for the L system. This led to close examination of SNP segregation patterns of other genes in the region, and we removed the restriction of membrane bound to include other possible candidates. We also expanded the examination both up and downstream of the initial region to include other potential candidate genes.
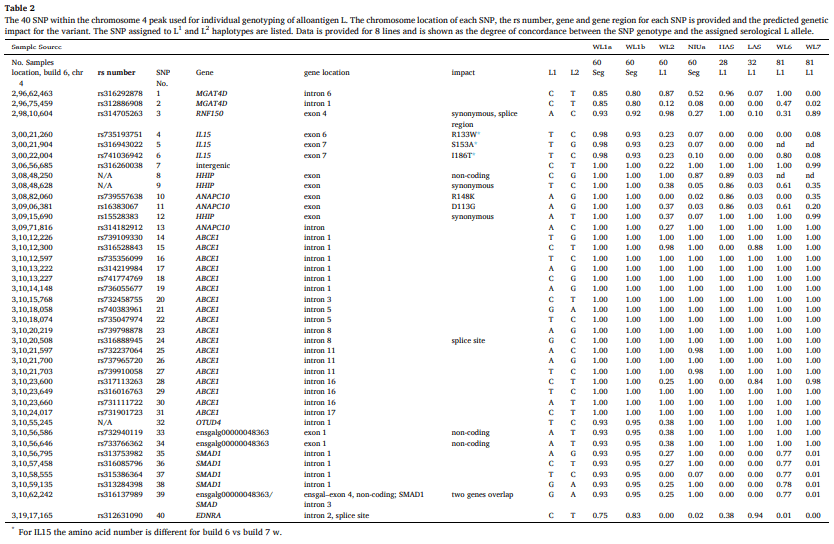
Table 2 summarizes the SNP typing performed across the GWAS identified region for Chr 4. Genotypes were obtained for 40 SNP located from 29,662,463-31,917,165 bp for individual samples from 8 sources. The genome location for each SNP is provided, based on build 6, as is the NCBI assigned rs number, when available. The gene location and the predicted SNP impact on the gene product is also given. The values provided in the table are the degree of concordance between the SNP genotype and the assigned serological genotype within each genetic source. Thus, a value of 1.00 indicates that 100 % of the samples had the SNP associated with their serologically defined allele, and any value less than 1.00 indicates less than perfect agreement between serological and SNP information
Close examination of the SNP concordance for both generations of line WL1(a and b) shows that 100 % concordance between SNP and L system serology, is not found until SNP 7, which is upstream of HHIP, and this perfect agreement is maintained until SNP 32, (in OTUD4) where it drops to 93-95 %. This suggests that the candidate gene for the L system is located between SNP 7 and SNP32. Examination of the SNP and L system concordance for the 6 other lines, shows the same trends as in line WL1, but the start and end locations of perfect agreement are slightly different in different lines. Overall, the region of concordance consistent for all lines occurs between SNP 14 and SNP 31. This SNP range encompasses the gene ABCE1, suggesting that this is the candidate gene for the chicken L blood system.
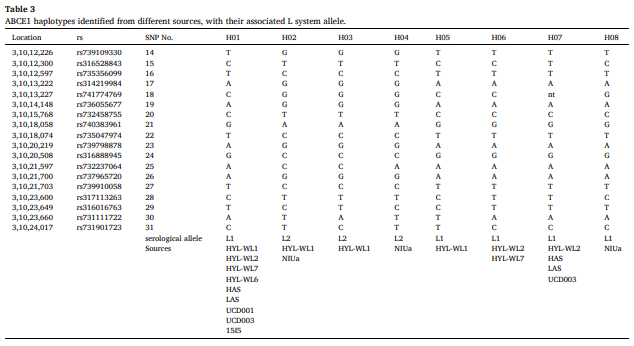
There are several instances within this set of SNP in which the concordance is not 100 %. This is presumed to be due to mutation of the SNP, that does not impact its’ L system allele. Utilizing individual genotype information, we were able to identify multiple ABCE1 haplotypes based on the 18 SNP (SNP 14-31) genotyped within the gene. These are shown in Table 3. Haplotype names were assigned to keep consistency with the serologically defined alleles where possible, Thus, ABCE1-H01 and ABCE1-H02 are assigned to the L1 and L2 serological allele, respectively. These are the most commonly identified haplotypes, being found in multiple sources. The other haplotypes were assigned numbers in order of detection. We found a total of eight haplotypes, five defining L1 and 3 defining L2 . The identification of variation within non-causal SNP has been observed in other serologically and DNA defined chicken blood system haplotypes (Fulton et al., 2022; 2023; 2024). Close examination of the eight haplotypes shows that of the 18 SNP, 11 are consistently different between L1 and L2 serological alleles, including SNP 24 which is the splice site variant.
We also examined the genotype information for the 40 SNP described utilizing genome sequences available from three laboratory lines; UCD001, UCD003, and ADOL-15I5. Targeted genotyping across the 40- site chromosome 4 candidate region SNP set supports L1 serological identity as previously reported for these research lines (Crittenden et al., 1993; Morrow and Abplanalp, 1977). UCD001 (RJF, galGal6 donor) carried the reference allele at all sites with Ensembl records (37/37 callable positions), matching the L1 haplotype (ABCE1-H01). For line UCD003, five of six individuals were 40/40 concordant with L1 (ABCE1-H07) with the remaining bird being heterozygous at nine sites located upstream or downstream of ABCE1, while all ABCE1-internal sites matched ABCE1-H01. For line 15 the pooled Illumina dataset showed seven upstream heterozygous sites, whereas the single-bird dataset was 40/40 concordant (ABCE1-H01). All departures from perfect concordance occurred outside ABCE1 gene, consistent with a short, conserved L1 block spanning ABCE1 and limited recombination at its boundaries, motivating closer inspection of the L-haplotype interval.
We have provided compelling evidence that the variation responsible for the L system lies within the genomic region encompassing the ABCE1 gene, as evidenced by the consistent concordance between SNP genotype and serological L allele observed only for this gene. There were two notable exceptions. With the NIUa sample set, we observed two individuals out of 62 that did not show agreement with the ABCE1 typing (3.2 %). These samples did contain the L1 and/or L2 DNA based alleles, but did not match their serological identification. This suggests imperfect detection of the L2 allele by the alloantisera used. This low level of serological typing errors has been found for other chicken blood systems (Fulton et al., 2022; 2023; 2024). These two samples were removed from further analysis.
The second exception was the NIUb non-pedigree set which failed to fit the predicted SNP pattern for their assigned L system alleles. This set consisted of 118 samples of which 71 were serologically defined as L1 L1 , whereas 38 and 9 were defined as L1 L2 or L2 L2 , respectively. All samples genotyped as being homozygous for L for the ABCE1 SNP. This sample set (NIUb) was then used alone in GWAS analysis with 54 K SNP data where it failed to show any GWAS signal, in contrast to all other subsets of samples (i.e., 54 K with WL1 only; 54 K with NIUa only) which provided the same GWAS signal as the full data set. This outcome was interpreted as due to errors in the serological phenotyping for the NIUb sample set, specifically the detection of the L2 allele.
The intron–exon structure of the ABCE1 gene, and the relative location of the 18 genotyped SNP within the gene is shown in Fig. 3A. All SNP tested were intronic. While there were non-synonymous SNP and other synonymous SNP identified within ABCE1 based on genome sequence information, these were fixed in both lines known to be segregating (WL1 and WL3), and thus not involved with the segregation of the L system alleles in those lines. One variant, SNP 24 (rs316888945), occurs 8 bases upstream of exon 8, potentially impacting exons 8 and beyond (Fig. 3A), and was therefore considered for predictive variant impact. Computational scores at this position were modest but directionally consistent with slightly increased 3′-acceptor recognition (SpliceAI acceptor-gain Δ = 0.03; MaxEnt 3′-acceptor 4.94 → 6.22, Δ = +1.28 [+25.9 % vs REF]; ΔPPT = +0.05; RNAfold: no major local structural change), whereas the remaining intronic SNPs were generally farther from acceptors (Fig. 3B). The program ASSP also flagged a cryptic splice site at SNP 24. Motif scanning indicated the reference allele overlaps CUGBP Elav-Like Family Member 6 (CELF6) RNA binding protein and Heterogeneous Nuclear RiboNucleoProtein A1 Like 2 (HNRNPA1L2) binding motifs, while the G-to-C change introduces a polypyrimidine tract binding protein 3 (PTBP3 also referred to as PTB3) site. With PTBP3’s known role as a silencing repressor (Xue et al., 2009), this configuration could bias exon recognition. We note an ABCE1 isoform lacking exons 9 –11 is annotated in GenBank (AM049247.1), but did not assess isoform usage here. Taken together, in-silico evidence singles out SNP 24 as a candidate for impacting the ABCE1 gene product, though any effect is expected to be subtle and remains to be experimentally validated.
The genotype data presented in Table 2 shows a clear relationship between variation within the ABCE1 gene and the chicken L blood system alleles, with perfect concordance seen for 8 different lines within ABCE1 only. The estimated molecular weight of ABCE1 is 67 kDa which is nominally consistent with the ~70–80 kDa band reported by Ameiss (2002). However, blood system antigens must be present on the cell surface to react with antisera and cause hemagglutination. ABCE genes do not encode transmembrane domains and thus are not expressed on the cell surface. The ABCE1 gene of the chicken is confirmed to lack these domains, which then raises the question as to whether this is indeed the correct gene, or does it act in some uncommon manner to impact the gene or protein involved with the L system antigenic differences. With that in mind, we next consider how specific splice or regulatory variants within the ABCE1 interval could mechanistically impact the serologically defined L1 and L2 differences.
The observed intron/exon splice site is a logical differentiator for the two L system alleles, with the reference allele being associated with the L1 allele, and the variant being associated with the L2 allele. However, there are other SNP within the ABCE1 gene that show complete concordance with the L system allele, and thus also have potential as being causative. Intronic or synonymous SNP within an exon have also been shown to impact gene expression or protein folding. There are multiple examples in the literature of synonymous SNP that can impact mRNA structure, protein conformation, and alter gene expression (Sauna and Kimchi-Sarfaty, 2011; Duan et al., 2003; Bampi et al., 2002; Buhr et al., 2016). Perhaps the most intriguing idea is that synonymous SNP within this region could be a long-distance cis-regulatory element that impacts some other gene that is more distant. The phenomenon is observed in poultry resulting in the chicken polydactyly phenotype. A single SNP variant within an intron of the LMBR1 gene regulates the expression of the SHH (Sonic hedgehog), which is located 1Mb downstream of LMBR1. This mutation induces ectopic expression of SHH, ultimately resulting in the development of additional digits (Duan et al., 2003). This same relationship between intronic variants and distant gene expression resulting in ectopic expression of SHH is observed in cats, mice and humans, resulting in polydactyl phenotypes (Lettice et al., 2017, 2008).
This type of long-distance regulatory effect on another gene could explain why variation within the non-membrane-bound ABCE1 gene product could impact another protein to produce the serological differences, with the causative variant being located within the ABCE1 gene. The ABCE gene family is well conserved across multiple phyla, but little is known of the function of the ABCE protein in the chicken. In human and mouse cells, the oligoadenylate synthetase/ribonuclease L (OAS/RNase L) pathway is activated by interferon following viral infection. Then, RNase L, activated through the pathway, has antiviral effects. One inhibitor of the RNase L antiviral effect is ABCE1 (Ramnani et al., 2021). If the ABCE function is similar in chickens, the gene product and thereby alloantigen L, may alter a pathological process through regulating RNase L activity and modifying viral infections.
Based on the co-segregation of L blood alleles as determined by serology and SNPs in the ABCE1 gene, we suggest the ABCE1 gene as a candidate causative gene for variation in L blood system. The use of multiple lines with L system serological information tightened the causative variant to a single gene. The encoded gene product is not reported as expressed on the cell membrane, which is a requirement for hemagglutination assay detection, thus the exact mechanism of action remains unknown and requires further investigation.

CRediT authorship contribution statement

Janet E. Fulton: Writing – review & editing, Writing – original draft, Supervision, Resources, Methodology, Conceptualization. Amy M. McCarron: Validation, Supervision, Methodology. Anna Wolc: Writing – review & editing, Validation, Formal analysis, Data curation. Abigail Mullen: Methodology, Formal analysis. Catelyn Foerstner: Validation, Methodology. Brandi Sparling: Visualization, Formal analysis. Wioleta Drobik-Czwarno: Validation, Formal analysis. Robert L. Taylor Jr.: Writing – review & editing, Writing – original draft, Supervision, Resources, Funding acquisition, Conceptualization.

Disclosures

We (Janet E. Fulton, Amy M. McCarron, Anna Wolc, Abigail Mullen, Catelyn Foerstner, Brandi Sparling, Wioleta Drobik-Czwarno, and Robert L. Taylor Jr.) authors of the manuscript Genetic variation within ABCE1 is associated with the chicken L blood system report no conflict of interest in the work reported herein.

Acknowledgments

This work was partially supported by the National Institute of Food and Agriculture, U.S. Department of Agriculture, Hatch/Multistate project NE2334 The genetic bases for resistance and immunity to avian diseases under West Virginia Agricultural and Forestry Experiment Station accession number WVA00776. Additional support was provided by the Elwood and Ruth Briles Alloantigen Fund at West Virginia University.
    
This article was originally published in Poultry Science 104 (2025) 106027. https://doi.org/10.1016/j.psj.2025.106027. This is an Open Access article under the CC BY-NC-ND license (http://creativecommons.org/licenses/by-nc-nd/4.0/).

Ameiss, K. A. (2002). Characterization of the alloantigens C, D and L of the chicken [Graduate thesis, Northern Illinois University]. Huskie Commons. https://huskiecommons.lib.niu.edu/allgraduate-thesesdissertations/1748

Bampi, G. B., Ramalho, A. S., Santos, L. A., Wagner, J., Dupont, L., Cuppens, H., De Boeck, K., & Ignatova, Z. (2021). Effect of synonymous single-nucleotide polymorphisms on an atypical cystic fibrosis clinical presentation. Life, 11(1), 14.

Bonfield, J. K., Marshall, J., Danecek, P., Li, H., Ohan, V., Whitwham, A., Keane, T., & Davies, R. M. (2021). HTSlib: A C library for reading/writing high-throughput sequencing data. GigaScience, 10, giab007.

Briles, W. E. (1962). Additional blood group systems in the chicken. Annals of the New York Academy of Sciences, 97, 173–183.

Briles, W. E. (2001). Non-major histocompatibility complex alloantigen genes affecting immunity. Poultry Science, 83, 606–610.

Buhr, F., Jha, S., Thommen, M., Mittelstaet, J., Kutz, F., Schwalbe, H., Rodnina, M. V., & Komar, A. A. (2016). Synonymous codons direct cotranslational folding toward different protein conformations. Molecular Cell, 61, 341–351.

Crittenden, L. B., Provencher, L., Santangelo, L., Levin, I., Abplanalp, H., Briles, R. W., Briles, W. E., & Dodgson, J. B. (1993). Characterization of a Red Jungle Fowl by White Leghorn backcross reference population for molecular mapping of the chicken genome. Poultry Science, 72, 334–348.

Danecek, P., Bonfield, J. K., Liddle, J., Marshall, J., Ohan, V., Pollard, M. O., Whitwham, A., Keane, T., McCarthy, S. A., Davies, R. M., & Li, H. (2021). Twelve years of SAMtools and BCFtools. GigaScience, 10, giab008.

Dean, M., Moitra, K., & Allikmets, R. (2022). The human ATP-binding cassette (ABC) transporter superfamily. Human Mutation, 43, 1162–1182.

DeSilva, P. L. (1965). Heterozygosity at red cell antigen locus L and fertility in chickens. Genetics, 51, 41–48.

Duan, J., Wainwright, M. S., Comeron, J. M., Saitou, N., Sanders, A. R., Gelernter, J., & Gejman, P. V. (2003). Synonymous mutations in the human dopamine receptor D2 (DRD2) affect mRNA stability and synthesis of the receptor. Human Molecular Genetics, 12, 205–216.

Dunnington, E. A., Briles, R. W., Briles, W. E., Gross, W. B., & Siegel, P. B. (1984). Allelic frequencies in eight alloantigen systems of chickens selected for high and low antibody response to sheep red blood cells. Poultry Science, 63, 1470–1472.

Dyer, S. C., Austine-Orimoloye, O., Azov, A. G., Barba, M., Barnes, I., Barrera-Enriquez, V. P., Becker, A., Bennett, R., Beracochea, M., Berry, A., Bhai, J., Bhurji, S. K., Boddu, S., Branco Lins, P. R., Brooks, L., Ramaraju, S. B., Campbell, L. I., Martinez, M. C., Charkhchi, M., Cortes, L. A., Davidson, C., Denni, S., Dodiya, K., Donaldson, S., El Houdaigui, B., El Naboulsi, T., Falola, O., Fatima, R., Genez, T., Martinez, J. G., Gurbich, T., Hardy, M., Hollis, Z., Hunt, T., Kay, M., Kaykala, V., Lemos, D., Lodha, D., Mathlouthi, N., Merino, G. A., Merritt, R., Mirabueno, L. P., Mushtaq, A., Hossain, S. N., Pérez-Silva, J. G., Perry, M., Piližota, I., Poppleton, D., Prosovetskaia, I., Raj, S., Salam, A. I. A., Saraf, S., Saraiva-Agostinho, N., Sinha, S., Sipos, B., Sitnik, V., Steed, E., Suner, M. M., Surapaneni, L., Sutinen, K., Tricomi, F. F., Tsang, I., Urbina-Gomez, D., Veidenberg, A., Walsh, T. A., Willhoft, N. L., Allen, J., Alvarez-Jarreta, J., Chakiachvili, M., Cheema, J., da Rocha, J. B., De Silva, N. H., Giorgetti, S., Haggerty, L., Ilsley, G. R., Keatley, J., Loveland, J. E., Moore, B., Mudge, J. M., Naamati, G., Tate, J., Trevanion, S. J., Winterbottom, A., Flint, B., Frankish, A., Hunt, S. E., Finn, R. D., Freeberg, M. A., Harrison, P. W., Martin, F. J., & Yates, Y. D. (2025). Ensembl 2025. Nucleic Acids Research, 53(D1), D948–D957.

Fulton, J. E. (2020). Advances in methodologies for detecting MHC-B variability in chickens. Poultry Science, 99, 1267–1274.

Fulton, J. E., Juul-Madsen, H. R., Ashwell, C. M., McCarron, A. M., Arthur, J. A., O’Sullivan, N. P., & Taylor, R. L., Jr. (2006). Molecular genotype identification of the Gallus gallus major histocompatibility complex. Immunogenetics, 58, 407–421.

Fulton, J. E., McCarron, A. M., Lund, A. R., Pinegar, K. N., Wolc, A., Chazara, O., Bed’Hom, B., Berres, M. E., & Miller, M. M. (2016). A high-density SNP panel reveals extensive diversity, frequent recombination and multiple recombination hotspots within the chicken major histocompatibility complex B region between BG2 and CD1A1. Genetics Selection Evolution, 48, 1.

Fulton, J. E., McCarron, A. M., Lund, A. R., Drobik-Czwarno, W., Mullen, A., Wolc, A., Szadkowska, J., Schmidt, C. J., & Taylor, R. L., Jr. (2024). The RHCE gene encodes the chicken blood system I. Genetics Selection Evolution, 56, 47.

Fulton, J. E., Drobik-Czwarno, W., Wolc, A., McCarron, A. M., Lund, A. R., Schmidt, C. J., & Taylor, R. L., Jr. (2023). CD99 and the chicken alloantigen D blood system. Genes, 14, 402.

Fulton, J. E., Drobik-Czwarno, W., Wolc, A., McCarron, A. M., Lund, A. R., Schmidt, C. J., & Taylor, R. L., Jr. (2022). The chicken A and E blood group systems are due to variation in proteins encoded by genes within the chicken RCA syntenic gene region. The Journal of Immunology, 209, 1–10.

Gilmour, D. G. (1959). Segregation of genes determining red cell antigens at high levels of inbreeding in chickens. Genetics, 44, 14–33.

Gilmour, D. G. (1960). Blood groups in chickens. British Poultry Science, 1, 75–100.

Gilmour, D. G. (1962). Current status of blood groups in poultry. Annals of the New York Academy of Sciences, 97(1), 166–172.

Gruber, A. R., Lorenz, R., Bernhart, S. H., Neuböck, R., & Hofacker, I. L. (2008). The Vienna RNA websuite. Nucleic Acids Research, 36(Web Server issue), W70–W74.

Hala, K. (1987). Inbred lines of avian species. In A. Toivanen & P. Toivanen (Eds.), Avian immunology: Basis and practice (Vol. 1, pp. 85–89). CRC Press.

Halstead, M. M., Kern, C., Saelao, P., Chanthavixay, G., Wang, Y., Delany, M. E., Zhou, H., & Ross, P. J. (2020). Systematic alteration of ATAC-seq for profiling open chromatin in cryopreserved nuclei preparations from livestock tissues. Scientific Reports, 10, 5230.

International Society of Blood Transfusion. (2025). Red Cell Immunogenetics and Blood Group Terminology (RCIBGT). https://isbtweb.org/isbt-working-parties/rcibgt.html

Jaganathan, K., Kyriazopoulou-Panagiotopoulou, S., McRae, J. F., Darbandi, S. F., Knowles, D., Li, Y. I., Kosmicki, J. A., Arbelaez, J., Cui, W., Schwartz, G. B., Chow, E. D., Kanterakis, E., Gao, H., Kia, A., Batzoglou, S., Sanders, S. J., Farh, K. K., & colleagues. (2019). Predicting splicing from primary sequence with deep learning. Cell, 176, 535–548.

Kranis, A., Gheyas, A. A., Boschiero, C., Turner, F., Yu, L., Smith, S., Talbot, R., Pirani, A., Brew, F., Kaiser, P., Hocking, P. M., Fife, M., Salmon, N., Fulton, J., Strom, T. M., Haberer, G., Weigend, S., Preisinger, R., Gholami, M., Qanbari, S., Simianer, H., Watson, K. A., Woolliams, J. A., & Burt, D. W. (2013). Development of a high density 600K SNP genotyping array for chicken. BMC Genomics, 14, 59.

Landsteiner, K. (1901). Ueber agglutinationser-scheinungen normalen menschlichen blutes. Wiener Klinische Wochenschrift, 14, 1132–1134.

Landsteiner, K., & Miller, C. P., Jr. (1924). On individual differences of the blood of chickens and ducks. Proceedings of the Society for Experimental Biology and Medicine, 22, 100–102.

LePage, K. T., Briles, W. E., Kopti, F., & Taylor, R. L., Jr. (2000). Nonmajor histocompatibility complex alloantigen effects on the fate of Rous sarcomas. Poultry Science, 79, 343–348.

Lettice, L. A., Devenney, P., DeAngelis, C., & Hill, R. E. (2017). The conserved sonic hedgehog limb enhancer consists of discrete functional elements that regulate precise spatial expression. Cell Reports, 20, 1396–1408.

Lettice, L. A., Hill, A. E., Devenney, P. S., & Hill, R. E. (2008). Point mutations in a distant sonic hedgehog cis-regulator generate a variable regulatory output responsible for preaxial polydactyly. Human Molecular Genetics, 17, 978–985.

Li, H. (2013). Aligning sequence reads, clone sequences and assembly contigs with BWA-MEM. arXiv. https://arxiv.org/abs/1303.3997

Li, H. (2018). Minimap2: Pairwise alignment for nucleotide sequences. Bioinformatics, 34, 3094–3100.

Martin, A., Gross, W. B., Dunnington, E. A., Briles, R. W., Briles, W. E., & Siegel, P. B. (1986). Resistance to natural and controlled exposures to Eimeria tenella: Genetic variation and alloantigen systems. Poultry Science, 65, 1847–1852.

Martin, A., Dunnington, E. A., Gross, W. B., Briles, W. E., Briles, R. W., & Siegel, P. B. (1990). Production traits and alloantigen systems in lines of chickens selected for high or low antibody responses to sheep erythrocytes. Poultry Science, 69, 871–878.

Medarova, Z., Briles, W. E., & Taylor, R. L., Jr. (2002). Alloantigen system L affects the outcome of Rous sarcomas. Experimental Biology and Medicine, 227, 158–163.

Medarova, Z., Briles, W. E., & Taylor, R. L., Jr. (2003). Alloantigen system L affects antibody responses. International Journal of Poultry Science, 2, 23–27.

Miller, M. M., & Taylor, R. L., Jr. (2016). Brief review of the chicken major histocompatibility complex: The genes, their distribution on chromosome 16, and their contributions to disease resistance. Poultry Science, 95, 375–392.

Morrow, P. E., & Abplanalp, H. (1977). Syngeneic inbred lines of chickens and their use in immunogenetics. In A. A. Benedict (Ed.), Avian immunology (Advances in Experimental Medicine and Biology, Vol. 88, pp. 319–327). Plenum Press.

Navarro-Quiles, C., Mateo-Bonmatí, E., & Micol, J. L. (2018). ABCE proteins: From molecules to development. Frontiers in Plant Science, 9, 1125.

Paz, I., Kosti, I., Ares, M., Jr., Cline, M., & Mandel-Gutfreund, Y. (2014). RBPmap: A web server for mapping binding sites of RNA-binding proteins. Nucleic Acids Research, 42(Web Server issue), W361–W367.

Purcell, S., Neale, B., Todd-Brown, K., Thomas, L., Ferreira, M. A., Bender, D., Maller, J., Sklar, P., de Bakker, P. I., Daly, M. J., & Sham, P. C. (2007). PLINK: A tool set for whole-genome association and population-based linkage analyses. The American Journal of Human Genetics, 81, 559–575.

Qureshi, M. A., Ali, R. A., Thomas, L. N., Baloch, R. N., & Briles, W. E. (2000). Alloantigen systems L and P influence phagocytic function independent of the major histocompatibility complex (B) in chickens. Poultry Science, 79, 1271–1275.

Ramnani, B., Manivannan, P., Jaggernauth, S., & Malathi, K. (2021). ABCE1 regulates RNase L-induced autophagy during viral infections. Viruses, 13, 315.

Rice, E. S., Alberdi, A., Alfieri, J., Athrey, G., Balacco, J. R., Bardou, P., Blackmon, H., Charles, M., Cheng, H. H., Fedrigo, O., Fiddaman, S. R., Formenti, G., Frantz, L. A. F., Gilbert, M. T. P., Hearn, C. J., Jarvis, E. D., Klopp, C., Marcos, S., Mason, A. S., Velez-Irizarry, D., Xu, L., & Warren, W. C. (2023). A pangenome graph reference of 30 chicken genomes allows genotyping of large and complex structural variants. BMC Biology, 21, 267.

Sauna, Z. E., & Kimchi-Sarfaty, C. (2011). Understanding the contribution of synonymous mutations to human disease. Nature Reviews Genetics, 12, 683–691.

Schierman, L. W., & Nordskog, A. W. (1961). Relationship of blood type to histocompatibility in chickens. Science, 134, 1008–1009.

Scott, T. R., Oduho, G. W., Glick, B., Hagan, F., Briles, W. E., & Yamamoto, Y. (1988). Erythrocyte alloantigen diversity and some immunological effects of the B system in related New Hampshire strains. Poultry Science, 67, 1210–1217.

Somyong, S., Phetchawang, P., Bihi, A. K., Sonthirod, C., Kongkachana, W., Sangsrakru, D., Jomchai, N., Pootakham, W., & Tangphatsornruang, S. (2022). A SNP variation in an expansin (EgExp4) gene affects height in oil palm. PeerJ, 10, e13046.

Taylor, R. L., Jr., & Briles, W. E. (2000). Non-MHC alloantigen effects on resistance and susceptibility to Eimeria tenella. Poultry Science, 79(Suppl. 1), 39.

Taylor, R. L., Jr., Medarova, Z., & Briles, W. E. (2016). Immune effects of chicken non-MHC alloantigens. Poultry Science, 95, 447–457.

Turner, S. (2018). qqman: An R package for visualizing GWAS results using Q-Q and Manhattan plots. Journal of Open Source Software. https://doi.org/10.21105/joss.00731

Wang, M., & Marín, A. (2006). Characterization and prediction of alternative splice sites. Gene, 366, 219–227.

Yeo, G., & Burge, C. B. (2004). Maximum entropy modeling of short sequence motifs with applications to RNA splicing signals. Journal of Computational Biology, 11, 377–394.

Xue, Y., Zhou, Y., Wu, T., Zhu, T., Ji, X., Kwon, Y. S., Zhang, C., Yeo, G., Black, D. L., Sun, H., Fu, X. D., & Zhang, Y. (2009). Genome-wide analysis of PTB-RNA interactions reveals a strategy used by the general splicing repressor to modulate exon inclusion or skipping. Molecular Cell, 36, 996–1006.


Related topics:
Authors:
Janet Fulton
Anna Wolc
Recommend
Comment
Share
Profile picture
Would you like to discuss another topic? Create a new post to engage with experts in the community.
Featured users in Poultry Industry
Dr. Algis Martínez
Dr. Algis Martínez
DVM, Diplomado ACPV - Poultry Veterinarian North America Cargill
United States
Shivaram Rao
Shivaram Rao
PhD Director Principal de Nutrición y Servicios Técnicos de Pilgrim’s Pride Corporation
United States
Carolina Hall
Carolina Hall
United States