Do non-GMO enzymes work as well as GMO sources? A comparison of phytase sources in low phosphorus diets fed to layers
Introduction: evolution of practical phytase use
The beneficial effects of phytase on the availability of phytate phosphorus have been known since the 1960s (Nelson, 1967) with considerable research having been undertaken and reported in the intervening years. Phytases have been available for many years; but not until the environmental impact of agriculture and urban sprawl became a political issue was there pressure to develop and utilize phytase in livestock feeds. The first sign of things to come was the elimination of phosphorus-based laundry detergents. This had a dramatically beneficial effect on the ecology of the Great Lakes of North America. Commercial fishery has returned to this area.
More recently, pressure has been very intense in Western Europe, where the Dutch have pioneered agricultural nutrient management. Similar pressure has surfaced in North America. The Maryland General Assembly established the Water Quality Improvement Act of 1998 and the Nutrient Management Practices Act of 1998. These acts mandate that all feed for monogastric animals must be supplemented with a phytase enzyme or other additives that reduce phosphorus in the manure to the maximum extent commercially and biologically feasible by the end of the year 2000 (Harter-Dennis, 1999).
Phytase enzyme has become widely utilized as a method of reducing the requirement for supplemental phosphorus in monogastric diets. It is currently estimated that over two-thirds of the layers in the United States are already fed reduced phosphorus diets and the percentage is growing. Many of these birds are in locations that have not yet legislated use of phosphorus reducing technologies. These technologies are being employed because producers want to be good custodians of the environment. It is an added benefit for producers that with sound ration formulation addition of phytase can improve production economics.
Changes in the economics of phytase production have allowed practical use of this enzyme to support sound environmental management. It was not until process technology allowed production of cost effective phytase that its use became widespread. The first breakthrough took place when genetic engineering techniques allowed use of Aspergillus niger to express the enzyme.
This was followed by re-examination of the much older solid substrate fermentation techniques. This method allows non-genetically modified organisms to produce useful quantities of enzyme using modern process technology (Nokes, 1999). Thus, there are two distinct phytases in the marketplace, one derived from a genetically modified organism (GMO) the other based on a non-genetically modified organism (non-GMO). Both are marketed for their ability to release approximately 40% of the phytate phosphorus in practical diets. In monogastric rations this translates into a reduction of 0.1% in the amount of non-phytate phosphorus added to feed.
A reduction of 0.1% in the requirement for non-phytate phosphorus results in a 25% reduction in phosphorus excretion by layers (Balander and Flegal, 1997). Given the number of commercial egg layers in the United States alone, this represents a huge reduction in the environmental impact of poultry production.
Objectives
The present studies were undertaken to compare ability of GMO and non- GMO sources of phytase to release plant-bound phosphorus in commercial layer diets. While phytase is also known to improve utilization of other minerals, amino acids and energy in poultry diets, this study was designed to focus only on phosphorus utilization.
Materials and methods
Two experiments were designed to compare the phytase sources using performance of mature layers fed a phosphorus-inadequate basal diet as the criterion. When phosphorus reserves are depleted, birds are unable to maintain performance levels. Appetite declines, and with feed consumption inadequate to sustain production, egg production and egg size drop, along with specific gravity. Phytase, by releasing phytate phosphorus, slows the rate of depletion of phosphorus reserves. The effectiveness of the phytase is judged by the ability to slow the rate of phosphorus depletion and thus maintain appetite and performance. In these experiments, the phytase sources were added to a basal diet containing 0.10% available phosphorus in order to increase the sensitivity of the enzyme source comparison.
EXPERIMENT 1:EFFECTS OF GMO AND NON-GMO PHYTASE LEVELS IN DIETS CONTAINING ADEQUATE (0.4%) OR INADEQUATE (0.1%) AVAILABLE PHOSPHORUS
The GMO and non-GMO phytase sources used in the study were Natuphos® (BASF Corp., Mount Olive, NJ) and Allzyme Phytase® (Alltech Inc., Nicholasville, KY), respectively. The enzyme sources were added at either the manufacturers’ recommended use rates (Natuphos, 600 FTU/kg, Allzyme Phytase 11,500 PTU/kg) or half that rate to diets containing either adequate phosphorus (0.4%) or inadequate (0.1%) available phosphorus. The unsupplemented basal diet formulated at either 0.4 or 0.1% available phosphorus served as positive and negative control treatments.
Caged Hy-Line W-36 layers (Hy-Line International, West Des Moines, IA), aged 43 weeks were randomly assigned eight replicate pens of 16 birds per treatment. Feed and water were supplied ad libitum. Feed consumption was recorded weekly for the six week experiment. Egg production was summarized weekly. Egg weight and specific gravity were measured bi-weekly.
EXPERIMENT 2:COMPARATIVE DOSE-RESPONSE
Experiment 2 was designed to provide a more severe test for the GMO and non-GMO phytases. The GMO phytase was added at 50, 100, 150 or 200 FTU/kg and the non-GMO source was added at either 1900, 3800, 5700 or 7600 PTU/kg. The basal diet contained 0.1% available phosphorus, and a positive control treatment (0.4% available phosphorus) was included. The Hy-Line W-36 hens were 85 weeks of age for this eight week experiment and had been molted.
Results
EXPERIMENT 1:EFFECTS OF GMO AND NON-GMO PHYTASE LEVELS IN DIETS CONTAINING ADEQUATE (0.4%) OR INADEQUATE (0.1%) AVAILABLE PHOSPHORUS.
Feed consumption (Table 1) was lower in birds given the negative control in all weeks relative to the positive control. The difference between the two treatments became progressively greater with time. Feed intake of the positive control group remained relatively constant throughout the experiment. The lower feed intake of the negative control reflects lower appetite for hens fed the phosphorus-inadequate ration. Both phytase sources at both levels maintained feed intake levels comparable to the positive control for the six week experiment.
Egg production (Table 2) of birds fed the negative control diet began to fall after two weeks and by the end of the six week experiment was about half that of the positive control. This was expected as feed consumption declines slightly in advance of egg production. Both phytase sources at both levels supported production comparable to the positive control.
Egg weight (Table 3) of the positive control treatment group followed an upward trend over the six week experimental period while the negative control followed a downward trend. Both phytase sources and both levels followed the same upward trend as the positive control. These results indicate that both phytases were able to sustain egg weight when given the inadequate phosphorus rations for the six weeks of this experiment.
Egg specific gravity (Table 4) of the positive control, contrary to expectations, tended to increase over the experimental period. The negative control had lower specific gravity at all times compared to the positive control, as expected of birds fed an inadequate ration. It was interesting that the negative control mean specific gravity dropped at week 4 (relative to week 2) then increased to week 6. This indicates that the birds still in lay had a greater genetic ability to utilize the low levels of available phosphorus provided. Both phytase sources and both levels followed the same trend as the positive control; indicating that both phytase sources were able to sustain shell quality on the inadequate phosphorus diets for the duration of this experiment.
In summary, both the GMO and the non-GMO phytase at either the recommended use rate or half the recommended rate were able to sustain performance in birds given diets containing 0.1% available phosphorus at levels comparable to birds given 0.4% available phosphorus. There were no apparent differences between the two phytase sources under the conditions of this six week experiment.
Table 1. Effect of GMO and non-GMO phytases added at recommended or half the recommended dosage on feed consumption (g/day) in low phosphorus diets (Experiment 1).
abdMeans in a column differ, P<0.001.
Table 2. Effect of GMO and non-GMO phytases added at recommended or half the recommended dosage on egg production (%) in low phosphorus diets (Experiment 1). 
a-bMeans in a column differ, P<0.001.
Table 3.Effect of GMO and non-GMO phytases added at recommended or half the recommended dosage on egg weights (g) in low phosphorus diets (Experiment 1).
a-fMeans in a column differ, P<0.001.
Table 4.Effect of GMO and non-GMO phytases added at recommended or half the recommended dosage on egg specific gravity in low phosphorus diets (Experiment 1).
abMeans in a column differ, P<0.001.
EXPERIMENT 2:COMPARATIVE DOSE-RESPONSE
Feed consumption (Table 5) followed a similar pattern to that in Experiment 1. Intake of the negative control diet decreased initially, then stabilized at about 75 g per bird per day. The pattern for the two sources of phytase however differed. Consumption of diets containing GMO phytase declined as the level of use decreased, indicating that the lower levels were at the borderline of ability to counter inadequate dietary available phosphorus. It is important to note that available phosphorus in the phytase-supplemented diets had been reduced from the recommended 0.4 to 0.1% while manufacturers of both enzyme sources only recommend reduction to 0.30%.
Allzyme Phytase did not show a dose-related pattern for feed consumption and all non-GMO phytase inclusion rate treatments were similar to the positive control. Given this response it would appear that the non-GMO phytase had more phytase activity than had been assumed.
Egg production also showed a similar pattern to Experiment 1 in that production in the positive control group remained relatively constant for theeight week study while the negative control group had lower production after two weeks on the experiment and then stabilized after five weeks at about 40%. Egg production in the phytase-supplemented treatment groups followed feed intake patterns. Average egg production on the GMO phytase diets was dose-related while all supplementation levels of the non-GMO source were similar (Figure 1).
Table 5.Effect of phytase level and source on feed intake (g/day) (Experiment 2).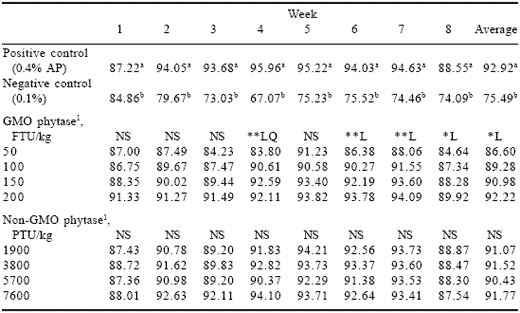
1Phytase enzyme sources were added to the negative control diet containing 0.1% AP.
abColumn means differ, P<0.05.
*L (linear effect, P<0.05), **L (linear effect, P<0.01), **LQ Linear, quadratic.
Figure 1.Effect of phytase source and level on average egg production in an eight week trial (PC = positive control, NC = negative control) (Experiment 2).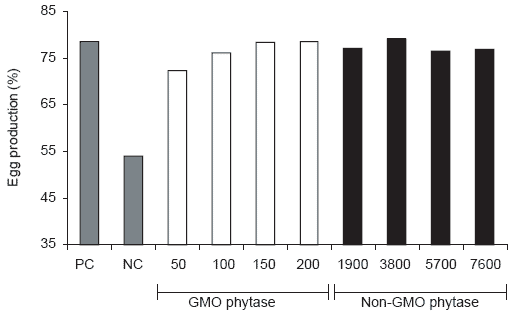
Egg weight (Table 6) did not follow the age-related pattern exhibited in Experiment 1. Both the positive and negative control treatment egg weights were relatively constant over the eight week experimental period, although there were weekly fluctuations, especially in the positive controls. A doserelated effect of the GMO phytase was similar to that noted in egg production and feed intake, however it was less pronounced. The non-GMO phytase showed no dose-related pattern and did not differ from the positive control.
Table 6.Effect of phytase source and dosage on egg weight (Experiment 2). 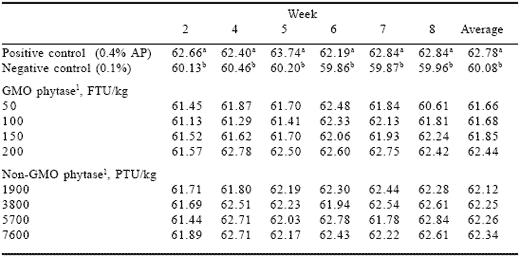
1Phytase enzyme sources were added to the negative control diet containing 0.1% AP.
Differences in egg specific gravity (Table 7) between the positive and negative control groups were similar to those in Experiment 1. The specific gravity was lower for the negative controls and decreased in the final weeks of the experiments indicating that only birds with the ability to utilize low available phosphorus levels remained in lay. As for egg production, feed intake and egg weight, specific gravity in the GMO phytase-supplemented groups responded in a dose-related manner while the non-GMO enzyme groups did not.
Both phytase sources had similar dose-related patterns in mortality (Table 8) with death losses decreasing with increased enzyme dose. Mortality in groups receiving the lowest phytase dose from either source was less than the negative control. This indicated that both are active even at these low use rates. Mortality at higher enzyme dosages for either source was comparable to the positive control.
Table 7. Effect of phytase source and level on egg specific gravity (Experiment 2).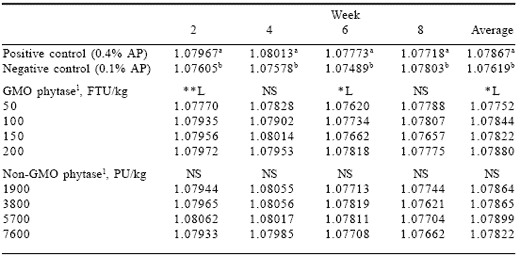
1Phytase enzyme sources were added to the negative control diet containing 0.1% AP.
abColumn means differ, P<0.05.
*L (linear effect, P<0.05), **L (linear effect, P<0.01).
Table 8. Effect of phytase source and level on average hen weight and mortality.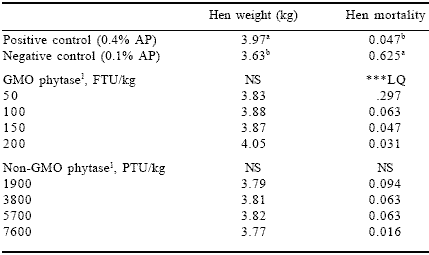
1Phytase enzyme sources were added to the negative control diet containing 0.1% AP.
NS = non significant, ***LQ (linear, quadratic responses, P<0.001).
Conclusions
These data demonstrate that both the GMO and non-GMO phytases can be used as recommended to reduce the non-phytate phosphorus allowances for layers. It is of interest to note that in both experiments feed consumption was the first criteria affected when inadequate available phosphorus rations were fed without enzyme supplementation. Appetite is critical to achieving many performance criteria. Low nutrient intake during heat stress leads to lower growth rates of pullets (Stanley et al., 1999a) and lower early egg production (Stanley et al., 1999b).
It should be noted that both experiments were relatively short term, i.e., six and eight weeks. The normal first lay cycle extends from 16 to in some cases over 80 weeks of age, a total of 64 weeks. Thus, it is not recommended that phosphorus levels be reduced in commercial diets to the extent they were in these experiments. Manufacturer’s recommendations of a 0.1 percentage point decrease in dietary available phosphorus content with recommended use rates of the GMO or non-GMO phytases would be appropriate.
There are indications in Experiment 2 that the non-GMO phytase activity was under-calculated. Further work will be required to determine the precise phytase activity of the non-GMO product. More side activities (i.e. innate protease and carbohydrase) would be expected in the enzyme produced by solid state fermentation.
This was demonstrated by Filer et al. (1999), who showed the non-GMO phytase released more amino nitrogen and reducing sugars, and that this was associated with greater in vitro phosphate release. Given the complex nature of feed ingredients, a broader spectrum of activity would be expected to ultimately result in similarly higher in vivo phytate phosphorus activity, which may enhance its effectiveness in poultry feed.
References
Balander, R.J. and C.J. Flagel. 1997. The effect of phytase on egg production and specific gravity in laying hens. Poultry Sci. 77(Suppl. 1):3.
Filer, K., J. Evans, K. Newman and P. Spring. 1999. In vitro comparison of two commercial phytase products. Poultry Sci. (Suppl. 1):74.
Harter-Dennis, J. 1999. Phytase applications in commercial broiler diets in Maryland. In: Biotechnology in the Feed Industry, Proceedings of the 15th Annual Symposium (T.P. Lyons and K.A. Jacques, eds.) Nottingham University Press, Nottingham, UK.
Nelson, T.S. 1967. The utilization of phytate P by poultry- A review. Poultry Sci. 46:862-871.
Nokes, S.E. 1999. Enzyme production using surface culture fermentation. In: Biotechnology in the Feed Industry, Proceedings of the 15th Annual Symposium (T.P. Lyons and K.A. Jacques, eds.) Nottingham University Press, Nottingham, UK.
Stanley, V.G., J. Robertson and V. Vaughn. 1999a. Growth performance, egg size, production and feed consumption of pullets fed dietary protease enzyme. Poultry Sci. 78(Suppl. 1):111.
Stanley, V., J. Robertson and V. Vaughn. 1999b. The response of laying hens to the feeding of dietary protease enzyme, phase II. Poultry Sci. 78 (Suppl. 1):44.





_1.jpg&w=3840&q=75)