Evaluation of a probiotic and an acidifier as an alternative to the use of antibiotic growth promoters in broilers
The ban since 2006 by the European Union regarding the use of antibiotic growth promoters has raised the interest in developing different alternatives such as probiotics and acidifiers, among others. The effect of the probiotic BioPro® and the sodium-enriched acidifier AES on chicken performance was evaluated in the this study. BMD 11% was incorporated into the feed as Positive Control, and as Negative Control the same diets where used without addition of the growth promoter. A challenge model based on the supply of diets with suboptimal levels of amino acids (especially lysine, methionine+cystine and threonine), vaccination against coccidiosis (five times the recommended dose), use of reutilized litter and increased E. coli load in the litter was used. As a result of this challenge, a lower weight and weight/conversion ratio was observed when comparing the Negative Control vs. the Positive Control. This result confirms that the challenge applied was enough to affect bird performance. With the inclusion of BioPro®, birds had a higher feed intake over the negative control, so that they showed improved weight and weight/feed conversion ratio, but without affecting feed conversion. Birds consuming AES® had similar results than with BioPro®, but to a lesser extent; both products had a similar behavior to that of the positive control. Keywords: Challenge model, Escherichia coli, Bird performance, Enterococcus faecium, Sodium salts.
Treatments | Description |
1.- Control + | Basal + BMD 11% (540 g/ton) |
2.- Control - | Basal without ATB |
3.- BioPro®1 | Idem T2 + BioPro 2 L/ton up to 14 d, then 1 L/ton |
4.- AES2 | Idem T2 + AES 2 kg/ton |
Age (Days) | 1 - 14 days | 15 - 28 days | 29 - 42 days | 43 - 49 days |
Corn | 61.03 | 65.48 | 66.66 | 69.96 |
Soybean meal 44 | 24.97 | 16.26 | 17.83 | 7.78 |
Soybeans, Steam | 6.60 | 11.10 | 8.86 | 15.55 |
Meat meal 41 | 6.34 | 6.16 | 5.74 | 5.80 |
Shell | 0.43 | 0.42 | 0.41 | 0.41 |
Salt | 0.33 | 0.26 | 0.25 | 0.24 |
Methionine | 0.05 | 0.07 | 0.08 | 0.08 |
Premix | 0.20 | 0.20 | 0.15 | 0.15 |
Choline | 0.05 | 0.05 | 0.03 | 0.03 |
Nutrients (%) | ||||
TME (Kcal/Kg) | 3288 | 3383 | 3476 | 3476 |
Lipids | 4.64 | 5.35 | 6.23 | 6.03 |
Protein | 21.00 | 19.00 | 18.00 | 17.00 |
Lysine | 1.10 | 0.97 | 0.91 | 0.84 |
Methionine + Cystine | 0.71 | 0.67 | 0.65 | 0.62 |
Threonine | 0.80 | 0.71 | 0.67 | 0.63 |
Arginine | 1.40 | 1.25 | 1.17 | 1.08 |
Ca | 1.00 | 0.96 | 0.90 | 0.90 |
P Av. | 0.50 | 0.48 | 0.45 | 0.45 |
In order to be in an area of a greater animal production response to any change in nutrient absorption, methionine + cystine, lysine and threonine requirements were lowered to 80% of the recommendation of the farm and consequently synthesis amino acid inclusion was reduced in all feeds.
Treatments | Days | |||||||
7 | 14 | 21 | 28 | 34 | 42 | 49 | ||
1.- Control + | 81 | 428 | 976 | 1869AB | 2844B | 4376B | 5894 | |
2.- Control - | 86 | 434 | 961 | 1855B | 2803B | 4346B | 5855 | |
3.- BioPro® | 86 | 437 | 979 | 1847B | 2897A | 4475A | 6022 | |
4.- AES® | 82 | 429 | 977 | 1902A | 2880A | 4445A | 5997 | |
CV% | 5.1 | 4.8 | 1.6 | 2.4 | 2.6 | 2.4 | 2.9 | |
Probability | 0.29 | 0.92 | 0.19 | 0.10 | 0.09 | 0.08 | 0.20 | |
Treatments | Days | |||||||
7 | 14 | 21 | 28 | 34 | 42 | 49 | ||
1.- Control + | 112 | 344 | 647ab | 1131ab | 1616a | 2292ab | 2890AB | |
2.- Control - | 111 | 347 | 633c | 1110c | 1667b | 2243b | 2816B | |
3.- BioPro® | 112 | 351 | 641bc | 1151a | 1634a | 2342a | 2931A | |
4.- AES® | 108 | 353 | 656a | 1154a | 1616a | 2308a | 2902A | |
CV% | 3.8 | 5.1 | 1.9 | 1.6 | 2.5 | 2.4 | 3.0 | |
Probability | 0.67 | 0.90 | < 0.01 | < 0.01 | 0.02 | 0.01 | 0.09 | |
Treatments | Days | ||||||
7 | 14 | 21 | 28 | 34 | 42 | 49 | |
1.- Control + | 0.726 | 1.246 | 1.509AB | 1.652 | 1.761 | 1.909 | 2.040 |
2.- Control - | 0.770 | 1.250 | 1.520A | 1.671 | 1.789 | 1.938 | 2.080 |
3.- BioPro® | 0.766 | 1.247 | 1.519A | 1.655 | 1.772 | 1.911 | 2.055 |
4.- AES® | 0.756 | 1.214 | 1.491B | 1.649 | 1.783 | 1.926 | 2.067 |
CV% | 3.7 | 2.7 | 1.4 | 1.9 | 1.9 | 1.8 | 1.6 |
Probability | 0.18 | 0.44 | 0.06 | 0.54 | 0.38 | 0.33 | 0.15 |
Treatments | Days | ||||||
7 | 14 | 21 | 28 | 34 | 42 | 49 | |
1.- Control + | 153 | 277 | 429ab | 686a | 918a | 1202ab | 1417A |
2.- Control - | 145 | 279 | 417b | 665b | 876b | 1158b | 1354B |
3.- BioPro® | 146 | 282 | 423b | 696a | 923a | 1226a | 1427A |
4.- AES® | 143 | 291 | 440a | 700a | 908ab | 1199ab | 1405A |
CV% | 5.4 | 6.5 | 3.0 | 2.6 | 3.7 | 3.5 | 3.9 |
Probability | 0.40 | 0.70 | 0.01 | < 0.01 | 0.05 | 0.03 | 0.07 |
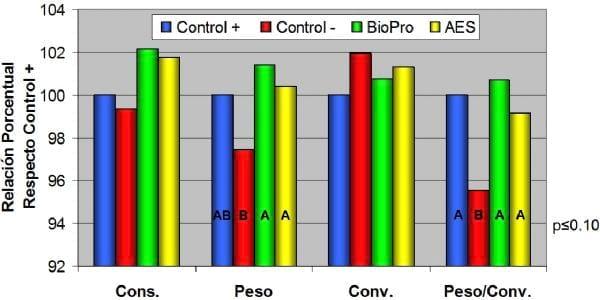
Live weight of birds fed the negative control diet was lower than that of birds in the positive control group. Such differences were significant between 21 and 34 days (p< 0.05).
No differences in conversion between controls were observed.
The weight/conversion ratio was lower in the negative control with significant differences at 28 and 34 days (P< 0.05) and 49 days (P< 0.10).
Feed consumption observed with BioPro® was greater than with the negative control, significant differences (P< 0.10) at 34 and 42 days.
The weight reached with BioPro® was greater with respect to the negative control group, with significant differences (P< 0.05) from the 28 days to 42 days. The same trend (P< 0.10) was observed at 49 days.
No differences in feed conversion were observed between BioPro®and the Negative Control.
Response in terms of the weight/conversion ratio was similar to that described for weight.
No differences in feed consumption were observed between birds fed with AES® and the negative control.
Body weight obtained with AES exceeded Negative Control from 21 days to 42 days (P < 0.05).
There was a trend (P< 0.10) to a better conversion with AES observed at 21 days.
The weight/conversion ratio achieved with AES exceeded that of the negative control, with significant differences (P< 0.05) at 21 and 28 days and a trend (P< 0.10) at 49 days.
- The challenge model applied negatively affected bird performance.
- Results show that with the inclusion of BioPro® or AES® this situation can be reverted, which positions these additives as alternatives to antibiotic growth promoters.
MEXICO05-RCB.pdf. Acceso: 01/04/11.
71886a.pdf. Acceso: 01/04/11.


.jpg&w=3840&q=75)