INTRODUCTION
Dead and nonambulatory pigs at the processing plant are a multifactorial problem that can be influenced by pig, facility design, people, management, transportation, processing plant, and environmental factors (Anderson et al., 2002; Ellis et al., 2003; Ellis and Ritter, 2005a), and these losses represent multiple challenges for the entire US food chain. First, improving the welfare of finished pigs during transport and reducing the incidence of dead and nonambulatory pigs has become an animal welfare priority (National Pork Board, 2007). Second, increasingly strict rules, regulations, and enforcement are being considered for nonambulatory livestock [e.g., the Downed Animal and Food Safety Protection Act—Bill H. R. 661 (US House of Representatives, 2007) and Bill S. 394 (US Senate, 2007)]. Third, transport losses represent direct financial losses to pig producers and pork processors. Dead and nonambulatory pigs have been estimated to cost the US pork industry $50 to $100 million annually (Ellis et al., 2003).
In 2004, the Animal Welfare Committee of the National Pork Board sponsored a workshop that involved scientists, government officials, and industry representatives from North America and Europe to review the scientific literature pertaining to transport losses in market weight pigs. The goals of this workshop were to identify key gaps in current knowledge and to identify future research needs. Therefore, the specific objectives of this paper are 1) to discuss pig transport losses from a historical perspective; 2) to determine the incidence and economic impact of transport losses in the United States; and 3) to describe the symptoms and metabolic characteristics of fatigued pigs.
REVIEW AND DISCUSSION
Defining Transport Losses
The term “transport losses” refers to pigs that die or become nonambulatory at any stage of the marketing process, defined as movement from the grower-finisher environment to stunning at the abattoir. Pigs that die during transport are referred to as “dead on arrival,” whereas pigs that die after having been unloaded are termed “dead in yard” or “dead in pen.” A “nonambulatory pig” is a pig unable to move or keep up with its contemporaries at the processing plant (Anderson et al., 2002). Several terms are used throughout the industry for nonambulatory pigs, including cripples, slows, stressors, subjects, and suspects.
Two types of nonambulatory pigs commonly observed are fatigued and injured pigs (Ellis and Ritter, 2005a,b). “Fatigued pigs” are pigs that, without obvious injury, trauma, or disease, refuse to walk or keep up with their contemporaries at any stage of the marketing process (Ritter et al., 2005). In addition, “injured pigs” are those that become nonambulatory or that have a compromised ability to ambulate because of structural unsoundness or an injury sustained before or during the marketing process (Ellis and Ritter, 2005b).
Historical Perspective
Transport losses in pigs during marketing from the farm to the processing plant are not a new issue in the swine industry. In fact, the National Livestock Loss Prevention Board was developed in 1934 to monitor losses occurring in livestock during transportation. In 1933 and 1934, the National Livestock Loss Prevention Board monitored the incidence of dead and nonambulatory pigs for shipment by rail and by truck at 17 livestock markets, and the incidence of dead and nonambulatory pigs was reported as 0.08 and 0.16%, respectively (Smith, 1937; Table 1).
The National Livestock Loss Prevention Board also continued to monitor the incidence of dead and nonambulatory pigs for deliveries by truck (Table 2) and by rail (Table 3) at the Omaha Livestock Market from 1934 to 1951. During that period, the incidence of dead pigs ranged from 0.07 to 0.19%, whereas the incidence of nonambulatory pigs ranged from 0.18 to 0.29%, with total losses ranging from 0.27 to 0.46% for deliveries by truck (Table 2). For deliveries by rail, the incidence of dead pigs ranged from 0.01 to 0.09%, that of nonambulatory pigs ranged from 0.11 to 0.21%, and that of total losses ranged from 0.14 to 0.29% (Table 3).
Smith (1937) provided recommendations for reducing transport losses in pigs during marketing. Interestingly, the following recommendations generally hold true today:
1. The railcar or truck should be cleaned and properly bedded before loading.
2. In hot weather, use sand for bedding, soak the sand before loading, and shower the pigs during transport. Do not apply a heavy stream of cold water to the back of a hot pig as this can result in death.
3. In the winter, use straw or hay for bedding and line the inside of the truck or car with heavy building paper to protect the pigs from cold air.
4. Withdraw feed before loading and do not feed pigs during transportation.
5. Handle pigs quietly and calmly.
6. Do not use sticks, clubs, whips, or prods to move pigs as these handling tools may cause carcass bruising. Instead, use canvas “flappers” to minimize carcass bruising.
7. If possible, do not mix unfamiliar pigs during transport.
8. Do not overcrowd pigs during transport, especially in hot weather.
In the 1960s, producers, researchers, and veterinarians reported unexplained deaths in heavy-muscled pigs during routine handling and transportation (Topel et al., 1968). From a survey conducted by the Livestock Conservation Institute, the percentage of pigs that died during transport reportedly increased by 61% from 1964 to 1972, and the incidence of nonambulatory pigs increased by 17% during that same period (Rosse, 1972). It was later determined that most of these unexplained deaths were attributed to porcine stress syndrome (Topel et al., 1968; Topel and Christian, 1981).
During the 1980s and 1990s, the research focus was more on the general well-being of pigs in relation to journey times and stocking densities. The information gathered during these decades has largely shaped legislation on the transportation of livestock in the European Union (European Economic Community, 1991; European Commission, 1995). More recently, the focus has shifted back toward transport losses, and several research projects from 2000 to 2007 have focused on the problem areas identified by Smith (1937). These efforts included evaluating the effects of handling tools (McGlone et al., 2004), handling intensity (Hamilton et al., 2004), feed withdrawal before loading (Ritter, 2007), mixing unfamiliar pigs during transport (Ritter, 2007), and transport floor space (Ritter, 2007) on the stress responses and transport losses of pigs during the marketing process.
Furthermore, priorities of the swine industry included the development of water-application recommendations during hot weather and boarding and bedding recommendations for cold weather to provide optimal care and comfort for pigs during transportation (National Pork Board, 2007).
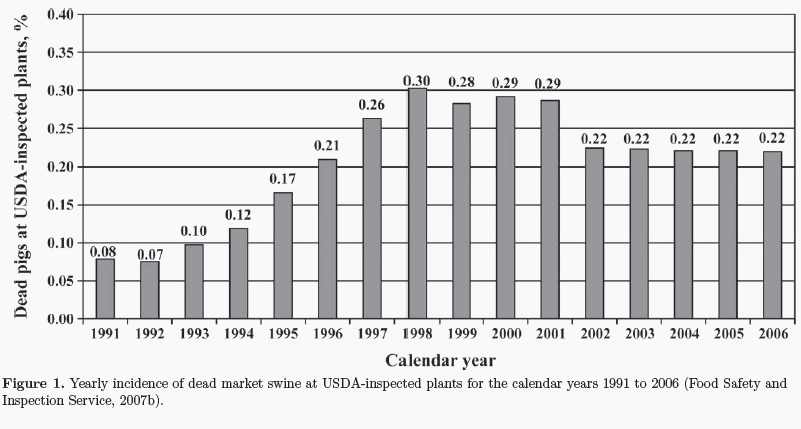
Incidence of Transport Losses Dead Pigs. The percentages of dead pigs at USDA-inspected plants are reported by the Food Safety and Inspection Service as “swine condemned ante-mortem for deads,” and these national statistics are available to the public via the Freedom of Information Act. The yearly incidence of dead market pigs at USDA-inspected plants for calendar years 1991 through 2006 is presented in Figure 1 (Food Safety and Inspection Service, 2007b). The incidence of dead market swine at US plants was very low in 1991 (0.08%) and 1992 (0.07%); however, the percentage of dead pigs at US plants increased 3-fold between 1993 and 1998 (0.10 and 0.30%, respectively). It is unclear why this value increased greatly over this period, but some potential explanations include changes in genetics, increased slaughter weights, and increased size of production operations (Ellis et al., 2003). For example, the national average for slaughter weights in the United States increased from 114.8 kg in 1993 to 117.5 kg in 1999 (USDA- National Agricultural Statistics Service, 2008).
From 1998 to 2001, the percentage of dead pigs peaked and remained relatively constant (at 0.28 to 0.30%), whereas from 2001 to 2002, the percentage of dead pigs at US plants decreased from 0.29 to 0.22%, where it remains today. This decrease can be attributed to greater industry awareness of losses during the marketing process. In 2002, the Transport Quality Assurance program of the National Pork Board was made available, and there was a concerted focus on research that yielded important knowledge (National Pork Board, 2008a,b).
Beginning in about 2005, several pork processors began euthanizing nonambulatory pigs on the trailer and in the plant that had a low likelihood of recovering (e.g., pigs with broken legs; pigs with a rectal temperature greater than 41.1°C) to minimize stress and suffering (M. Siemens, Cargill Meat Solutions, Wichita, KS, personal communication). In most cases, nonambulatory pigs that are killed are recorded as dead pigs; therefore, the definition of a dead pig at US processing plants has now been altered to include pigs that are killed at the plant.
A summary of the incidence of dead pigs at the processing plant for 1960 through 2004 is presented by country in Table 4. The current US national average for percentage of pigs dead at the processing plant (0.22%; Figure 1) is similar to values reported for Canada from 1996 to 2004 (range: 0.07 to 0.17%) and Spain (range: 0.15 to 0.33%), but is higher than values reported for Denmark from 1996 to 2002 (0.02%), the Czech Republic from 1997 through 2004 (0.11%), for France during 1995 and 1997 (0.08 and 0.07%, respectively), for Germany from 1999 through 2003 (range: 0.10 to 0.17%), and for the United Kingdom from 1990 through 1994 (range: 0.05 to 0.11%).
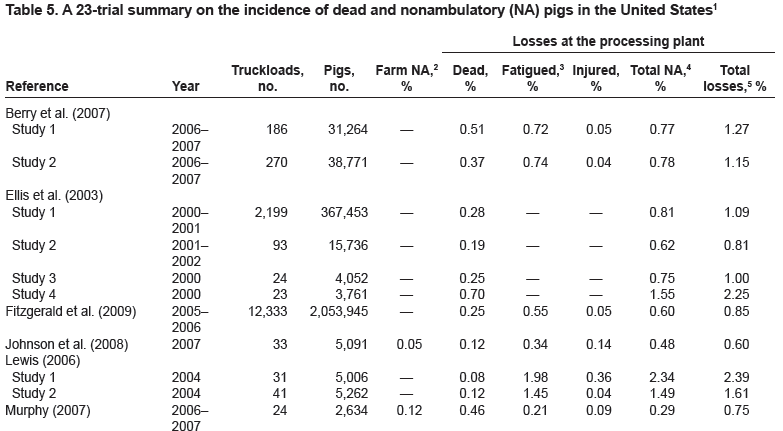
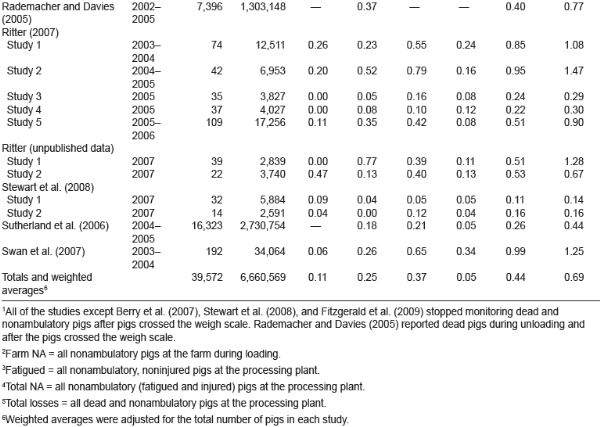
Nonambulatory Pigs. Currently, national statistics are not available for the incidence of nonambulatory pigs at US processing plants. However, 23 commercial field trials have reported incidences of dead pigs, nonambulatory pigs, and total losses (dead and nonambulatory pigs) at US processing plants that have occurred before pigs reached the weigh scale (Table 5). The weighted averages across the 23 field studies (n = 6,660,569 pigs) were 0.25% for dead pigs (range: 0.00 to 0.77%), 0.44% for nonambulatory pigs (range: 0.11 to 2.34%), and 0.69% for total losses (range: 0.14 to 2.39%). Furthermore, nonambulatory pigs at the processing plant were classified as fatigued or injured in 18 of these 23 field studies (Table 5). The weighted averages across the 18 studies (n = 4,966,419 pigs) were 0.37% fatigued (range: 0.05 to 1.98%) and 0.05% injured (range: 0.04 to 0.36%), suggesting a 7:1 ratio of fatigued to injured pigs at the processing plant. Additionally, the percentage of nonambulatory pigs at the farm was reported in only 12 of the 23 studies (n = 101,417 pigs), and the weighted average for nonambulatory pigs at the farm across those studies was 0.11% (range: 0.00 to 0.47%).
The incidence of nonambulatory pigs in other countries has been poorly documented as well. Sunstrum et al. (2006) monitored transport losses in Ontario in 2003 and reported that the percentage of subject pigs at the plant was 0.27%, which included 0.13% fatigued pigs, 0.12% injured pigs, and 0.02% cull pigs (e.g., prolapses, intact males, severe bruises, tail bites, etc.). The literature is apparently devoid of any reports of nonambulatory pigs in European countries. However, Averós et al. (2008) recently monitored 739 journeys to 37 processing plants in 5 different European Union countries and reported that the percentages of dead and injured pigs during unloading were 0.11 and 0.36%, respectively. Interestingly, these authors included pigs with skin blemishes and lameness in their definition of injured pigs. Therefore, it is unclear if any of these injured pigs became nonambulatory at the processing plant.
Economic Implications
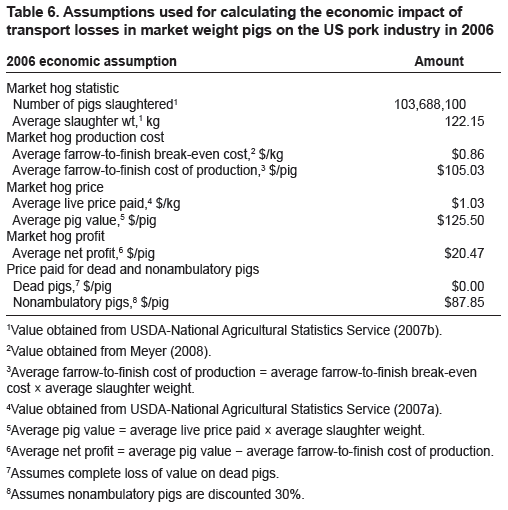
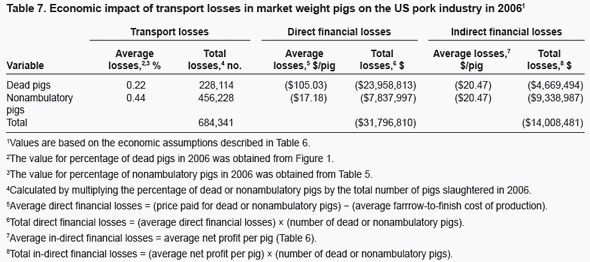
Swine Producers. Economic losses experienced by pork producers include a complete loss of value on dead pigs and substantial price discounts on nonambulatory pigs. Discounts for nonambulatory pigs vary by region and by processing plant in the United States, and these discounts have been estimated to be as high as 30% of the total value of the pig (M. Ritter, Elanco Animal Health, Greenfield, IN, personal communication). There also may be economic losses associated with carcass trim loss on nonambulatory pigs because of carcass bruising. Economic losses experienced by US swine producers in 2006 caused by transport losses in market weight pigs are summarized in Tables 6 and 7. The average US slaughter weight in 2006 was 122.15 kg. The estimated farrow-to-finish cost of production, average pig value, and net profit on a per-pig basis were $105.03, $125.50, and $20.47, respectively (Table 6). The percentages of dead and nonambulatory pigs used in this economic analysis were 0.22% (Figure 1) and 0.44% (Table 5), respectively.
Economic losses were divided into “direct financial losses” and “indirect financial losses” (Table 7). Direct financial losses were defined as the price paid for dead and nonambulatory pigs minus the average farrowto- finish cost of production. For the purposes of this analysis, it was assumed that dead pigs had zero value, whereas nonambulatory pigs were discounted by 30% ($37.65) of the total value of the pig ($125.50; Table 6). Thus, direct financial losses for dead pigs and nonambulatory pigs were calculated to be $105.03 and $17.18 per pig, respectively (Table 7).
Indirect financial losses refer to lost profit opportunities, which averaged $20.47 per pig in 2006 (Table 6). When applied to the 103,688,100 pigs that were slaughtered in the United States in 2006, direct financial losses and indirect financial losses were determined to be $31,796,810 and $14,008,481, respectively (Table 7). Therefore, total economic losses associated with dead and nonambulatory pigs were estimated to be approximately $46 million in 2006 (Table 7). This value is similar to the estimate of Ellis et al. (2003), who reported that transport losses cost US swine producers between $50 million and $100 million dollars annually.
Pork Processors.
Pork processing plants have disposal costs for dead pigs, increased labor costs to move nonambulatory pigs quickly and humanely to the USDA suspect pen, and increased attention to regulations and personnel training on how to handle nonambulatory pigs. The USDA evaluates how nonambulatory pigs are handled at each plant and inspects all nonambulatory pigs for health before slaughter. Improper handling of nonambulatory pigs at a processing plant can result in a USDA noncompliance report. Furthermore, inhumane acts that are considered by the USDA inspector to be of an “egregious nature” will result in suspension of inspection at the processing plant (Food Safety and Inspection Service, 2003, 2007a, 2008a,b).
Two of the 5 “willful acts of abuse” monitored in the American Meat Institute’s animal handling audit of processing plants pertain to the handling of nonambulatory pigs. These willful acts of abuse include dragging conscious, nonambulatory pigs and driving normal pigs over the top of a nonambulatory pig (Grandin, 2007). Furthermore, meat from nonambulatory animals cannot enter government food programs (e.g., school lunch programs and military commissaries), thereby requiring additional time and labor to segregate carcasses of nonambulatory pigs from those of normal pigs to ensure that meat from these carcasses is not used in these programs (M. Siemens, 2009, Cargill Meat Solutions, Wichita, KS, personal communication).
Further Processors and Retailers.
Economic losses associated with nonambulatory pigs may also be incurred by further processors and retailers. Carr et al. (2005) evaluated fresh pork quality traits of 246 fatigued pigs, and reported that the vast majority of fatigued pigs produced pork with high ultimate pH (6.0), low Minolta L* values (45.72), and low drip losses (1.91%). These quality attributes are indicative of dark, firm, and dry pork; however, a small percentage of the fatigued pigs yielded pale, soft, and exudative pork. It is well-documented that short-term stress immediately before slaughter increases the rate of postmortem metabolism, resulting in pale, soft, and exudative pork, whereas long-term stress before slaughter depletes muscle glycogen stores, resulting in dark, firm, and dry pork (reviewed by Gregory, 1994). On this basis, Carr et al. (2005) hypothesized that the fresh quality carcass traits of fatigued pigs depend on when the pig becomes fatigued during the marketing process.
 Click aquí para ampliar la imágen
Symptoms and Metabolic Characteristics of Fatigued Pigs
Symptoms. Anderson et al. (2002) reported that fatigued pigs at processing plants displayed the acute-stress symptoms of open-mouth breathing (44%), skin discoloration (77%), muscle tremors (83%), and abnormal vocalizations (30%). Additionally, a strong positive relationship (r = 0.81) between dead and nonambulatory pigs has been reported (Hamilton et al., 2003), which suggests a common link or cause for dead and nonambulatory pigs. On this basis, a continuum of stress was recently proposed for the development of fatigued and dead pigs (Ritter et al., 2005). As the pig begins to experience stress, it will display open-mouth breathing, skin discoloration, or both. If the stress is not removed or if additional stressors are introduced, the pig will become reluctant to move, make abnormal vocalizations, develop muscle tremors, or some combination of these signs. At this stage, the pig may become overwhelmed by the accumulation of stress, in which case the pig will collapse and become nonambulatory, and, in extreme cases, death may ensue.
Metabolic Characteristics
Ivers et al. (2002) measured several metabolic parameters in normal and fatigued pigs during unloading at the processing plant. Compared with normal pigs from the same trailer load, fatigued pigs had higher blood lactate, ammonia, sodium, potassium, cortisol, epinephrine, and norepinephrine concentrations while having lower blood pH, bicarbonate, base excess, calcium, partial pressure of carbon dioxide, and insulin values. Additionally, fatigued pigs had lower liver glycogen concentrations and lower glycolytic potential values in the LM and semitendinosus muscles than normal pigs. Thus, the researchers concluded that fatigued pigs are in a metabolic state of acidosis characterized by high blood lactate and low blood pH values (Anderson et al., 2002; Ivers et al., 2002).
Additionally, it is plausible that pigs could develop fatigue from chronic stress. Chronic stress depletes muscle glycogen stores and may result in physical exhaustion and fatigue (reviewed by Gregory, 1994, 1996). In support of this theory, Carr et al. (2005) reported that the majority of fatigued pigs evaluated had high LM ultimate pH (5.90 to 7.00), suggesting that muscle glycogen stores were substantially reduced before slaughter. However, the relationship between muscle glycogen stores and the incidence of fatigued pigs is currently unknown and warrants additional research.
Do Fatigued Pigs Recover?
Blood pH, lactate, bicarbonate, and base-excess values of aggressively handled pigs return to baseline resting values by 2 h posthandling (Anderson et al., 2002; Bertol et al., 2002). Furthermore, Ritter et al. (2006) monitored 25 pigs that had become fatigued on the trailer during loading, and reported that 72% of these pigs were normal during unloading at the processing plant after a 3-h journey. Results of these studies suggest that fatigued pigs may recover if allowed to rest for at least 2 to 3 h.
IMPLICATIONS
Transport losses on average total 0.7%, meaning that more than 99% of pigs that are transported walk off the truck, walk through the plant, and are processed without delay. Despite the large percentage of unaffected pigs, transport losses have been estimated to cost the US swine industry approximately $46 million annually. More than 80% of pigs that become nonambulatory are in a state of metabolic acidosis and are classified as fatigued, yet the majority of these pigs will recover fully if given time to rest. Because transport losses are a multifactorial problem consisting of pig, facility design, people, management, transportation, processing plant, and environmental factors, continued research efforts are needed to understand how each of these factors and the relationships among factors affect the well-being of the pig during the marketing process.
ACKNOWLEDGMENTS
The authors acknowledge the National Pork Board Animal Welfare Committee for organizing and sponsoring this project.
LITERATURE CITED
Abbott, T. A., H. J. Guise, E. J. Hunter, R. H. C. Penny, P. J. Barnes, and C. Easby. 1995. Factors influencing pig deaths during transit: An analysis of drivers’ reports. Anim. Welfare 4:29.
Allen, W. M. 1979. Losses of pigs due to the “acute stress syndrome” in the United Kingdom. Acta Agric. Scand. 21:495.
Allen, W. M., C. N. Hebert, and L. P. Smith. 1974. Deaths during and after transportation in pigs in Great Britain. Vet. Rec. 94:212.
Anderson, D. B., D. J. Ivers, M. E. Benjamin, H. W. Gonyou, D. J. Jones, K. D. Miller, R. K. McGuffey, T. A. Armstrong, D. H. Mowrey, L. F. Richardson, R. Seneriz, J. R. Wagner, L. E. Watkins, and A. G. Zimmermann. 2002. Physiological responses of market hogs to different handling practices. p. 399 in Proc. Am. Assoc. Swine Vet., Kansas City, MO.
Averós, X., T. G. Knowles, S. N. Brown, P. D. Warriss, and L. F. Gosálvez. 2008. Factors affecting the mortality of pigs being transported to slaughter. Vet. Rec. 163:386.
Barton Gade, P. 1997. The effect of preslaughter handling on meat quality in pigs. p. 100 in Manipulating Pig Production. P. D. Cranwell, ed. Australas. Pig Sci. Assoc., Victoria, Australia.
Barton Gade, P., L. Christensen, M. Baltzer, and J. Valentin Petersen. 2007. Causes of preslaughter mortality in Danish slaughter pigs with special emphasis on transport. Anim. Welfare 16:459.
Benjamin, M. E. 2005. Pig handling: Physiological responses and meat quality discussion. In Proc. 2005 Manitoba Swine Seminar. http://www.gov.mb.ca/agriculture/livestock/ pork/pdf/bab19s01.pdf Accessed May 14, 2009.
Berry, N., A. Johnson, J. Hill, T. Baas, L. Karriker, and K. Stalder. 2007. Loading gantry versus traditional chute for the finisher pig: Effect on welfare parameters at time of marketing. p. 137 in Proc. Allen D. Leman Swine Conf., St. Paul, MN.
Bertol, T. M., M. Ellis, D. N. Hamilton, and F. McKeith. 2002. Effect of handling intensity on blood acid-base balance in slaughter pigs. J. Anim. Sci. 80(Suppl. 2):86. (Abstr.)
Carr, S. N., J. P. Gooding, P. J. Rincker, D. N. Hamilton, M. Ellis, J. Killefer, and F. K. McKeith. 2005. A survey of pork quality of downer pigs. J. Muscle Foods 16:298.
Christensen, L., P. Barton Gade, and L. Blaabjerg. 1994. Investigation of transport conditions in participating countries in the EC project: PL92063. p. W-201 in Proc. 40th Int. Congr. Meat Sci. Technol., The Hague, the Netherlands.
Colleu, T., and P. Chevillon. 1999. Effect of climatic parameters and distance on pig mortality during transport. Techni-Porc. 22:31.
Corstiaensen, G. P., J. J. M. De Bruin, L. H. H. M. Lendfers, J. G. van Logtestijn, and A. Th. Verdijk. 1977. Pig losses during transport and in the pens of slaughterhouses in the Netherlands in 1976. Tijdschr. Diergeneeskd. 102:811.
Ellis, M., F. McKeith, D. Hamilton, T. Bertol, and M. Ritter. 2003. Analysis of the current situation: What do downers cost the industry and what can we do about it? p. 1 in Proc. 4th Am. Meat Sci. Assoc. Pork Quality Symp., Columbia, MO.
Ellis, M., and M. Ritter. 2005a. Impact of animal handling and transportation conditions on losses of slaughter weight swine during transport. p. 199 in Proc. Am. Assoc. Swine Vet., Toronto, Ontario, Canada.
Ellis, M., and M. Ritter. 2005b. Transport losses: Causes and solutions. p. 176 in Proc.
Allen D. Leman Swine Conf., St. Paul, MN.European Commission. 1995. Council Directive 95/29/EC, On the protection of animals during transport and amending Directive 91/628/EEC. Off. J. Eur. Communities L 148:52.


