Pork Fat Quality
Published: September 21, 2010
By: Andrzej A. Sosnicki, PhD., Dr. Neal Matthews, Brandon Fields, Steve Jungst (Pic North America)
Due to the severe economic crisis our industry has been enduring over the last two years, it is plausible to assume that a close collaboration between the many segments of our industry will only be accelerated. That evolution will, in turn, enhance the industry's ability to better develop and implement strategies to sustainably produce the most desirable carcass (raw materials) at the least cost. This issue of Cutting Edge addresses the biological, dietary and pork processing aspects of fat quality and discusses the means to economically balance pig growth rate, feed conversion ratio and lean deposition with desirable carcass fat content and quality.
As commercial pigs have become leaner over the past 20 years, fat quality has become one of the key traits defning overall carcass value Fat quality has received heightened awarenes over the past few years as feed prices have increased, resulting in least-cost formulated diets using ingredients that may compromise fat quality. Many factors can contribute to fat composition (and quality). Some of these factors include: genetics, diet, leanness/fatness, growth rate, age/body weight, gende and anatomical fat location (7,15). Of these factors, diet is the key factor that we can use to quickly infuence fat quality, as the non-diet factors are less feasible to alter substantially to improve fat quality. This issue of Cutting Edge addresses the biological, dietary and commercial aspects of fat quality and means to control them in production systems.
Effect of Fat Quality on Pork Products
Fat quality can be best defned by the frmness of the fat. Soft fat often leads to fat layer separation in loins and may be partially responsible for muscle separation in the ham and shoulder (10). Soft fat in bellies has been implicated in causing reduction in slicing yields;however, most large-scale commercial slice yield studies do not indicate that slice yield is decreased by soft fat. It is generally agreed upon that soft fat causes problems with product appearance when packaged (9). Soft fat can lead to bacon that has an oily/wet appearance that may often be transparent, offers no slice defnition when packaged under vacuum, and leads to faster oxidation rates (rancidity). Soft fat can also lead to product appearance issues with sausage and can lead to reduced yields in emulsion products like bologna (14).
Generally, soft fat produces reduced product "workability" and appearance with an increased propensity for rancidity to develop.
Biology of Fat
An understanding of fat chemistry is essential to understanding basic fat quality. Fat is composed of fat (triglycerides = glycerol + fatty acids), water, and protein. Fatty acids can be Fatty acids can be classifed into three categories based on their chemical structures (or saturation level):
1) saturated fatty acids - no double bonds
2) mono-unsaturated fatty acids - one double bond
3) polyunsaturated fatty acids - two or more double bonds
1) saturated fatty acids - no double bonds
2) mono-unsaturated fatty acids - one double bond
3) polyunsaturated fatty acids - two or more double bonds
The saturation of fatty acids dictates the melting point of a fat (frmness), with a highly saturated fat having a higher melting point (frmer) than an unsaturated fat. Dietary fats and carbohydrates are the sources of long chain fatty acids for synthesis of fats in mammals (13). Dietary fats are readily converted to carcass fat and carcass fat formed in this manner takes the general characteristics of the dietary fat (soft dietary fat = soft carcass fat). Dietary carbohydrates are converted to body fat through a process called "de novo fatty acid synthesis," forming predominantly saturated and monounsaturated fatty acids (13), which yield a frmer carcass fat. Although dietary carbohydrates are used to synthesize fatty acids, most mammals, including the pig, are not able to incorporate a double bond past the Δ9 position in a de novo synthesized fatty acid (13). Thus, pigs can only form saturated and monounsaturated fatty acids from carbohydrates and require the essential fatty acids (polyunsaturated fatty acids, such as linoleic acid) from a fat source in the diet to incorporate polyunsaturated fatty acids into the fat of the carcass (13). Dietary fat additions will alter or even shut down de novo fat synthesis (13). Thus, as the percentage of fat is increased in the diet, de novo fatty acid synthesis is further inhibited, resulting in less saturated fat deposition (softer). Furthermore, as the fatty acid profle of dietary fat becomes less saturated (softer), pig body (and carcass) fat also becomes less saturated (softer).
Metrics of Fat Firmness
The current "standard" measure of fat frmness is iodine value. Iodine value is a measure of the unsaturation of fats and is expressed in terms of the amount of iodine absorbed by a fat sample. Basically, the iodine value (IV) determines the unsaturation level of the fat through the number of double bonds in the fatty acids.
Saturated fat = low iodine value = frm fat
Unsaturated fat = high iodine value = soft fat
Unsaturated fat = high iodine value = soft fat
Most commonly in the pork industry, iodine value is determined by direct chemical methods (i.e. Hanus method), fatty acid analysis [IV = (C16:1*0.95)+(C18:1*0.86)+(C18:2*1.73)+(C18:3*2.62)+(C20:1*0.79)], or through Near Infra-Red (NIR) methods. The fatty acid analysis method is currently the most common method of analysis, but NIR analysis will likely become more prevalent in the future due to reduction in labor intensity and speed of sample determination.
Other objective measures of fat frmness may include assessing the linoleic acid content (C18:2) of fat, because it is the most prevalent polyunsaturated fatty acid in pork fat and often dictates its iodine value. Many companies use the bend/bar/fex method of assessing frmness of bellies or loins, which involves draping the belly/loin over a bar and assessing the frmness by measuring the amount of "droop" over the bar. Minolta colorimeter readings can be used to assess fat color because higher levels of linoleic acid should give the fat a more yellowish color. Within the pork industry subjective frmness assessments have also been used to assess frmness of products such as loins, bellies, and butts. These subjective measures are normally user-defned and unique to the plant/company in which they are developed.
Other objective measures of fat frmness may include assessing the linoleic acid content (C18:2) of fat, because it is the most prevalent polyunsaturated fatty acid in pork fat and often dictates its iodine value. Many companies use the bend/bar/fex method of assessing frmness of bellies or loins, which involves draping the belly/loin over a bar and assessing the frmness by measuring the amount of "droop" over the bar. Minolta colorimeter readings can be used to assess fat color because higher levels of linoleic acid should give the fat a more yellowish color. Within the pork industry subjective frmness assessments have also been used to assess frmness of products such as loins, bellies, and butts. These subjective measures are normally user-defned and unique to the plant/company in which they are developed.
Genetic Effects on Fat Firmness
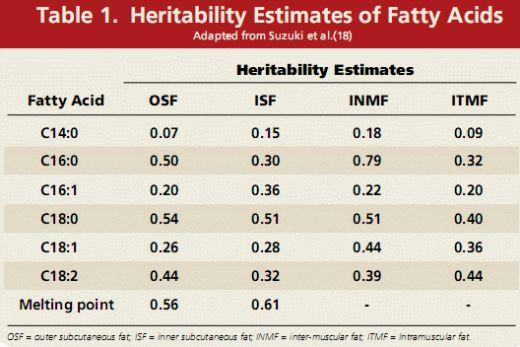
Pig genotype has been shown to have an effect on fat frmness by numerous researchers (2,5,12,16,18). Heritability estimates (i.e. proportion of the total phenotypic variation in a population for a trait that is attributable to the additive effect of the genes) have been reported for several fatty acids, indicating there is genetic variation for fatty acid composition and fat quality (Table 1). Some of the fatty acids (C16:0, C18:0, C18:1, and C18:2) and the melting point of fat have been found to have low (i.e. <0.20), moderate (i.e. 0.20-0.40) or high (i.e. >0.40) heritabilities (18). Although differences between genotypes exist, most of the difference due to fat frmness between genotypes can be attributed to fatness of the genotype (12).
Pig genotype has been shown to have an effect on fat frmness by numerous researchers (2,5,12,16,18). Heritability estimates (i.e. proportion of the total phenotypic variation in a population for a trait that is attributable to the additive effect of the genes) have been reported for several fatty acids, indicating there is genetic variation for fatty acid composition and fat quality (Table 1). Some of the fatty acids (C16:0, C18:0, C18:1, and C18:2) and the melting point of fat have been found to have low (i.e. <0.20), moderate (i.e. 0.20-0.40) or high (i.e. >0.40) heritabilities (18). Although differences between genotypes exist, most of the difference due to fat frmness between genotypes can be attributed to fatness of the genotype (12).
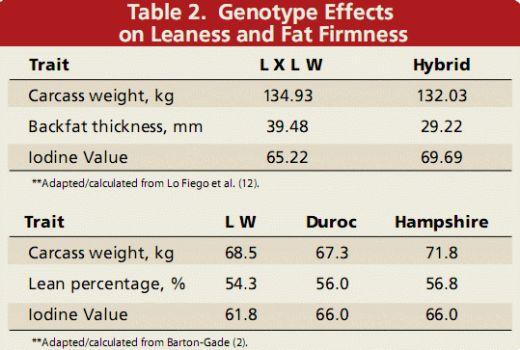
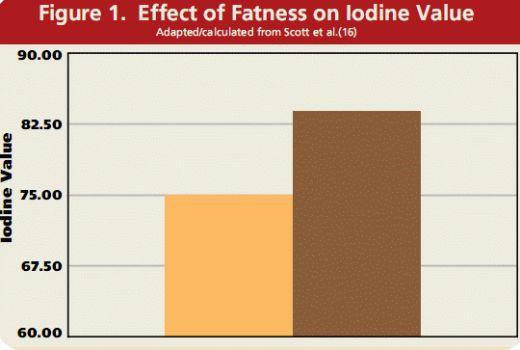
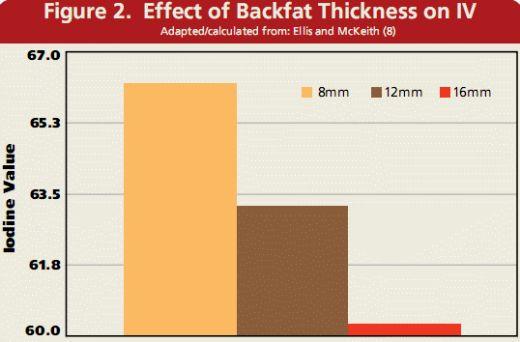
Typically as the degree of fatness increases, the fat becomes more saturated or frmer. For example, it was found that the difference between lean and obese pigs (selected for either lower or higher levels of backfat thickness derived from the same population of pigs) had a dramatic effect on fatty acids, which equates to around 9 IV units difference (16; Figure 1). Other research has also found similar results when comparing genetic lines having different fatness/leanness levels (2,12; Table 2) or when assessing the effect of backfat on iodine value (8; Figure 2). Furthermore, some reports have indicated that faster growing animals have frmer fat (7). The difference in fat frmness between most modern genetic lines should be minimal, assuming comparisons are made on animals with similar backfat levels (or % lean), live weights, and/or nutritional planes.

Other Non-Nutrition Effects on Fat Firmness
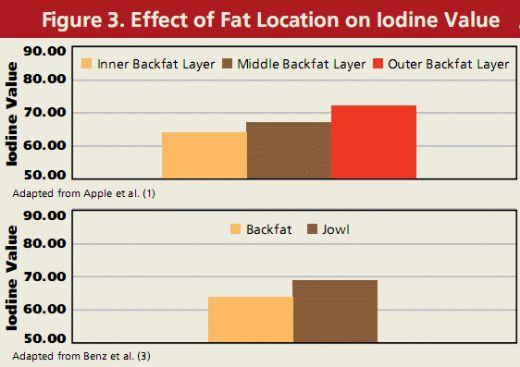
Anatomical location of the fat can also infuence its frmness. This has been demonstrated when comparing fat from the jowl and backfat, or even when comparing the individual fat layers of backfat (1,3; Figure 3). Gender can also have an effect on fat quality, which is to be expected because gilts are typically leaner than barrows and, as previously mentioned, leaner animals generally have softer fat. The difference between barrows and gilts for iodine value is typically 1-2 IV units. Research has evaluated the effect of age or body weight on fatty acid composition. It has been shown that from 70 to 220 days of age, saturated fatty acids increase and unsaturated fatty acids decrease, implying fat becomes frmer as a pig gets older (15). Reports have indicated improvements in fat frmness up to the 250 to 265-lb. range (1,11). Correa et al., (7) indicated little difference in fatty acid composition at weights of 236, 254, or 276 lbs., but data from Lo Fiego et al., (12) indicated that fat frmness was improved up to 350 lbs.
Anatomical location of the fat can also infuence its frmness. This has been demonstrated when comparing fat from the jowl and backfat, or even when comparing the individual fat layers of backfat (1,3; Figure 3). Gender can also have an effect on fat quality, which is to be expected because gilts are typically leaner than barrows and, as previously mentioned, leaner animals generally have softer fat. The difference between barrows and gilts for iodine value is typically 1-2 IV units. Research has evaluated the effect of age or body weight on fatty acid composition. It has been shown that from 70 to 220 days of age, saturated fatty acids increase and unsaturated fatty acids decrease, implying fat becomes frmer as a pig gets older (15). Reports have indicated improvements in fat frmness up to the 250 to 265-lb. range (1,11). Correa et al., (7) indicated little difference in fatty acid composition at weights of 236, 254, or 276 lbs., but data from Lo Fiego et al., (12) indicated that fat frmness was improved up to 350 lbs.
Nutritional Effects on Fat Firmness
Pig diets are one of the most important factors in ensuring or changing the fatty acid profle from the standpoint that the diet can be altered more readily than non-dietary infuences on fat quality. The importance of nutrition can probably be best exemplifed by the volume of research that is conducted concerning dietary infuences of fat quality vs. the research assessing non-dietary effects on fat quality. This literature is replete with research evaluating dietary fat sources, inclusion levels of fat sources, and feed ingredients that can potentially affect fat quality (i.e. fat sources, DDGS, CLA or ractopamine). For the most part, these studies agree with the previously mentioned general fat biology principles as related to dietary fat (i.e. as the percentage of fat is increased in the diet, denovo fatty acid synthesis is further inhibited, resulting in less saturated/softer fat and as the fatty acid profle of dietary fat becomes less saturated/softer, carcass fat becomes less saturated/softer).
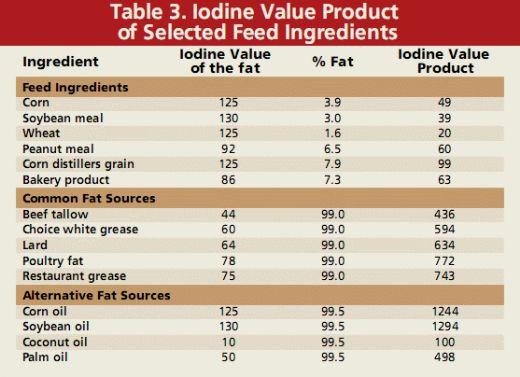
The iodine value product (IVP) concept (6) is based on these principles and is calculated using the formula: IVP = (iodine value of the feed source fat) X (% of fat in the feed source) X 0.10. Table 3 contains IVP's of some selected dietary ingredients. Formulas have been developed that estimate the iodine value of carcass fat based on the iodine value product of the diet. The following equation developed by PICcan be used to estimate carcass fat frmness based on dietary IVP: Predicted Fat IV = 0.32 (IVP) + 52.4 (4). The IVP concept can be useful in managing pork fat quality through diet formulations that take in account IVP of the dietary ingredients used. Nutritional manipulation can be very instrumental in managing fat frmness; however, non nutritional factors may interact with or counteract dietary manipulations to change fat quality. For example, a diet change could be made to decrease iodine value, but slower growth rates due to heat stress or health challenges could cause carcass fat iodine values to increase due to the slower growth rate.
The iodine value product (IVP) concept (6) is based on these principles and is calculated using the formula: IVP = (iodine value of the feed source fat) X (% of fat in the feed source) X 0.10. Table 3 contains IVP's of some selected dietary ingredients. Formulas have been developed that estimate the iodine value of carcass fat based on the iodine value product of the diet. The following equation developed by PICcan be used to estimate carcass fat frmness based on dietary IVP: Predicted Fat IV = 0.32 (IVP) + 52.4 (4). The IVP concept can be useful in managing pork fat quality through diet formulations that take in account IVP of the dietary ingredients used. Nutritional manipulation can be very instrumental in managing fat frmness; however, non nutritional factors may interact with or counteract dietary manipulations to change fat quality. For example, a diet change could be made to decrease iodine value, but slower growth rates due to heat stress or health challenges could cause carcass fat iodine values to increase due to the slower growth rate.
Dried Distiller Grains and Fat Quality
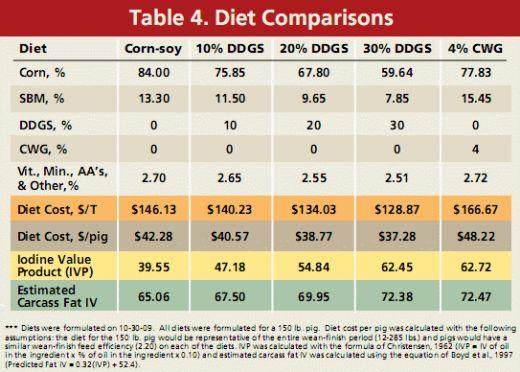
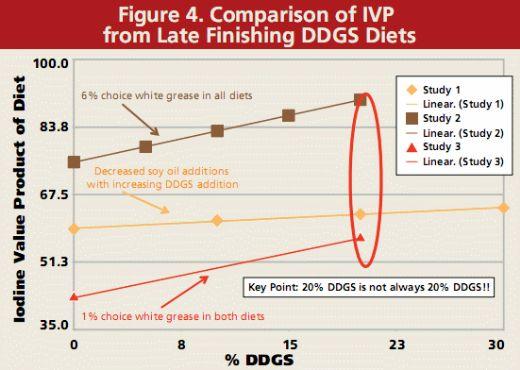
The volume of literature concerning the use of DDGS has grown exponentially over the past few years due to the increased availability and cost effectiveness of least-cost diet formulations with DDGS. A comprehensive review of the literature indicates that DDGS have a negative effect on fat frmness, but as expected the negative effects are dependent on the level of DDGS and length of time the DDGS are fed (17). It is our contention that the degree of the negative effects may be dependent on the complete diet formulation as well as other factors. For instance, other ingredients may be added that have further detrimental effects on fat frmness. Figure 4 contains IVP's for late fnishing diets from three university trials that we calculated from diet compositions. This fgure clearly illustrates that although the diets use similar levels of DDGS, the effect on fat quality may be different as a result of other dietary ingredients infuencing the IVP. Table 4 contains diets formulated by PIC to illustrate the effect of increasing DDGS in diets without confounding ingredients. As expected, IVP is increased as the DDGS level is increased and diet cost is decreased; however, the IVP level obtained with 30% DDGS is very similar to that obtained with a corn-soy diet with 4% added choice white grease.
Conclusions
Within modern pig genetics, small differences in fat quality will be observed if the genotypes have similar leanness levels, body weights and nutritional planes. The focal point of nutrition should be on the "complete" diet and not individual ingredients within the diets. Efforts to manage fat quality should be aligned with the expectations set forth by pork processors. Pork processors should develop independent monitoring strategies based on economics within their own system and provide feedback to producers.
Selected Key References
Selected Key References
1. Apple et al., 2009. J. Anim. Sci. 87:1423-1440.
2. Barton-Gade, 1987. Livest. Prod. Sci. 16:187-196.
3. Benz et al., 2007. KSU Swine Day Report.
4. Boyd et al., 1997. PIC USA T&D Technical Memo 153.
5. Cameron and Enser, 1991. Meat Sci. 29:295-307.
6. Christensen, 1962. Thesis, KGL. Vet.-og Landbohojsk.,Kobenhavn, p88.
7. Correa et al., 2008. Meat Sci. 80:550-554.
8. Ellis and McKeith, 1999. NPPC Fact Sheet #04422.
9. Enser et al., 1984. J. Sci. Food Agric. 35:1230-1240.
10. Hansen, 2001. CFIA Swine Nutrition Conference, pp 21-32.
11. García-Macías, et al., 1996. Anim. Sci. 63:487-496.
12. Lo Fiego et al., 2005. Meat Sci. 69:107-114.
13. Mayes, P.A., 1996. In: Harper's Biochemistry. 24th Ed. pp109-244.
14. NPPC, 2000. Pork Composition & Quality Assessment Procedures. p32.
15. Nürnberg et al., 1998. Livest. Prod. Sci. 56:145-156.
16. Scott et al., 1981. J. Anim. Sci. 53:977-981.
17. Stein, H. H. and G. C. Shurson, 2009. J. Anim. Sci. 87:1292-1303.
18. Suzuki et al., 2006. J. Anim. Sci. 84:2026-2034.
This article was originally published in the Pic' s Internal Newsletter "Cutting Edge", First Quarter 2010, and was provided to Engormix.com courtesy of Pic North America.
Related topics:
Authors:
PIC Genetics
PIC Genetics
PIC Genetics
PIC Genetics
Show more
Recommend
Comment
Share
19 de octubre de 2010
author has given much improtant information about fat pork quality, there are less Vietnamese article the same as this. however, i need to know how to take loint sample to analyze nutrition in muscular of pig. please tell me!
Recommend
Reply

Would you like to discuss another topic? Create a new post to engage with experts in the community.





.jpg&w=3840&q=75)