New trend line feature for milk components
Published: August 14, 2015
By: Bill Sanchez Ph.D., Dipl. ACAN
In last month’s DairyAdvisor, we introduced “DV Monitors,” a tool that provides real-time regional milk component data from more than 160 leading Holstein herds. Thanks for your input.
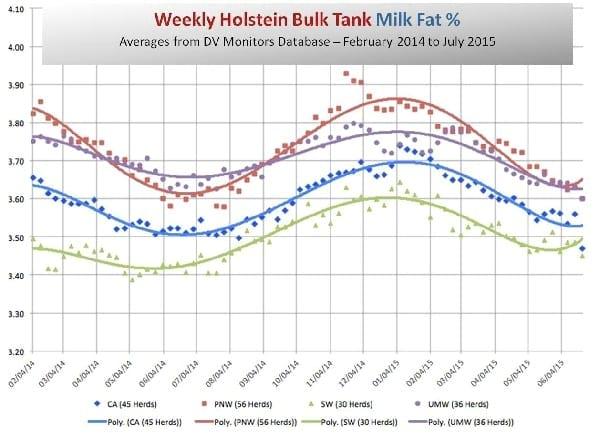
This month we’re providing a new view of the graphed data, showing trend lines as well as data points. Our 18-month “moving window” – currently February 2014 through July 2015 – gives you a balanced view of seasonal shifts and significant regional differences in milk components.
We publish these data from our DV Monitors database to help you put your milk fat and milk protein in perspective.
As you can see from the data points, milk component concentrations have reached their annual lows across all regions. Also, the trend lines indicate that fat and protein percentages in most regions are starting to edge up.
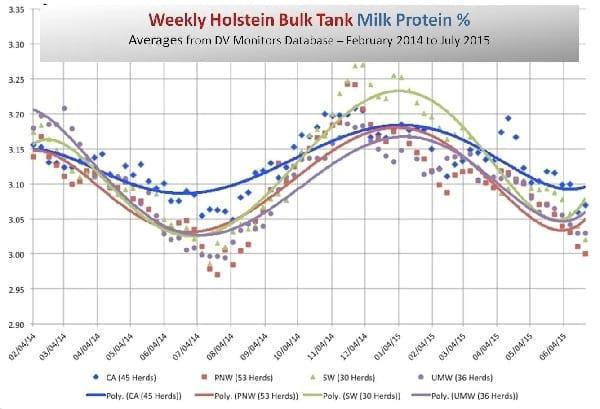
These data come from weekly weighted averages over the past 18 months from 167 leading Holstein herds enrolled in the database for two years or more. We download the information from various milk processor websites for every load of milk and generate the weekly averages across four major dairy regions:
- CA – California (45 herds)
- PNW – Oregon, Washington, Idaho (56 herds)
- SW – Arizona, Nevada, New Mexico, Texas (30 herds)
- UMW – South Dakota, Minnesota, Iowa, Wisconsin, Illinois, Michigan, Indiana, Ohio (36 herds)
The database is large enough to provide an index for all Diamond V customers to compare to other leading herds across both time and region. We summarize the data by breed because it’s hard to compare an individual dairy with milk processor averages in some regions that have large numbers of Holstein and Jersey herds pooled together.
We’re going to continue to provide Holstein milk component data, and, in the next issue of DairyAdvisor, we plan to include averages from Jersey herds.
Based on the consistent, repeatable seasonal patterns that exist for both fat and protein, in coming months DairyAdvisor will include projections, informing you of likely future average milk fat and milk protein values.
A note of caution: It can be difficult to know for sure what may be causing fluctuations in milk components at individual dairies. However, DV Monitors helps rule out the “background noise” of normal variation by providing weekly summaries for comparable high-performing herds. The data reveal important seasonal trends as well as the transient effects of other factors affecting the herds enrolled in the program.
DV Monitors data let you “self index” your dairy’s fat and protein performance against others. For example, if your protein value is much greater than the regional average, then it’s likely that what you and your nutritionist are doing is working. If you are getting a higher milk blend price than it is costing you, then keep doing what you’re doing.
Authors:

Diamond V
Recommend
Comment
Share

Would you like to discuss another topic? Create a new post to engage with experts in the community.
Featured users in Dairy Cattle


José Manuel Oropeza Meza
MSD - Merck Animal Health
Gerente Nacional Cuentas Clave en MSD Salud Animal
United States
United States


Evonik Animal Nutrition
EVONIK ANIMAL NUTRITION is committed to improve sustainability, health and efficiency along the food chain to feed growing population with animal protein.

Balchem Animal Nutrition
Balchem Animal Nutrition and Health is the global leader in choline production for rumen bypass nutrients.