Distillers grains in cattle diets: Opportunity or Challenges
Published: June 7, 2007
By: Dr T. P. Tylutki PhD (Courtesy of AFMA Matrix)
| Ethanol production is increasing globally in response to demands for renewable energy. Distillers grains are one of the byproducts of ethanol production and as ethanol production increases, distillers grains supply increases. At first glance, distillers grains appear to be an excellent feed ingredient due to their moderate protein and energy levels. However, they are a by-product that currently has little or no quality control in production, resulting in high nutrient variability. With some nutrients having a coefficient of variation greater than 40%, and the potential for high fat levels, the feeding value of distillers grains must be discounted. Much debate exists regarding maximum recipe inclusion rates, with some suggesting as much as 30% on a dry matter basis. Given the high variability and potential concerns when other high fat and/or maize based diets are fed (i.e. milk fat depression), a safe maximum inclusion rate would be 10%. |
INTRODUCTION
Distillers grains are not a new feed. Originating from the beverage industry they have been fed for over 100 years in North America. With the recent rapid increase in ethanol production for fuel, the distillers grains (DG) supply has been increasing exponentially. This has resulted in DG becoming more popular as a feed ingredient due to price drops, with some areas in the United States paying nothing more than delivery for wet DG (WDG). Unfortunately, many challenges have also been introduced since there are no production standards for DG as they are a by-product and much variation exists within and between plants. Additionally, in a country such as South Africa where many by-products are fed (e.g. chop), price pressure and dietary problems will occur.
DISTILLERS GRAINS PRODUCTION
Distillers grains from ethanol production represent a by-product that is produced on a rapid basis at modern plants.
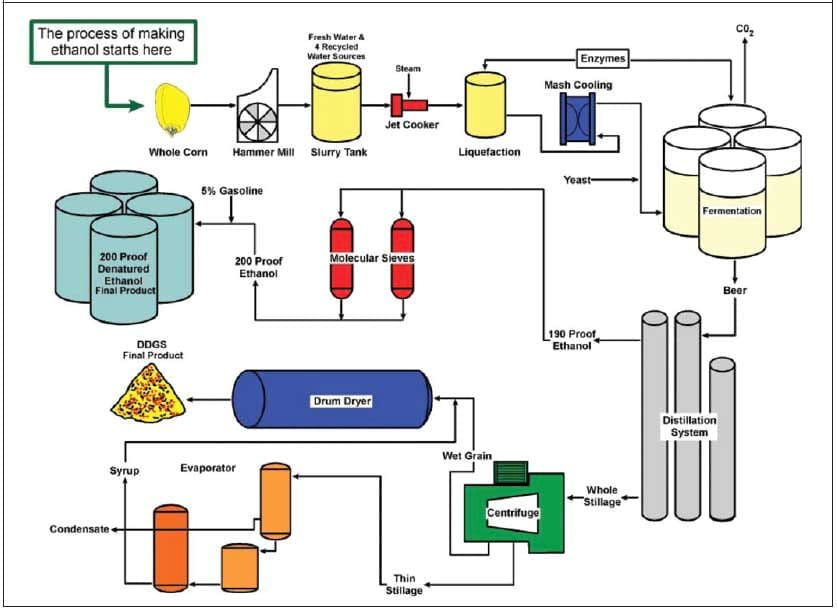
Figure 1 represents a general flow chart of ethanol and DG production. It is a simple process where whole maize is ground, saturated, fermented with yeast and then distilled. Following distillation, the residue is centrifuged to separate the waste stream to produce DG and solubles. There currently is a very limited market for the solubles (that contain oils) and are therefore added back to the DG after water is removed. Ideally, the solubles would be used in the production of bio-diesel; however there are many impurities in the solubles making bio-diesel production infeasible.
Starting with 25.4 kg maize, 9.62l ethanol, 7.72 kg DDG, and 7.72 kg CO2 are produced (Table 1). A standard ethanol plant is designed to produce 370 million litres of ethanol annually. As Table 1 shows, this equates to 34 mt of DDG per hour, assuming the plant is running steady state and 24 hours per day. At 35% DM and a 22 mt lorry load size, this equates to one load of Wet Distillers Grain (WDG) every 15.3 minutes, or 34,249 loads annually.
If 1 kg DDG were fed per cow per day, 715,684 cows would be required to utilize all the DDG from one ethanol plant.
CHEMICAL COMPOSITION OF DISTILLERS GRAINS
The chemical composition of DG has changed over time as the source of DG has changed from beverage to ethanol production. Table 2 shows the chemical composition of DDG from the 1989 Dairy NRC, 2001 Dairy NRC, and a dataset from DairyOne forage analysis lab (data analyzed September 2006) with a typical hominy chop analysis included for comparison. The coefficient of variation (cv) for the DairyOne dataset varies tremendously, especially for soluble protein (45.6% cv) and acid detergent insoluble nitrogen (ADIN) (45.3% cv).
The ADIN variance is directly related to the drying method and speed. Variation in ADIN is of particular concern as this pool is indigestible to mammalian and rumen microbial enzymes. Thus, a high protein value with a high acid detergent insoluble nitrogen (ADIN) will be no more valuable, feeding wise than a lower protein, low ADIN batch.
Distillers grains (and all maize products) are naturally low in lysine, the first limiting amino acid in ruminant and monogastric diets. Lysine is very sensitive to heat damage, therefore it can be expected that increasing ADIN also decreases lysine levels and lysine digestibility. A correlation matrix was developed from the DairyOne dataset (Table 3) with significant (p<0.05) correlations reported with only ADIN/NDIN and ADIN/lignin resulting in correlations over 0.50. These two correlations are logical in that ADIN is a component of NDIN and poor drying practices will also increase lignin. Since lignin binds 2.4 times its mass, this would show that poor drying practices not only decrease protein availability, but also carbohydrate digestibility.
VARIABILITY WITHIN ETHANOL PLANT OF DISTILLERS GRAINS
All feeds have composition variance both within and between plants. The ideal is to locate a production facility that has low internal variance, and ideally, has greater than industry average desirable components (e.g. with DDG, this may mean: high CP, low ADIN, low fat). Additionally, if the plant has lower internal variance than industry variance, a slight premium may be feasible.
However, given the overall mass of DG entering the market, obtaining a premium would be very difficult. That said, as table 4 illustrates, there are plants that exhibit less variability (plant 3). One thing that must be kept in mind when evaluating variance is the number of samples obtained. In this case, utilizing the observed standard deviations, approximately 150 samples are required for crude protein (CP) and fat (over 800 for soluble protein (SP)).
Thus, with only 10 samples, it is questionable if the reported variance is accurate or perhaps the result of ‘selective sampling’. Segregation based upon internal quality measures has occurred in the DG market for years in the United States in both the beverage and ethanol sources. For example, a beverage producer has five grades of DG with two having a brand name associated with the producer, and with the final three marketed as commodity DG. From an ethanol perspective, a cooperative in South Dakota has been working with several ethanol plants to segregate DDG and market a brand name. In an attempt to market all of their DDG, they attempt to move DDG over 2 000 km. While they were successful initially, as more DG enter the market, the premium they have attempted to command is shrinking.
Table 6: Price calculations for distillers grains and chop based upon AMTS. Cattle for a lactating dairy cow
To enlarge the image, click here
Figure 1: Manufacturing Process for Ethanol and Distillers Grains Production (adapted from S. Markham, S. Broderick, J. Montbriand, Commodity Specialists Company. 2003)
To enlarge the image, click here
FEEDING VALUE OF DISTILLERS GRAINS
Any by-product feed has challenges and opportunities in its wake. When soy-oil cake first entered the market, it was a by-product with many of the same consistency and acceptance challenges that face DG today. Until standards are put in place defining DG minimum guarantees, it will (and must) be treated as a by-product. While DG has moderate crude protein levels and highly digestible NDF, concerns regarding variability and fatty acid composition will limit widespread use. Maize oil is high in C18:2 (Table 5) as are other feedstuffs, but coupled with a large variability in total fat content (Table 2), potential detrimental effects are observed. It has been shown by Cornell University researchers (Bauman et al.) that C18:2 can be a precursor to milk fat depression through conjugated linoleic acid isomers.
Additionally, diets deficient in physically effective NDF (i.e. diets in sub-clinical and/or clinical acidosis) magnify the CLA impact on milk fat depression as the pathways are partially rumen pH mediated. Thus, diets based heavily on by-products (as many South African diets are) may be prone to milk fat depression with the addition of high fat DG.
The economics of any feedstuff can be determined with multiple methods (shadow pricing, protein equivalent, and energy equivalent are examples). A more complex method involves analyzing the entire nutritional contributions of a feed using mechanistic models. In this case (as was done here), an example diet for a lactating dairy cow producing 36l milk was formulated using AMTS.Cattle™ (a formulation system utilizing the core biology of the Cornell Net Carbohydrate and Protein System ver. 6.0). The diet contained 50% roughage (maize silage, oat silage, and Eragros hay) with a blend of concentrates (including hominy chop, soy oil cake (SOC), ground maize, etc.).
One kilogram dry matter of DDG, SOC, and chop were then added individually to determine their relative nutritional values (including ME (MJ), MP (g), MET (g), LYS (g), RUP MET (g), and RUP LYS (g)) compared with the basal diet. Mean chemical composition values from Table 2 were used for DDG. Nutrient concentrations were determined and are reported in Table 6. Response ratios (DDG:soy, chop:soy, and DDG:chop) were calculated for each nutrient. These ratios were then used to calculate an equivalent value for each nutrient compared with either SOC or chop. The same ratios were then used to calculate a weighted average value (thus the average price is weighted by nutrient twice: first to determine nutrient equivalent value and second across nutrients to equal SOC or chop).
This method illustrates the importance of increasing microbial yield with SOC having the highest energy, MP, MET, and LYS concentrations (Table 6). With its moderate protein, fat, and NDF levels, DG valuation is difficult as it can be used as either a protein or energy source.
Generally, DG is viewed as a protein source, yet compared with SOC, we find it lower in MP concentration (163 g/kg vs. 200 g/kg for SOC), and given it is maize based, RUP LYS concentrations are 35% of SOC. While moderate in RUP MET, DDG inclusion rates would need to be very high to serve as a MET source and given its low protein value, recipe ‘space’ is challenging. If DDG is viewed as an energy source (compared with chop), one finds that DDG is higher in MP and total MET flow, but with the higher microbial yield from chop, chop supplies more energy (MJ/kg) and total tract LYS flow.
Current market prices were used for SOC and chop to calculate relative values (SOC = R2 100 and Chop = R1 100).
Using this method, DDG is valued at 68% and Chop at 48% the value of SOC. This method does not take into account variability unless multiple evaluations are made. Thus, 68% should be considered the maximum price relationship between DDG and SOC. The high variability, especially associated with ADIN and fat, would suggest that DDG should be discounted to around 50% of the value of SOC. This is an area where on-site quality control and NIR coupled with appropriate software can be extremely powerful. With appropriate QC and NIR calibrations, a value can be determined at delivery; however this approach would need to be negotiated with DDG suppliers.
Several studies have been published evaluating different dietary inclusion rates for DDG in lactating dairy cows. Many of these trials have suggested that as much as 30% of the diet can be DDG.
However, in many of these trials, the positive control was deficient in LYS and milk fat was generally low (less than 3.5%) suggesting that peNDF and other dietary imbalances were involved. Thus, until a well-controlled study is published, it is difficult to recommend inclusion rates greater than 10%.
| CONCLUSIONS Distillers grains are a by-product with very limited QC/QA practices implemented in their production. As more ethanol plants are constructed, the feed industry and animal agriculture will be forced to feed them since they will be inexpensive and in many cases less expensive than maize. They are a very challenging ingredient to utilize efficiently given their poor amino acid pattern and relatively high phosphorus content. Coupled with a high degree of variation, DG should be evaluated on a load to load basis and segregation at the feed mill by quality levels implemented. In cases where large amounts of byproducts are currently fed, total fat and unsaturated fatty acid levels must be watched or else milk fat depression will occur. Until a rumen by-pass LYS source is commercially available (and economical), the risk of depressed animal performance is high and DG inclusion rates should be limited to less than 10%. |
Author: Dr T. P. Tylutki PhD
AMTS LLC, 418 Davis Rd, Cortland NY 13045 USA
 | The previous article is a special collaboration from AFMA South Africa |
Related topics:
Recommend
Comment
Share

Would you like to discuss another topic? Create a new post to engage with experts in the community.
Featured users in Animal Feed


E.S.E. & INTEC
E.S.E. manufactures feed processing equipment, such as: thermo-conditioners, counter-flow coolers, roaster/cookers, extruders and expander.
")
North American Renderers Association (NARA)
NARA advocates for a sustainable food chain, public health and the environment through the production and marketing of our members’ products and services.