Abstract
Protein in the diet (25 Vs 31%), stocking rate (100 Vs 200 fish per m3) and inclusion rate of pantothenic acid, vitamin B5, (10 Vs 20 mg/kg diet) were compared for their effects on blood plasma protein, albumin, urea-N, creatinine, plasma transaminase enzymes (AST and ALT), thyroxin (T3) and growth in Oreochromis niloticus juveniles. Blood total protein, albumin, ALT, T3 and growth were significantly (P<0.001) higher in fish groups fed the high protein diet, while urea-N concentration in blood was significantly (P<0.001) lower. Final body weight and daily weight gain were lower and food conversion rate was higher at the higher stocking density. Blood total protein, albumin, ALT and T3 were lower in fish groups reared at high stocking density. Body weight and daily gain was significantly higher at the higher pantothenic acid inclusion level, while feed conversion ratio was lower. Blood total protein, albumin, ALT and T3 were also elevated. The highest income to the system was from the group fed high protein, reared at low stocking density and fed diets supplemented with 10 mg vitamin B5.
Keywords: Dietary protein level, pantothenic acid; stocking density; growth rate; feed conversion; thyroxin; blood components; water quality, body composition.
Introduction
Dietary protein requirements of several species of tilapia have been estimated to range between 20% and 56% (El-Sayed and Teshima, 1991) and Abo-Elwafa et al. (1995) reported that increasing dietary protein level from 25 to 35% increased growth performance of tilapia fish. Ayyat et al. (2003) found that live body weight of Nile tilapia fish increased significantly (P<0.001) with increasing dietary protein level. Average daily weight gain increased by 37.31% in fish fed 30% crude protein compared to a normal protein diet (25%). Increasing dietary protein levels improved the feed conversion.
Stocking density is a major factor affecting fish growth under farming conditions (Bjornsson, 1994 and Irwin et al., 1999). Ridha (2006) reported that a density of 125 fish/m3 significantly (P<0.05) increased mean weight, daily growth rate and specific growth rate of Nile tilapia compared to 200 fish/m3.
Pantothenic acid (Vitamin B5) is one of the water-soluble vitamins. All B vitamins help the body to convert carbohydrates into glucose, which is burned to produce energy. These B vitamins are essential in the breakdown of fats and protein, and also play an important role in maintaining muscle tone in the gastrointestinal tract and promoting the health of the nervous system, skin, eyes, mouth, and liver (Kimura et al., 1980 and Somer, 1995). Pantothenic acid deficient fish exhibit dermatitis in the form of eroded skin, and clubbed, exudate-covered gill lamellae, fat accumulation or fatty degeneration in the liver and mitochondria in the kidney (Piston and Page, 1982 and Masumoto et al. 1993). Vitamin B5 is also important in maintaining a healthy digestive tract and it helps the body use other vitamins (particularly riboflavin) more effectively. It is sometimes referred to as the anti-stress vitamin because it is believed to enhance the activity of the immune system and improve the ability to withstand stress (Lieberman and Bruning, 1997).
The objective of the present study was to investigate the interactive effects of dietary protein level, fish stocking density and dietary supplementation with pantothenic acid on growth performance, feed efficiency, blood chemistry and body composition of Nile tilapia (Oreochromis niloticus).
Materials and methods
The present study was carried out at the wet Laboratory of the Animal Production Department, Faculty of Agriculture, Zagazig University, Egypt. The experimental period lasted 90 days from July to October, 2006. Fingerlings ofNile tilapia were obtained from the Central Laboratory for Aquaculture Research at Abbassa, Egypt. The experimental fish (average weight 13.7 g after three weeks acclimation under normal laboratory conditions) were randomly distributed into 18 glass aquaria (35 X 40 X 70 cm) in 6 treatments (3 replicates per treatment).
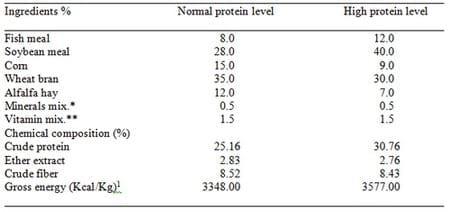
The experiment was based on a 2 x 2 x 3 factorial design with two levels of dietary protein (25% or 31%) and stocking density (100 or 200 fish per m3) and three levels of pantothenic acid (0, 10 or 20 mg per kg diet) each replicated three time. Fish were fed the experimental diets (Table 1) at the rate of 3% of body weight per day and it offered three feedings at 8.00, 12.00 and 17.00 hours. The fish in each aquarium were weighed every 2 weeks, and the feed weight was adjusted after each fish weighing. All fish were individually weighed to the nearest 0.1 gm at the beginning of the experiment and biweekly intervals throughout the experimental period. Feed conversion was calculated according to Berger and Halver (1987).
Blood samples were collected from the caudal vein of three randomly selected fish with a heparinized syringe and the plasma separated by centrifugation at 3000 rpm for 20 min and stored at -20°C until further biochemical analysis. Total protein, albumin (Sundeman, 1964), urea-N, creatinine (Henery, 1974), plasma transaminase enzymes (AST; aspartate amino transferase and ALT; alanine amino transferase (Reitman and Fankel, 1957) and thyroxin (T3) were measured in blood plasma by colorimetric methods using commercial kits. Triiodothyronine hormone (T3) was estimated using a T3 antibody radioimmunoassay kit from Diagnostic Production Corporation, Los-Angeles, California, USA.
Proximate chemical composition of experimental diets and fish body were determined according to AOAC (1980). Water quality parameters were monitored at the end of 6 and 12 weeks of the experimental period before replacing the water in the aquarium.
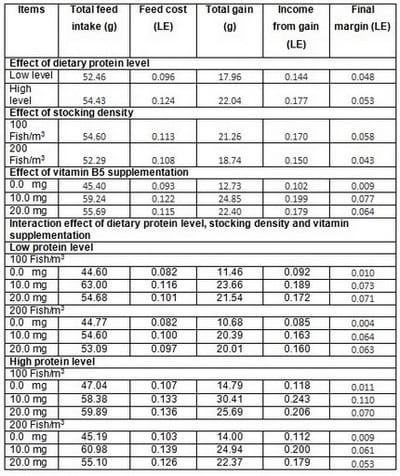
Economic evaluation was calculated as: Margin = Income from body gain weight - Feed cost. Other overhead costs were assumed constant. Price of one kg of diet 25% protein was 1.84 LE (Egyptian pound = 0.185 US$), price of one kg of diet 35% protein was 2.28 LE and price of selling of one kg live body weight of fish was 8.0 LE.
The data were statistically analyzed with SAS (2002) according to the following model:
Yijk = µ + Pi + Dj + Vk + PDVijk + eijk
Where, µ is the overall mean, P is the fixed effect of dietary protein level (I = 1 ...2), D is the fixed effect of stocking density of fish (j = 1 ...2), V is the fixed effect of supplementation of vitamin B5 (k = 1...3), PDVijk is the interaction effect of dietary protein level, stocking density and supplementation of vitamin B5, eijk is random error. Differences between treatments were tested with Duncan´s multiple range test (Duncan, 1955).
Results
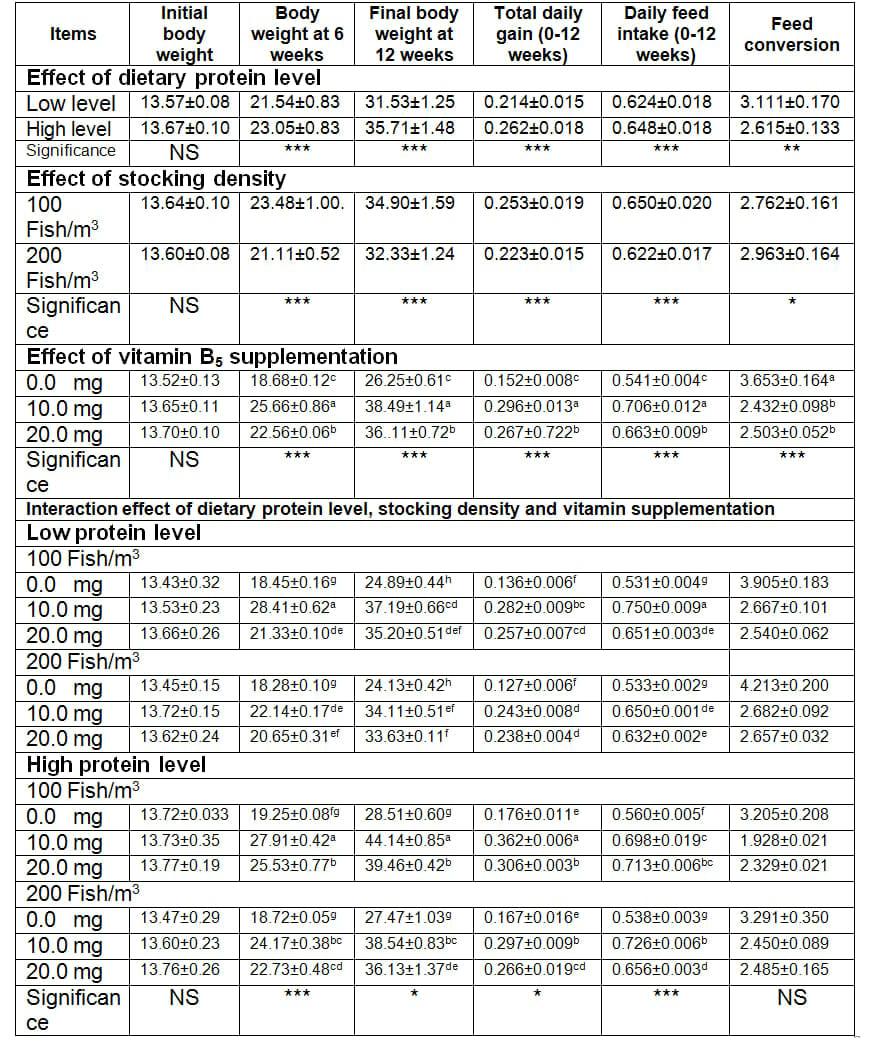
Final body weight and daily weight gain were significantly (P<0.001) higher at the higher dietary protein level (Table 2) and the lower stocking density. Weight gain of Nile tilapia also increased significantly (P<0.001) with increasing pantothenic acid supplementation. There were also significant (P<0.05) interactions among dietary protein level, fish stocking density and vitamin supplementation on body weight gain (Table 2). The best final body weight was obtained in the group fed the high protein diet, reared at low stocking density and fed diets supplemented with 10 mg/kg of vitamin B5.
Daily feed intake increased proportionally to body weight. In addition, increasing dietary protein level, decreasing fish density stocking and dietary vitamin supplementation significantly (P<0.001, 0.01 and 0.05) improved feed conversion during the whole experimental period (Table 2). The fish fed diet supplemented with 10 mg vitamin B5 recorded the best feed conversion ratio during 0-12 weeks, of the experimental period. The interactions among dietary protein level, fish stocking density and vitamin supplementation insignificantly affected on feed conversion (Table 2). The best feed conversion ratio was obtained in the group fed the high protein diet, reared at low stocking density and fed diets supplemented with 10 mg vitamin B5.
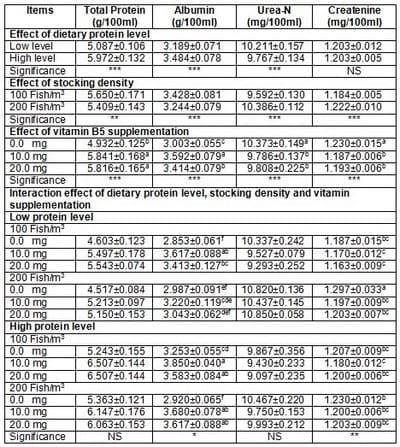
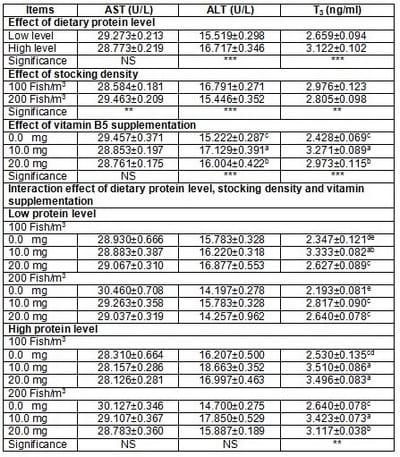
Blood total protein, albumin, ALT and T3 increased significantly (P<0.001) in groups fed the high protein diet, while urea-N concentration in blood significantly (P<0.001) decreased (Tables 3 and 4). Blood total protein, albumin, Alt and T3 significantly (P<0.001 or 0.01) decreased in fish groups reared at high stocking density, when compared with those reared at low stocking density, while the concentration of urea-n, createnine and AST significantly (P<0.001 or 0.01) increased. Blood total protein, albumin, ALT and T3 significantly (P<0.001) increased in fish groups fed diets supplemented with vitamin B5, while urea-N, createnine and AST concentrations significantly (P<0.001) decreased. Tables 3 and 4 show significant interactions among dietary protein level, fish stocking density and vitamin supplementation on albumin, createnine and T3.
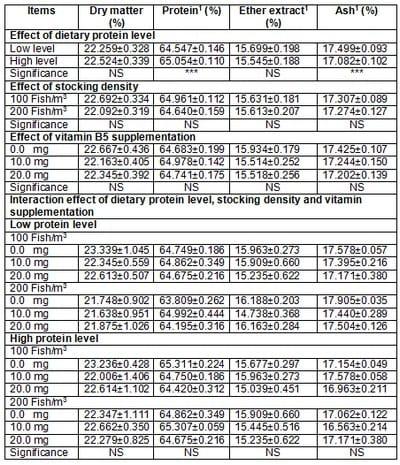
Dietary protein level significantly (P<0.001) affected crude protein and ash content in fish body, while dry matter and ether extract insignificantly effected (Table 5). Protein content in fish body increased with increasing dietary protein level, while ash percent decreased.
Fish stocking density and vitamin supplementation in fish diets insignificantly affected body composition (Table 5). The interaction among dietary protein level, stocking density and dietary vitamin supplementation insignificantly affected body composition.
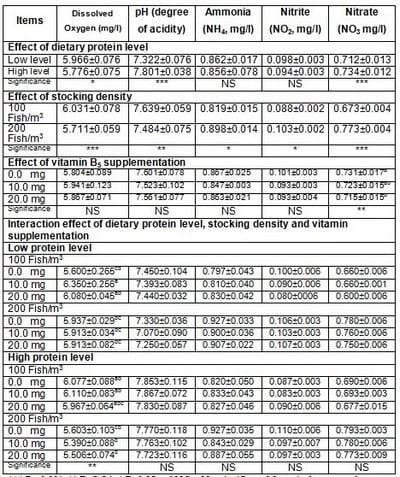
Dietary protein level significantly (P>0.001 or 0.05) affected dissolved oxygen, pH and nitrate, while ammonia and nitrite insignificantly affected (Table 6). The concentration of nitrate and pH in water increased with increasing dietary protein level, while the concentrations of dissolved oxygen decreased.
Fish stocking density significantly (P<0.001, 0.01 or 0.05) affected on all water quality parameters studied (Table 6). The concentrations of dissolved oxygen and pH in water decreased with increasing fish density, while the concentrations of ammonia, nitrite and nitrate increased.
Vitamin B5 supplementation significantly (P>0.01) affected on nitrate, while dissolved oxygen, pH, ammonia and nitrite insignificantly affected (Table 6). The concentration of nitrate in water decreased with increasing vitamin level in fish diets.
The interaction among dietary protein level, stocking density and dietary vitamin supplementation insignificantly affected on pH, ammonia, nitrite and nitrate, while dissolved oxygen significantly (P<0.01) affected (Table 6). Within dietary protein level increasing stocking density decreased the concentration of dissolved oxygen, also within each stocking density decreased the concentration of oxygen in pond water.
Profit analysis:
Feed cost, income from body gain and final margin slightly increased with increasing dietary protein level. On the other hand, increased fish density decreased feed cost, income from body gain and final margin. Increasing dietary vitamin supplementation increased feed cost, income from body gain and final margin (Table 7).
The higher income from body gain and final margin were obtained in fish group fed high protein diet and reared at low stocking density and fed diets supplemented with 10 mg vitamin B5.
Discussion
Pantothenic acid is a component of coenzyme A (CoA), a cofactor that carries acyl groups for many enzymatic processes, and of phosphopantetheine within acyl carrier proteins (ACP), a component of the fatty acid synthase complex. Palmitoyl CoA is also required for the transport of residues through the Golgi apparatus during protein secretion. It is believed that these protein acylations may enable and control specific protein interactions, especially in relation to cell membranes, and proteins that are palmitoylated are generally also found to be associated with the plasma membrane. (Bates, 2005).
Body weight and gain of fish increased as affected by vitamin B5 supplementation in diets. Chavez De Martinez et al. (1990) found that fish fed on the three lowest levels of calciutn pantothenate (0, 10 and 20 mg/kg) exhibited a variety of external signs and high mortalities. Fish fed on the higher inclusion levels (40, 60, 80.120 and 320 mg/kg) did not show external pathologies. It is thus recommended that the diet of C, urophthalmus fry must be supplemented with at least 80 mg calciutn pantothenate/kg diet to give maximum growth and to avoid gross and histological signs of deficiency.
The interaction of vitamin B5 supplementation, dietary protein level and stocking density show significantly effect on body weight and gain, these effect may be attributed to The antioxidant effect of pantothenic acid is due to its stimulation of increased cellular levels of coenzyme A.
Coenzyme A may facilitate removal of lipid peroxides by increasing mobilization of fatty acids, and promote repair of plasma membranes by activating phospholipid synthesis. Pantothenic acid has also been shown to increase levels of cellular reduced glutathione. However, increased levels of glutathione may play a large role in the protective effect of pantothenic acid against peroxidative damage of cell membranes (Slyshenkov et al., 2004). On the other hand Deficiency of sulfur amino acids can result in reduced CoA synthesis. The subtle protein modification, of which depend on CoA and on pantothenic acid, have a wide-ranging significance for many biological processes (Bates, 2005).
Blood total protein, albumin, ALT and T3 increased as increasing of pantothenic acid level in fish diets. From the present state of our knowledge we can only make a practical conclusion that pantothenic acid and its reduced derivative pantothenol may be important factors in prevention of oxidative stress in animal cells and tissues. Webster (1998) reported that pantothenic acid is involved in a number of biological reactions, including the production of energy, the catabolism of fatty acids and amino acids, the synthesis of fatty acids, phospholipids, sphingolipids, cholesterol and steroid hormones, and the synthesis of heme and the neurotransmitter acetylcholine. It also appears to be involved in the regulation of gene expression and in signal transduction. The present results are in agreement with those reported with Soliman and Wilson (1992) and Sayed (2002). Fish fed on diets containing 80-320 mg calcium pantothenate/kg did not show external or histological changes. It is thus recommended that the diet of Cichlasoma urophthalmu fry must be supplemented with at least 80 mg calcium pantothenate /kg diet to give maximum growth and to avoid gross and histological signs of deficiency (Chavez De Martinez, et al., 1990).
Feed cost, income from body gain and final margin increased with 29.27, 22.92 and 10.42%, respectively in fish group fed high protein diet when compared with those fed low protein diet. On the other hand, feed cost, income from body gain and final margin increased with 4.63, 13.33 and 34.88%, respectively in fish group reared at low stocking density when compared with those reared under high density. Fish group fed diet supplemented with 10 mg vitamin B5 recorded higher return from body gain and final margin than the other fish groups. The higher income from body gain and final margin were obtained in fish group fed high protein diet and reared at low stocking density and fed diets supplemented with 10 mg vitamin B5.
In conclusion, the overall results presented here indicate that the best final live body weight, daily gain and feed conversion ratio were obtained in fish group fed high protein diet, reared at low stocking density and fed diets supplemented with 10 mg vitamin B5. Blood total protein, albumin, ALT and T3 increased as increasing of pantothenic acid level in fish diets.
REFERENCES
Abo-Elwafa M.A., El-Ebiary E.H., Nour A.M. and Badawy A.M. (1995). Mass production of Oreochromis fry in concrete ponds. Bull. Natl. Inst. Oceanogr Fish, Egypt, 21: 543-560.
AOAC. 1980. Official Methods of Analysis, 13th Edition. Association of Official Analytical Chemists, Virginia.
Ayyat M.S., Fayza S. Abbas and El-Naggar G.O. (2003). Effect of dietary protein level and vitamin C supplementation on performance of Nile Tilapia (Oreochromis nilotius). Veterinary Medical Journal, Cairo University, Giza, 51 (3): 287-289.
Bates C.J. (2005). Pantothenic acid. on Encyclopedia of Human Nutrition. Second Edition, Published by Elsevier Ltd, Pages, 467-472.
Berger A. and J.E. Halver (1987). Effect of dietary protein, lipid and carbohydrate content on the growth, feed efficiency and carcass composition of striped bass (Morone saxatitis) fingerlings. Aquaculture, 18: 345-356.
Bjornsson B. (1994). Effects of stocking density on growth rate of halibut (Hippoglossus hippoglossus L.) reared in large circular tanks for three years. Aquaculture, 123: 259-270.
Chavez De Martinez, M. C., Escobar, B. L. and Olvera-Novoa, M. A. (1990). The requirement of Cichlasoma urophthalmus (Gunther) fry for pantothenic acid and the pathological signs of deficiency. Aquaculture and Fisheries Management, 21: 145-156.
Duncan D.B. (1955). Multiple Range and Multiple F-test. Biometrics, 11: 1-42.
El-Sayed A.F.M. and Teshima S.I. (1991). Tilapia nutrition in aquaculture. Reviews in Aquatic Sciences, 5: 247-265.
Henery, R.J. (1974). Clinical Chemistry, Principles and Technique, 2nd edition, Harper and Row.
Irwin S., O´Halloran J. and FitzGerald R.D. (1999). Stocking density, growth and growth variation in juvenile turbot, Scophthalmus maximus. Aquaculture, 178:77-88.
Kimura S., Furukawa Y., Wakasugi J., Ishihara Y. and Nakayama A. (1980). Antagonism of L-pantothenic acid on lipid metabolism in animals. J Nutr Sci Vitaminol (Tokyo).26(2):113-7.
Lieberman S., and Bruning N. (1997).The Real Vitamin and Mineral Book. 2nd ed. New York, NY: Avery Publishing Group.
Masumoto, T., Hardy, R.W., and Stickney, R.R. (1993). Pantothenic acid deficiency detection in rainbow trout (Oncorhynchus mykiss). Journal of Nutrition, 124 :430-435.
NRC (1993): Nutrient Requirements of Fish. National Research Council. National Academy Press, Washington, DC, USA.
Piston, H.A. and Page, J.W. (1982). Gross and histological signs of dietary deficiencies of biotin and pantothenic acid in lake trout. Salvelinus Namaycush. Cornell Vef. 72: 242-261.
Reitman and S. Fankel (1957): A method for determination of plasma AST and ALT. Am. J. Clin. Path, 28:56.
Ridha, M.T. (2006): Comparative study of growth performance of three strains of Nile tilapia, Oreochromis niloticus, L. at two stocking densities. Aquaculture-Research; 37: 172-179.
SAS (2002). SAS Institute Inc., Cary, NC, USA. NOTE: SAS Proprietary Software Version 9.00 (TS M0).
Sayed, A.B.N. (2002). Nutritional considerations concerning the requirements of Nile tilapia for riboflavin and Pantothenic acid. Assiut-Veterinary-Medical-Journal. 47 (93): 80-96.
Slyshenkov V.S., Dymkowska D. and Wojtczak L. (2004). Pantothenic acid and pantothenol increase biosynthesis of glutathione by boosting cell energetics. FEBS (Federation of European Biochemical Societies), 569: 169-172.
Soliman A.K. and R.P. Wilson (1992). Water -soluble vitamin requirements of tilapia. 1. Pantothenic acid requirement of blue tilapia Oreochromis aureus. Aquaculture; 104:121-126.
Somer E. (1995). The Essential Guide to Vitamins and Minerals. New York, NY: HarperCollins Publishers, Inc.
Sundeman, M.F.W. (1964). Studies of the serum proteins. Am. J. Clim. Path, 1-21.
Webster M.J. (1998). Physiological and performance responses to supplementation with thiamin and pantothenic acid derivatives. Eur J. Appl. Physiol., 77: 486-491.
Table 1. Ingredients and chemical composition of the experimental diets.
* Each one Kg of mineral mixture contained: Zinc 1.23g, manganese 930 mg, Iron 630 mg, Copper 105 mg and selnium 2.1mg.
** Each one Kg of vitamin mixture contained: Vit. A 72000IU, Vit. B1 6 mg, Vit. B3 12000 IU, Vit. B6 9 mg, B12 0.06 mg, Vit E 60 mg, Vit. K 12 mg, Pantothonic acid 60 mg, Nicotinic acid 120 mg, Folic acid 6 mg, Biotin 0.3 mg and Choline chlorids 3mg.
1 Calculated according to NRC (1993).
Table 2. Live body weight and gain (g), feed intake (g) and feed conversion (g food/g gain) of Nile tilapia as affected by dietary protein level, stocking density and dietary vitamin B5supplementation and their interactions.
*** P< 0.001, * P<0.05 and N.S = Not significant. Means in the same column within each classification bearing different letters are significantly (P<0.05) different.
Table 3. Plasma total protein, albumin, urea-N and createnine of Nile tilapia as affected by dietary protein level, stocking density and dietary vitamin B5 supplementation and their interactions.
*** P< 0.001, **P<0.01, * P<0.05 and N.S = Not significant. Means in the same column within each classification bearing different letters are significantly (P<0.05) different.
Table 4. Plasma aspartate amino transferase (AST), alanine transferase (ALT) and thyroxin (T3) of Nile tilapia as affected by dietary protein level, stocking density and dietary vitamin B5 supplementation and their interactions.
*** P< 0.001, ** P<0.01 and N.S = Not significant. Means in the same column within each classification bearing different letters are significantly (P<0.05) different.
Table 5. Whole body composition of Nile tilapia as affected by dietary protein level, stocking density and dietary vitamin B5supplementation and their interactions.
1 = On dry matter basis, *** P< 0.001 and N.S = Not significant.
Table 6. Water quality as affected by dietary protein level, stocking density and dietary vitamin B5supplementation and their interactions at the end of the experimental period (12 weeks).
*** P< 0.001, ** P<0.01, * P<0.05 and N.S = Not significant. Means in the same column within each classification bearing different letters are significantly (P<0.05) different.
Table 7. Profit analysis as affected by dietary protein level, stocking density and dietary vitamin B5supplementation and their interactions.




.jpg&w=3840&q=75)