Distribution of trypsin inhibitor and urease activity in soy products in different countries and world areas


It seems a very interesting work. I wonder If I can get an electronic version of the publication please?.

Although I am a regular attendant of the International Poultry Scientific Forum (IPSF) in Atlanta, for some unknown reason I missed this presentation at the 2019 IPSF. It would be interesting to see the whole set of data since you (Chen et al, at Novus International) assert that trypsin inhibitors and urease activity are poorly correlated in solvent-extracted soybean meal samples. We don´t know how many of the 414 samples were actually solvent-extracted soybean meals, and it is not clear if you actually evaluated the correlation using soybean meal data along with full-fat soybeans. So, I cannot comment further until having the opportunity to see the whole set of data from which you derived your conclusions. In the mid-time, however, let me share with the large audience of Engormix:
FIRST the data that Ruiz presented at the 2012 Arkansas Nutrition Conference [New insights on the urease activity range for soybean meal: a worldwide opportunity for the poultry industry] in which 104 commercial soybean meal samples that included Argentine, Brazilian, Bolivian, Colombian and US soybean meal samples, all of them solvent-extracted were analyzed for both urease activity and trypsin inhibitors:
Table 1. Correlation between trypsin inhibitors and urease activity in 104 samples of soybean meal
(Belalcázar and Otálora, 2012)
|
Trypsin Inhibitors, |
Urease Activity, |
|
Trypsin Inhibitors, |
UreaseActivity, |
|
1.75 |
0.015 |
|
5.50 |
0.292 |
|
1.81 |
0.024 |
|
7.00 |
0.382 |
|
2.02 |
0.040 |
|
7.50 |
0.450 |
|
1.81 |
0.011 |
|
6.00 |
0.290 |
|
2.00 |
0.023 |
|
6.00 |
0.276 |
|
1.70 |
0.005 |
|
9.00 |
0.530 |
|
1.92 |
0.032 |
|
4.00 |
0.152 |
|
3.56 |
0.120 |
|
6.20 |
0.321 |
|
3.60 |
0.120 |
|
5.50 |
0.285 |
|
3.71 |
0.129 |
|
5.20 |
0.257 |
|
1.90 |
0.021 |
|
7.50 |
0.430 |
|
2.10 |
0.032 |
|
8.00 |
0.502 |
|
3.56 |
0.108 |
|
9.50 |
0.550 |
|
3.40 |
0.127 |
|
9.00 |
0.510 |
|
1.82 |
0.020 |
|
7.90 |
0.452 |
|
1.88 |
0.014 |
|
8.20 |
0.445 |
|
2.15 |
0.025 |
|
7.00 |
0.412 |
|
2.25 |
0.020 |
|
6.50 |
0.320 |
|
2.30 |
0.024 |
|
7.25 |
0.355 |
|
1.95 |
0.020 |
|
6.90 |
0.402 |
|
1.95 |
0.050 |
|
6.50 |
0.482 |
|
2.10 |
0.049 |
|
6.00 |
0.320 |
|
2.82 |
0.050 |
|
5.50 |
0.300 |
|
2.18 |
0.060 |
|
7.90 |
0.450 |
|
2.12 |
0.047 |
|
5.82 |
0.320 |
|
2.02 |
0.020 |
|
5.75 |
0.290 |
|
2.09 |
0.031 |
|
5.50 |
0.310 |
|
1.80 |
0.020 |
|
6.80 |
0.405 |
|
2.09 |
0.031 |
|
5.95 |
0.300 |
|
1.80 |
0.020 |
|
7.00 |
0.480 |
|
1.78 |
0.007 |
|
6.85 |
0.350 |
|
1.75 |
0.010 |
|
6.92 |
0.420 |
|
1.65 |
0.000 |
|
7.12 |
0.440 |
|
4.50 |
0.198 |
|
5.92 |
0.325 |
|
3.05 |
0.080 |
|
5.40 |
0.285 |
|
2.85 |
0.030 |
|
5.00 |
0.312 |
|
1.70 |
0.000 |
|
6.52 |
0.425 |
|
2.10 |
0.060 |
|
6.20 |
0.355 |
|
3.80 |
0.090 |
|
6.90 |
0.415 |
|
1.80 |
0.020 |
|
4.20 |
0.250 |
|
1.76 |
0.020 |
|
4.07 |
0.157 |
|
2.15 |
0.050 |
|
6.40 |
0.335 |
|
1.55 |
0.000 |
|
4.00 |
0.146 |
|
1.50 |
0.000 |
|
9.50 |
0.600 |
|
1.62 |
0.000 |
|
8.24 |
0.480 |
|
1.72 |
0.060 |
|
7.20 |
0.420 |
|
1.85 |
0.016 |
|
6.95 |
0.380 |
|
1.88 |
0.032 |
|
9.20 |
0.520 |
|
3.50 |
0.107 |
|
|
|
|
2.10 |
0.009 |
|
|
|
|
3.80 |
0.139 |
|
|
|
|
3.96 |
0.142 |
|
|
|
|
1.75 |
0.006 |
|
|
|
|
1.70 |
0.001 |
|
|
|
|
2.14 |
0.024 |
|
|
|
|
3.20 |
0.072 |
TI = (0.1224 + UA)/0.0738 |
|
|
|
|
|
R-square = 0.9748 |
|
|
SECOND, neither Ruiz, nor Belalcázar and Otálora were the first to report the urease activity:trypsin inhibitor correlation. It was precisely the observation of the data published by Mustakas et al. in 1981 [Mustakas, G.C., K.J. Moulton, E.C. Baker, and W.F. Kwolek. 1981. Critical processing factors in desolventizing-toasting soybean meal for feed. JAOCS 58: 300-305] which caused us to think if our data may follow similar trends as Mustakas et al.'s data:
Table 2. Correlation between trypsin inhibitors and urease activity in 24 samples of soybean meal
(Mustakas et al., 1981)
|
Trypsin Inhibitors, |
Urease Activity, |
|
Trypsin Inhibitors, |
Urease Activity, |
|
3.3 |
0.03 |
|
4.8 |
1.24 |
|
2.6 |
0.27 |
|
2.7 |
0.17 |
|
3.7 |
0.35 |
|
8.2 |
1.83 |
|
4.3 |
0.20 |
|
4.6 |
1.05 |
|
5.2 |
1.61 |
|
2.9 |
0.15 |
|
8.5 |
1.92 |
|
3.4 |
0.11 |
|
4.1 |
0.36 |
|
3.7 |
0.45 |
|
6.1 |
1.04 |
|
7.7 |
1.18 |
|
2.8 |
0.02 |
|
1.6 |
0.05 |
|
6.1 |
1.36 |
|
8.3 |
1.97 |
|
5.7 |
0.33 |
|
7.5 |
1.69 |
|
2.7 |
0.02 |
|
3.6 |
0.21 |
|
|
|
R-square = 0.8053 |
|
|
And indeed, our data showed a similar trend as Mustakas et al. (1981). An important point to note is that Mustakas and co-workers were not investigating the relationship itself. The objective of their paper as the title indicates was to study critical factors of the solvent-extraction process in a USDA pilot plant. They just happened to report a large number of variables that they determined in their study among them urease activity and trypsin inhibitors. The only thing Ruiz did was to isolate the two columns of data (this is, the urease activity data and the trypsin inhibitor data) for their 24 samples and ran a correlation. Mustakas and co-workers did not quantify the correlation, but the data are there!
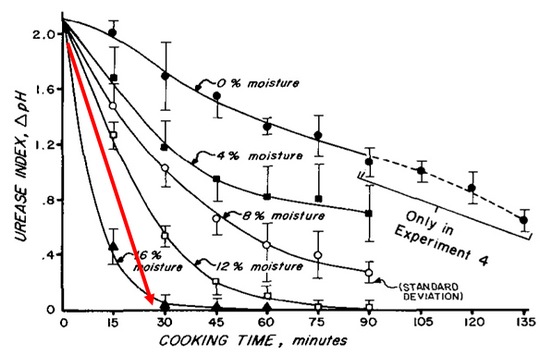
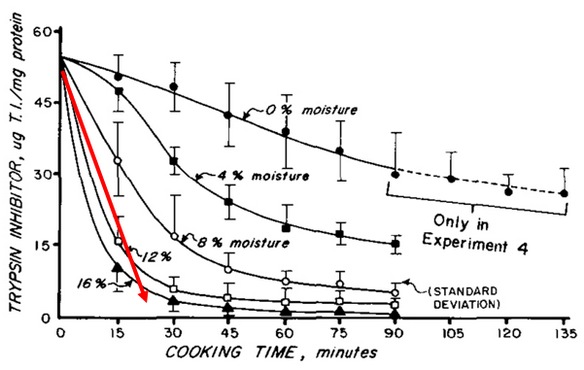
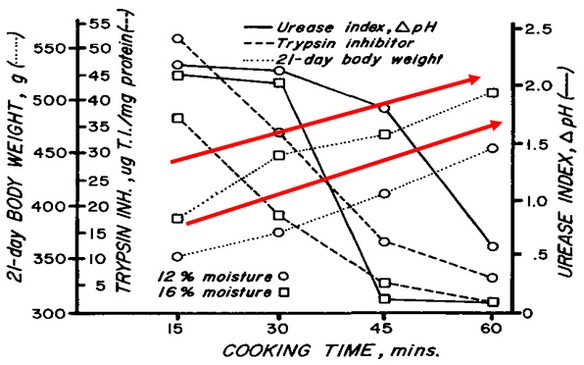
THIRD, a further investigation on the historical observation of the correlation led us to the paper by McNaughton and Reece [Effect of moisture content and cooking time on soybean meal urease index, trypsin inhibitor content, and broiler growth. Poultry Sci. 59: 2300-2306 (1980)] in which these authors assert that they found a 0.91 R-square value between urease activity and trypsin inhibitors. They did not publish the whole data, and in a recent personal communication with Dr. McNaughton he told us that he did not preserve the original data. However, in their paper they illustrated graphically how as urease activity descended from 2.0 delta pH to near zero, the trypsin inhibitor values also descended from approx. 50 to 5 µg of trypsin inhibitors/mg of protein, and more importantly they also plot the body weight of 21-day old chicks fed diets containing the experimental soybean meals to illustrate the improvement in growth as a consequence of the correlated descend of urease activity and trypsin inhibitors. Of course, the antinutritional factors are the trypsin inhibitors and their reduction caused the improvement in growth, and urease activity served ONLY as a marker:
(From McNaughton and Reece, 1980)
(From McNaughton and Reece, 1980)
FOURTH, again as we don't know if Chen et al. (2019) report of a poor correlation between urease activity and trypsin inhibitors included both soybean meal AND full-fat soybean samples, it is important anyway to emphasize that in full-fat soybeans there is no such thing as a correlation between urease activity and trypsin inhibitors. We reported at the 2018 IPSF(Abstract T157, p.46) that using a database of 138 full-fat soybean samples originated from Brazil, Panamá, Perú and Colombia and generated by wet-extrusion, toasting and steam-cooking no correlation urease activity:trypsin inhibitors was found (R-square, 0.057). Therefore, if data from soybean meal samples are mixed with data from full-fat soybean samples, then it will result in a poor correlation. Why soybean meals by solvent-extraction across different processing plants in different countries display a high correlation urease activity:trypsin inhibitors and no correlation is observed across different full-fat soybean processes? Because the correlation urease activity:trypsin inhibitors is process related. While the solvent-extraction process for soybean meal is a highly standardized process worldwide, there are as many full-fat soybean qualities as processes exist. A critical point is that the location of the enzyme urease in the bean is in the cytosol while trypsin inhibitors are located in specific organelles. Therefore, while in the solvent-extraction process the flaking step equalizes the exposition of both urease activity and trypsin inhibitors to heat in the desolventizer-toaster (D-T), each full-fat soybean process deals with the bean in a different peculiar way: in some processes the whole raw bean is what enters the process while in others previous grinding is involved, and in some others the raw beans pass first through pre-conditioners, etc. etc.. Consequently, there is no such thing as a "standard" full-fat soybean process. Each one is different, resulting in no correlation when compared across processing methods.
FIFTH, and final point: even though there are some European soy experts asserting that the urease activity test is useless as a quality control tool for soybean meal the historic reality is that for decades the oilseed industry has utilized the urease activity test as a guideline to generate excellent quality soybean meal. So, if urease activity is not correlated to antinutritional factors such as trypsin inhibitors (and lectins) then to what is correlated? We all know, at least until now that urease is not toxic! Certainly, urease activity is not useful to detect overprocessing as recently pointed out by Dr. Julian Wiseman (University of Nottingham) in Engormix, but the urease activity test (either by the US method or by the European method) is useful to detect UNDERPROCESSING precisely because is correlated to trypsin inhibitors as indicated in SECOND and THIRD above. What apparently some European soy experts do not understand is that with the appearance in the field of the rapid feed passage syndrome (tránsito rápido in both Spanish and Portuguese) the urease activity RANGE that worked for over 40 years became outdated [Ruiz, N., and F. de Belalcázar. 2005. Field observation: Trypsin inhibitors in soybean meal are correlated with outbreaks of feed passage in broilers. Poult. Sci. 84(Suppl. 1):70.]. Did it become outdated because suddenly the correlation urease activity:trypsin inhibitors stopped working? No, what happened was that at the beginning of the 1990s when the syndrome was first reported [Kouwenhoven, B., R.M. Dwars, J.F.M. Smeets. 1992. Wet litter and high feed conversion, a new problem in broilers. Pages 558-561. Vol. 1. In: Proceedings XIX World’s Poultry Congress. WPSA. Amsterdam] two different events had occurred: one that passed almost unnoticed, that soybean meal had become the number one supplier of digestible amino acids for poultry and swine feeds worldwide with soybean meal inclusions of 30-35% in broiler feeds. And another, well noticed and documented, that the broiler chicken had dramatically evolved over the years [Havenstein, G.B., P.R. Ferket, S.E., Scheideler and B.T. Larson. 1994. Growth, livability and feed conversion of 1957 vs. 1991 broilers when fed “typical” 1957 and 1991broiler diets. Poult. Sci. 73:1785-1794] resulting in a very efficient animal but with a large feed intake whose composition exceeded the level of trypsin inhibitors tolerable by modern broilers. Excess trypsin inhibitor consumption results in rapid feed passage (unless rancid fats are the culprit) in the field [Ruiz, Ángel, Rojas, Sorbara and Miles, 2015. Trypsin inhibitors tied to rapid feed passage. Feedstuffs, January 26 issue] which today we know has been observed worldwide. The INDIRECT measurement of those trypsin inhibitors was urease activity in the range of adequacy 0.05-0.20 pH units since the end of the 1940s [(Bird et. al.. 1947. J. Asso. Official Agr. Chem. 30:354-364)], but now the conditions have CHANGED in such a way that the urease activity range has to be reinterpreted, and the current suggested new range for solvent-extracted soybean meal is 0.000-0.050 pH units which correlates with approximately 1.65 to 2.35 mg of trypsin inhibitors/mg (or ~ 3-4 TIU/mg) of soybean meal, see regression in FIRST above. So, with all due respect to my Novus International colleagues your assertion that "urease activity should not be used as a surrogate indicator of TI content" in soybean meal is not consistent with our data and the supporting scientific literature. Now, that measuring trypsin inhibitors DIRECTLY is the best way to go, no doubt about it! However, please go to the nearest oilseed processing plant in the United States and ask the plant manager what is the trypsin inhibitor content of the soybean meal they are producing and shipping today and the response very likely (if not for sure) is "I have no idea", but for sure he or she knows what is the urease activity of their soybean meal day after day, because that is the parameter that the oilseed industry hardly understands. Finally, please ask the same question to NOPA (National Oilseed Processors Association) and they will show you that in their current trading rules approved in October 2018 (and that were first published in 1933) in the definition of quality of soybean meal they have ever recognized urease activity as a measurement of quality much less they will admit specs for trypsin inhibitors! Nelson Ruiz Nutrition, LLC; nelsonruiz@nelsonruiznutrition.com; +1-404-543-6249.


.jpg&w=3840&q=75)