INTRODUCTION
The largest costs in poultry meat and egg production are for feed. Feed cost minimization is dependent on determining the proper blend of ingredients to provide the desired nutrient levels. The desired nutrient levels should be those that result in the greatest differences in returns from meat and eggs sold and feed costs. Ler-man and Bie (1975) demonstrated the importance of knowing the variation in ingredients and variation in expected responses from different nutrient levels for profit maximization.
Phosphorus is usually considered the third most expensive component of poultry feeds, after energy and protein. The majority of plant-origin feed ingredient P is in the form of phytate and unavailable to poultry without phytase. Phytase may come directly from ingredients, such as wheat, or be supplemented from microbial origin products. Grain phytases are not as efficient as microbial phytase (Phillippy, 1999; Rapp et al., 2001). Therefore, the amount of phytate in feed ingredients is very important. Despite its importance, there are relatively few reports of phytate P determinations in poultry feed ingredients. A search of the scientific literature for phytate P determinations found 45 for corn, 62 for soybean meal, 6 for distillers dried grains with solubles (DDGS), 106 for wheat, 23 for canola meal, and 6 for wheat middlings (Nelson et al., 1968; Kirby and Nelson, 1988; Eeckhout and de Paepe, 1994; Ravindran et. al., 1994; García-Estepa et al., 1999; Hid-végi and Lásztity, 2003; Selle et al., 2003; Godoy et al., 2005; Kwanyuen and Burton, 2005; Lumpkins and Batal, 2005; Steiner et al., 2007; Liu and Han, 2011). These measurements were made over a 37-yr period in various locations around the world, including North and South America, Europe, Australia, and Sri Lanka. Therefore, their applicability to contemporary feed formulation at any particular locale is questionable.
Variation in feed ingredient composition can come from many sources. The largest sources of variation in feed ingredients include the particular cultivar grown, the growing conditions, and the technological processes. Moisture, rainfall, the water-holding capacity of the soil, and fertilization rates are the major sources of variation in growing conditions. Phosphorus fertilization rates are particularly important in determining the amount of phytate P in plant-based feed ingredients (Zhou et al., 1992).
The samples analyzed in this study were collected from poultry producers in North America for the purpose of determining proximate composition, calcium, phosphorus, and phytate phosphorus levels. The inter-relationships among ingredient components were calculated, particularly to determine the factors affecting the phytate phosphorus compositions of the feed ingredients and how to predict them.
MATERIALS AND METHODS
Samples of approximately 500 g of the common poultry feed ingredients [corn, soybean meal, corn DDGS, bakery by-product meal (BPM), wheat, wheat middling, canola meal, and wheat shorts] were mailed to our laboratory from poultry feed mills in North America and Canada during 2009. There were 133 corn, 114 soybean meal, 89 corn DDGS, 95 bakery BPM, 22 wheat, 31 wheat middlings, 21 canola, and 15 wheat shorts samples. They were stored at 2°C until analysis. The samples were reduced using a feed sample divider and finely ground through a 1-mm sieve.
Total N was analyzed using the Dumas combustion procedure (Buckee, 1994), and CP (6.25 × %N) was estimated. Ash was determined by the AOAC (1995) method 923.03. The samples were then analyzed for neutral detergent fiber (NDF) and acid detergent fiber (ADF) based on the ANKOM modification (ANKOM, 2006) of the Van Soest procedure (Van Soest et al., 1991), using an ANKOM 200 fiber analyzer (ANKOM Technology, Macedon, NY). The only change was that the samples were placed in the agitator for 60 min instead of the 75 min that ANKOM recommends. The samples were repeated when there was greater than 5% variation between duplicate samples. The extraction procedure was run twice to make sure that all soluble components were extracted and there was little difference between the samples extracted one or 2 times. Fat was measured using ANKOM Technology method 2 (ANKOM Technology) based on AOCS (2004) official procedure Am 5–04.
Two to 4 g of each sample were then weighed into a crucible and ashed at 600°C in a muffle furnace over-night. Samples were cooled, and 10 mL of concentrated HCl was added. The crucibles were then placed on a 100°C hot plate for 10 min, after which samples were again cooled and 10 mL of deionized water was added. Samples were then filtered through Whatman 541 filter paper before being loaded into the Technicon auto analyzer (Technicon Auto-Analyzer, Technicon Corp., Tarrytown, NY) for Ca (Hill, 1965) and total P (O’Neill and Webb, 1970) determination. The method of Latta and Eskin (1980) was used to determine phytate P.
The values for the proximate analysis in feed ingredients, based on DM, were analyzed using SAS Institute (2006) procedures. The correlations between nutrients in feed ingredients were calculated. The effect of total phosphorus on the phytate P of feed ingredients for poultry, based on type III sum of squares, was deter-mined using Model: phytate phosphorus = β0 + β1x (total phosphorus). The SAS GLM procedure was used to determine the best fit regression models for estimating the influence of proximate analysis on the phytate P of feed ingredients for poultry.
RESULTS AND DISCUSSION
Because of the great diversity of feed ingredient samples and analytical techniques, it is difficult to compare values in Table 1 with those in the scientific literature. The nutrient requirements of poultry (NRC, 1994) book and feedstuffs ingredient analysis table (Feedstuffs, 2010) are perhaps the most widely used references for feed ingredient composition. Some general comparisons to them may be helpful: The NRC values for the most important cereals (corn and wheat) were all within the 2 SD of what was found (Table 1). Our samples of corn and soybean meal had lower CP values than expected from the ingredient composition tables. For corn, our average CP value of 7.799% was 82 and 89% of the NRC and Feedstuffs tables, respectively. Soybean meal had lower protein than expected from the ingredient composition tables. Its average value was 1.397 and 2.957% lower than the NRC and Feedstuffs tables, respectively. Soybean meal had more total P than expected from the NRC (1994) table.
Corn DDGS samples (Table 1) had almost identical CP to what would be expected from the NRC (1994) and Feedstuffs (2010) tables. The corn DDGS samples had much more fat than expected from either source, nearly 20% more. The Ca content of corn DDGS was much less than either literature source. It was only 17% of the NRC table value, whereas it was 20% of the Ca content listed in the Feedstuffs (2010) table. It had more total P (0.96% vs. 0.77%) and less phytate P (0.26% vs. 0.35%) than indicated in the NRC (1994) table.
Bakery BPM is by its nature highly variable, it contains unconsumed products originally intended for humans. The bakery BPM samples in the current study had more protein, fiber, Ca, and P but less fat than in the ingredient composition tables.
Wheat middlings had more protein, fiber, and total and phytate P than expected from the ingredient composition tables. The Ca content of wheat middlings was quite low and was 78 and 56% of the NRC and Feedstuffs table values, respectively. Wheat shorts were more consistent with the ingredient composition tables, with only fiber, total P, and ash table values being out-side 2 SD of the determined means.
The canola meal samples tested were similar to ingredient composition table values, except for higher levels of fiber and total phosphorus. It had lower Ca and phytate P contents than expected from the nutrient composition tables. Considering that the cultivars grown throughout North America have been subject to intense genetic selection between the time of the NRC (1994) samples and the current samples, it is not surprising that some large differences between the sources (Table 1 vs. NRC, 1994 and Feedstuffs, 2010) were found.
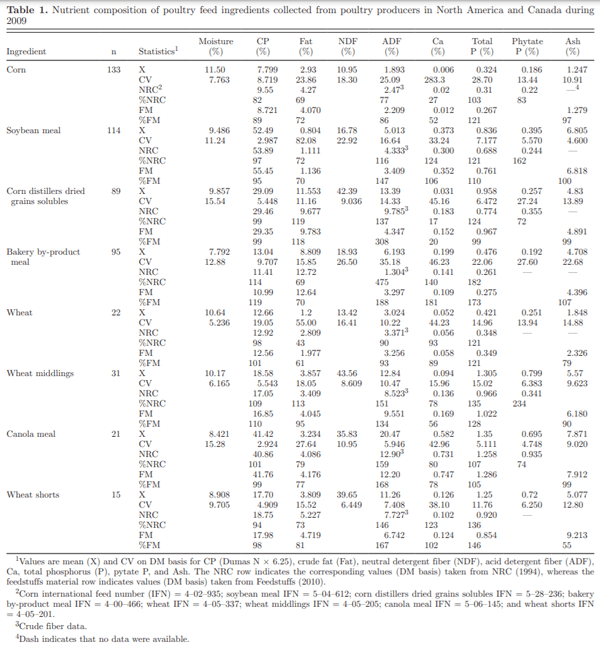
The phytate phosphorus content of our samples were all very similar to values in the scientific literature (Nelson et al., 1968; Kirby and Nelson, 1988; Eeckhout and de Paepe, 1994; Ravindran et al., 1994; García-Estepa et. al., 1999; Hidvégi and Lásztity, 2003; Selle et al., 2003; Godoy et al., 2005; Kwanyuen and Burton, 2005; Lumpkins and Batal, 2005; Steiner et al., 2007; Liu and Han, 2011). The phytate P contents found in corn and corn DDGS were about 0.034 and 0.093% lower than the values of the other reports, respectively. Canola meal was found to have about 0.25% lower phytate P than expected from the NRC (0.695% vs. 0.94%). Soybean meal samples in Table 1 averaged 0.16% higher than the average of others (0.40% vs. 0.24%). It showed an increase of 12.5% in the percentage of phytate P of soybean meal during the past 2 decades. The largest discrepancies between the values in Table 1 and literature values were for wheat middlings. This is not surprising given that we measured 31 samples from the United States whereas the literature only has one sample from Illinois (Nelson et al., 1968) and 5 from Belgium (Eeckhout and de Paepe, 1994).
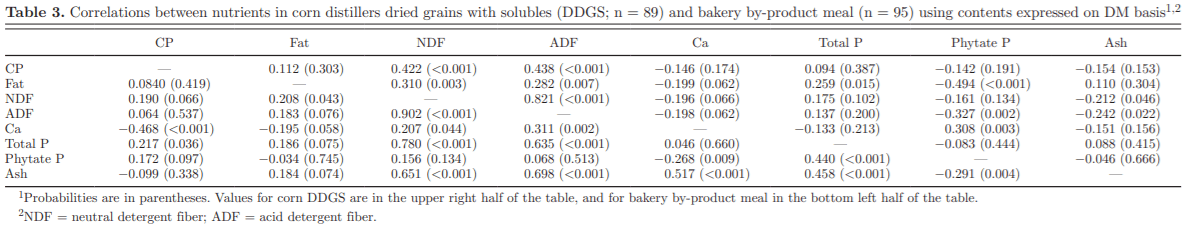
There was considerable variation found in most of the ingredient components. Twenty-two of the 64 CV in Table 1 were below 10.0%. The calcium contents of the ingredients were the most variable, followed by the fat contents. The CP contents were the least variable. There were some fairly consistent relationships observed across samples (Tables 2, 3, 4, 5). For instance, ADF and NDF were generally positively correlated, as were ash and mineral levels, except for canola meal. The fat content of corn was found to be negatively related to the NDF content (Table 2). Crude protein and fiber levels were positively related, but the relationships were not strong. Phytate P was often found to be positively related to ash and total P, as expected, but also to Ca and CP levels.
Among SBM samples (Table 2), CP was negatively related to ash, Ca, and ADF levels, and fat levels were found to be negatively related to fiber levels. Phytate P was found to be positively related to both total P and CP levels.
For corn DDGS, ash and fiber were found to be negatively related as might be expected, but higher levels of CP were associated with higher levels of fiber (Table 3). Higher levels of fiber were also associated with higher levels of fat. Phytate P was positively associated with Ca level but negatively associated with ADF and fat levels.
Higher levels of fiber in bakery BPM were associated with higher levels of ash, Ca, and total P and fat (Table 3). Phytate P was negatively associated with ash and Ca levels but positively associated with total P levels.
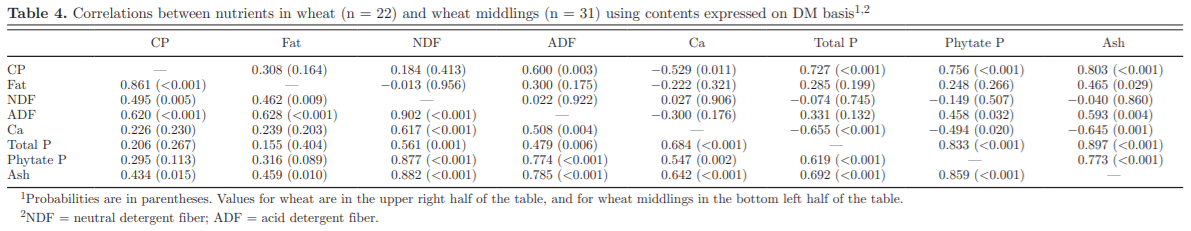
Surprisingly, the fat content of wheat was positively associated with its ash content (Table 4). Higher CP contents were positively associated with total P and ADF contents but negatively associated with Ca contents. Phytate P content was positively associated with ash, total P, and ADF contents but negatively associated with Ca levels.
Wheat middlings had strong positive relationships among fiber and mineral contents (Table 4). Fat content was positively associated with ash, CP, and fiber contents. Phytate P content was positively associated with ash, Ca, and total P contents as well as NDF and ADF.
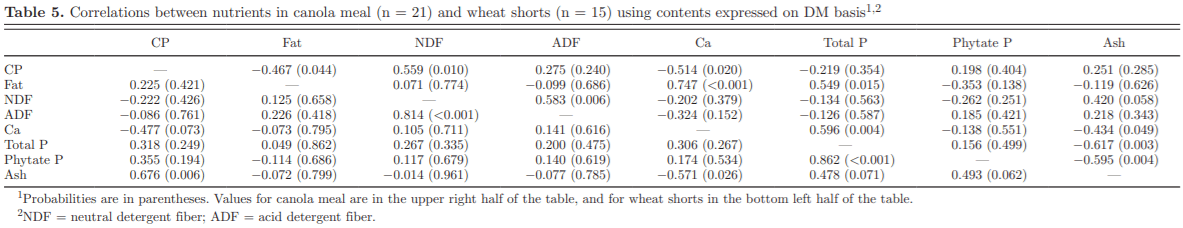
The fat content of canola meal was positively associated with Ca and total P contents (Table 5). Surprisingly, the ash content of canola meal was negatively associated with Ca, total P, and phytate P contents. The CP content of canola meal was found to be positively related to NDF and negatively related to fat and Ca levels. This suggests that NDF should be negatively related to fat and Ca levels, but that was not found to be significant at P < 0.05. The magnitude of variation between samples and sample size may account for the lack of significant findings. Clearly, there is much unexplained variation between samples.
Perhaps because of the smallest sample size, 15, few significant correlations were found in wheat shorts. Higher total P was associated with higher phytate P, and higher ash contents were associated with higher CP contents.
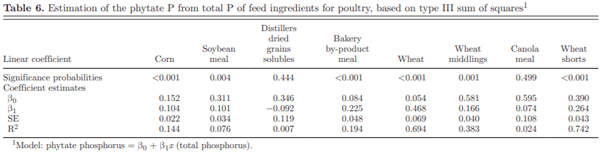
Significant (P < 0.004) linear regressions were found between phytate P and total P for corn, soybean meal, bakery BPM, wheat, wheat middlings, and wheat shorts (Table 6). The average proportion of nonphytate P (NPP) in total P was 49.8%, ranging from 38.8% for wheat middlings to 73.2% for corn DDGS.
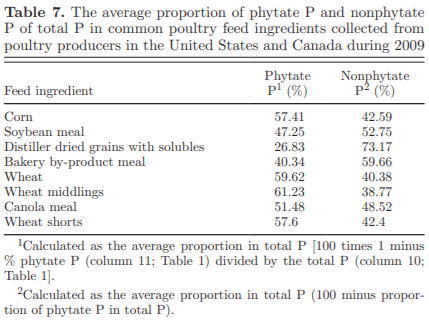
Because exogenous phytase is now added to many poultry feeds, it is particularly important to know how much phytate is present in feed ingredients. A proportion of about 33% has often been used to estimate the proportion of NPP in total P of plant-origin feed ingredients. The actual proportion is very close to 50% (Table 7) but varies considerably depending on the particular ingredient. Wheat products and corn are all around 40% NPP, but when the corn is fermented to produce ethanol, the NPP fraction in corn DDGS is increased to 73%, apparently by the action of yeast. Endogenous phytase activity may also influence phytate P utilization (McCance and Widdowson, 1944; Hayes et al., 1979) in feeds (that are not pelleted), but it was not measured in this study.
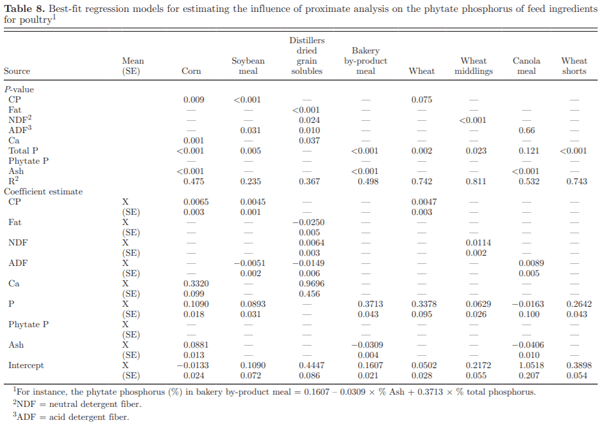
The phytate P content of wheat and wheat by-products could be predicted from their proximate composition with coefficients of determination in excess of 0.740. Predictions for the other ingredients were not nearly as good (Table 8).
The phytate P contents of corn, soybean meal, and wheat are all positively related to CP contents. This suggests that genetic selection for improved protein nutritional value (N content) would inadvertently increase phytate P levels and decrease P nutritional value. For canola meal (P < 0.05) and perhaps for soybean meal (P = 0.15), CP and fat levels are inversely related, as would be expected (the more fat that is removed the higher the proportion of CP that is left). The higher levels of CP that were also associated with higher levels of fiber showed the unexpected positive relationship between CP and NDF for canola meal (Table 5). However, any association between fat content and total P content is very small, far from significant, and apparently not due to the removal of any phospholipids.
From this data, in which cultivar, fertilization, and rainfall were not known, it is impossible to tell what differences among samples were due to. The data demonstrates the great challenge facing feed formulators not able to quickly sample and analyze each batch of feed ingredients when they reach the feed mill. In a subsequent paper (Tahir et al., 2012), we show the results of near infrared spectroscopic calibrations for quickly estimating the total and phytate P composition of these same feed ingredient samples.
This article was originally published in 2012 Poultry Science 91 :928–935. http://dx.doi.org/ 10.3382/ps.2011-01893. This is an Open Access article licensed under a Creative Commons License. 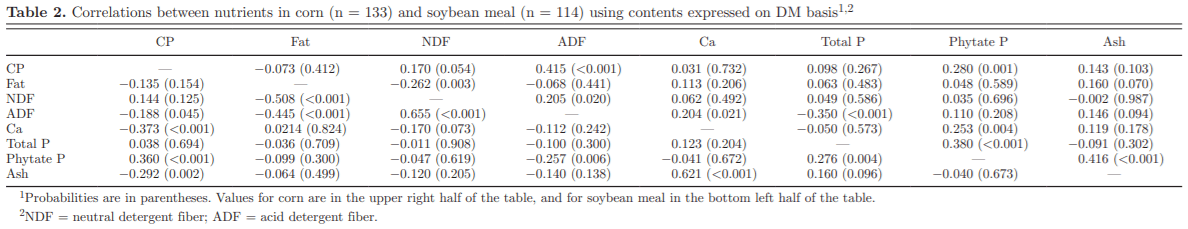


.jpg&w=3840&q=75)