INTRODUCTION
Following the collection of LCA energy data, research was undertaken to monitor and benchmark energy use at three separate meat chicken farms. Energy use was monitored at three grow-out farms (four sheds) in southern Queensland during 2011/12. The results of this monitoring showed that there is a large variation in both electrical and total energy use between farms and even between sheds on the same farm. The data collected and analysed as part of this study (McGahan et al, 2012) between just four shed indicates there is wide variation in both electrical energy use and total energy use and hence there is scope for improvement in this area of the production system.
RESULTS
PAST ENERGY MONITORING
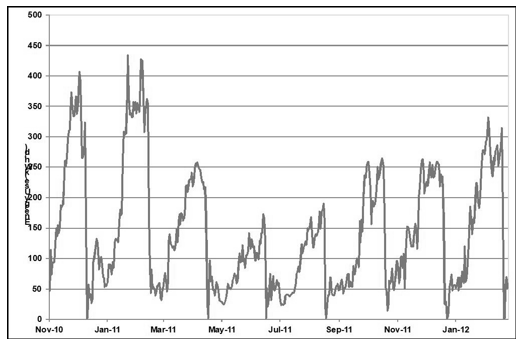
Total daily electrical energy use for all batches of birds was calculated for the four sheds from the recorded data (McGahan et al 2012). The collected data from one farm – Farm B is Figure 1
Figure 1. Total daily electrical energy use (kWh/d) for all batches of birds – Farm B
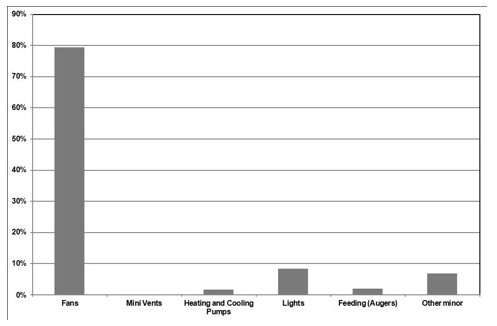
For each farm, the contribution of each process electrical energy use as a percentage of total shed electrical energy use was calculated on an annual basis. Data for Farm B is shown on Figures 2.
Figure 2. Breakdown of annual electrical energy use for Farm B
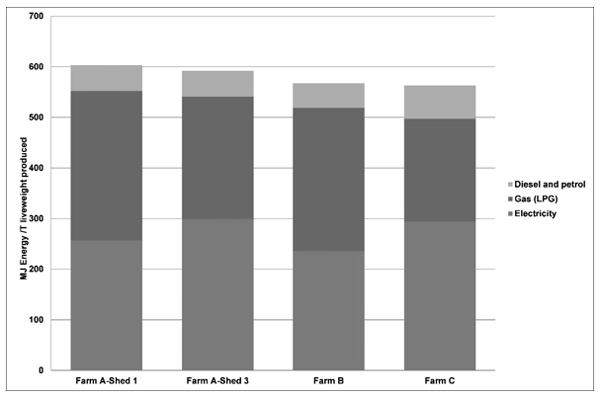
Total energy use (electrical, gas, diesel and petrol) was determined for three of the sheds and is presented on a MJ/tonne of liveweight produced basis (Figure 3). Gas usage was not metered individually for sheds and was apportioned to the studied sheds based on bird production. Similarly, diesel and petrol usage was apportioned to each shed based on bird production data for each shed.
Figure 3. Total energy use (MJ/tonneliveweight produced) for three farms over a one year time period.
FAN PERFORMANCE
As fans makeup the majority of energy use at meat chicken farms, an analysis of the tunnel ventilation fans efficiency was conducted at a poultry shed in 2013.
The Fans Assessment Numeration System (FANS) was used as designed by Casey et al. (2002).
The ventilation efficiency of the 48” production fans was assessed by traversing the FANS cross arm over the production fan diameter at 5 static pressures (0 to 35 Pa). A single run over the fan diameter takes 81-86secs with the cross arm driven up/down/up/down to give a total measurement time of 324-344s at each static pressure. Wind speed data from the propeller anemometers is logged to a datalogger (Campbell Scientific Australia, CR1000) every second (scanned every 0.5s) together with static pressure (Setra Differential Pressure Transducer 2601-MS3-N). The air volume passing through the production fan is calculated and averaged for each static pressure. The resulting polynomial relationship or Fan efficiency curve is used to calculate the airflow at the measured static pressure for each individual fan during emission measurements.
The fans are 48” Euromme with a 1.0 hp motor. The fans were installed in 1991 but were re-built in 2004 with new bearing, fan blades and motors. This makes a comparison with the manufacturer’s rating airflow curve difficult, hence it is not included.
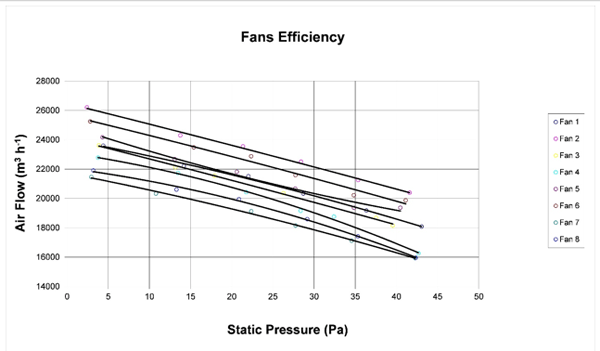
Figure 4. Poultry Farm Fan Efficiency
DISCUSSION
PAST ENERGY DATA
Total daily electrical energy use for all batches of birds was analysed for the four sheds from the monitored data (McGahan et al. 2012). Peak energy use (summer) ranged between 350 and 430 kWh/d. This peak energy demand did not correspond to shed capacity however, where Farm A (Shed 3) had the same electrical energy demand as Farm B, yet stocked approximately 75% of the birds. Total electrical energy demand also varies from year to year, with peak summer demand being 20% lower in 2010/11 than 2011/12 for Farm A (Sheds 1 and 3) and Farm B. This is likely caused by lower ambient temperatures experienced during the 2011/2012 summer. For all sheds more than 80% of the total energy use was less than 250 kWh/d, with Farm A (Shed 1) having 94% of total energy use less than 250 kWh/d. All of this peak energy use occurs for around a one week period towards the end of batches produced in summer.
Fan energy use makes up the largest portion of electrical energy demand at between 68 and 88% of total electrical energy use for the four sheds. Fan performance represents the greatest opportunity for potential electrical energy savings. Lighting represents the next highest electrical energy use, yet this is less than 10% of total electrical energy use for three of the farms.
Electrical energy use per tonne liveweight produced was compared for the four studied sheds for corresponding batches for both early-winter and mid-summer batches. This analysis showed that electrical energy varied between 43 and 67 kWh per tonne of liveweight produced. This represents 55% greater energy use for Farm A (Shed 3). Total energy use (electrical, gas, diesel and petrol) was determined for all sheds over approximately one year. Large differences were observed in thermal energy use (LPG) between farms, with the highest energy use almost 30% higher than the lowest farm when represented on a tonne of liveweight of bird produced. Total energy use ranged between 567 and 603 MJ per tonne of liveweight produced.
FAN PERFORMANCE
Results from the fan monitoring in a shed using the FANS technology show that the air flow decreases with higher static pressure inside the shed (Figure 4). A higher static pressure makes the fans ‘work’ harder to achieve air flow. There was large variation between the efficiency of each fan in the tunnel ventilation system. For low static pressure (<5 Pa) the air flow ranges between 26,000 and 21,500 m3/hour. Under high static pressure (> 40 Pa) the air flow varies between 20,500 and 16,000 m3/hour. These results highlight the importance of controlling the shed’s static pressure and selecting high performing fans. The variation in fans performance is due to accumulated dirt and corrosion, differences in flow resistance from the shutters, and differences in motor and bearing wear over time. The inconsistent performance between the individual fans shows that improvements to performance are possible. General maintenance of the fans (motors, pulleys, belts, shutters etc.) will improve fan performance resulting in efficient cooling.
RECOMMENDATIONS FOR OPTIMISING ENERGY EFFICIENCY
VENTILATION
Modern poultry sheds incorporate a mechanical ventilation system which automatically controls the shed climate ensuring optimal bird growth. Fans are the major energy consuming component of these systems. Other components of a ventilation system include inlet vents controllers, heaters and cooling pads.
Fans impact upon energy use in two ways, they require energy to operate, and the management of the fans impacts the efficiency of the heating energy used within the building. The first step is selecting quality and correctly designed fans that suit a specific shed. All manufactured fans should be rated by an independent lab to show air flow and efficiency as a function of static pressure. Fans should not be chosen on diameter alone, it is never wise to assume that two fans of equal size will have the same performance, as different motors, blade curvature and other attributes greatly affect performance. Fans should be selected based on air flow and efficiency ratings. Choose fans which are in the upper 25% of rated fan efficiencies (Iowa State University 2010).
Once a fan has been selected for installation there are still several factors that will affect their performance and energy efficiency. Fan guards generally decrease performance by <5% and should always be left on for workplace health and safety reasons. Shutters reduce performance by 10-25% but are necessary for periods when the fans are not running. Installing discharge cones can increase fan efficiency by >15%. Ensuring there is no back pressure created from fans discharging air into blocked or tight spaces will also help improve performance. There should be sufficient distances between sheds to allow for unobstructed airflow.
General maintenance of fans will also ensure efficient performance and reduce fan operating costs. Methods for improving fan performance include:
- General maintenance of pulleys and belts, loose belts cause inefficient fan performance while over-tight belts will cause excess wearing upon bearings
- Regularly cleaning fan blades, motors and shutters.
- Replace burnt-out motors with energy efficient motors.
- Investment in more capital (e.g. energy efficient fans and cowlings). This decision should be based on potential pay-back.
- Ensuring shed ventilation (fan performance) is meeting manufacturer requirements.
- When constructing sheds, select energy efficient fans, pay attention to the fan’s energy efficient rating (cfm/watt) and air flow ratio.
- Reducing the fan speed with a variable frequency drive (VFD) unit reduces airflow rate and the energy consumption of the fan; operate in accordance with ventilation requirements.
- Data from the US shows for every 2 CFM / watt increase, power usage is reduced by approximately 10%.
To ensure the entire ventilation system operated efficiently other components require attention. Quality shed insulation is important for cooling and heating as it will prevent heat and cold air loss. During summer insulation reduces external heat load entering the shed, while in winter heat is maintained inside the shed. Poor insulation, either low quality (poor thermal retention) or damage (leakage) will cause undesirable air loss. Both walls and ceiling should be insulated with high quality materials with suitable U values (heat transfer coefficient). The insulation efficiency or minimum thermal resistance (R value) of insulation materials decreases when moist. Vapour barriers can be used to avoid humidity build-up. The condition of existing insulation should be checked for any signs of wear and tear. For sheds with side-curtained walls, the curtains should be secured to prevent air loss when the shed is running under tunnel ventilation. Poultry sheds with insulated side walls are more energy efficient than open sides with curtains.
Proper management of the cooling pads can also improve the ventilation systems energy efficiency. This involves regularly cleaning the cooling pads to ensure air flow is not restricted, minimising the load on the fans. During use, the cooling pumps should be running continuously to keep the pads wet and as clean as possible.
Electronic devices are installed to control the ventilation system in poultry sheds. Timers, sensors and thermostats lose accuracy due to time, dust and humidity. Sensors and controllers should be cleaned, tested and recalibrated regularly to ensure the shed maintains the conditions programmed into the system during the entire day. This allows the system to operate efficiently, saving energy.
LIGHTING
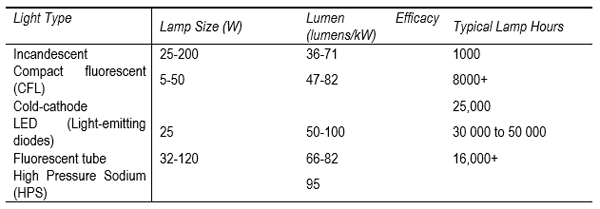
Lighting was the second highest contributor to energy use at meat chicken farms. There is great potential for energy savings from lighting due to the rapid development of technology. Burrows (2009) provided information on improving the energy efficiency of lighting in poultry farms. New lighting technology should be investigated as a viable option for replacing poor energy efficient, aging lighting infrastructure. Traditional incandescent bulbs are inefficient as they only convert 5% energy into light; the remaining energy is given off as heat. Energy efficient options exist, such as compact fluorescent bulbs, and fluorescent tubes, cold cathode, high pressure sodium (HPS) or LED. These lighting types use far less energy and have a much longer lifetime; values are displayed in Table 1.
Table 1 – Relative energy efficiencies of various light sources(Burrow 2009)
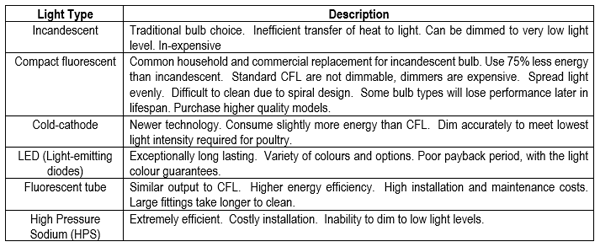
A short summary on each of the available lighting types used in poultry is provided in Table 2. Incandescent, compact fluorescent, cold cathode and LED lights use standard sockets, preventing the requirement of installing expensive new fittings. New fittings are required for fluorescent tubes and HPS lighting options.
Table 2 – Lighting source description
The recommended lighting option to achieve better energy efficiency in poultry sheds is the cold cathode bulbs. Cold cathode lights can be installed in existing fittings and are able to be dimmed to appropriate levels. Compact fluorescent lights are equally efficient when the existing incandescent bulb is not connected to a dimmer switch. These lights are a worthwhile investment, as future energy costs will be reduced. For new sheds the options may include fluorescent tubes and HPS lights.
FUEL AND GAS
With high costs of gas and fuel (petrol and diesel) chicken farms can reduce costs by using these energy sources more efficiently. For chicken farms that use gas for heating purposes, usage can be minimised by ensuring sheds are well sealed.
Chicken farms use fuel and diesel to operate generators and equipment within the shed such as pumps and motors. Fuel and diesel use should be recorded routinely so the farm is aware of consumption. Fuel and diesel use can be reduced by good management practices and by maintaining and using suitable equipment. Good management involves running pumps and motors when required and switching off once done. Regular servicing of equipment will ensure fuel use is maintained at manufacturer’s specifications. When selecting the type of motors for a particular job, the motor capacity should be chosen based on the specific requirement. Fuel will be wasted choosing a large, powerful motor for a job that requires less energy.
MANAGING PEAK ENERGY LOADS
Although not necessarily reducing energy use, but has the potential to reduce costs is to more carefully manage peak energy loads. Peak electricity use periods can be monitored by installing electrical power meters on the power supply to each shed to monitor energy used per day or per batch. Peak energy may be reduced by minimising the operation of any additional equipment when the fans are running at full load. Another option in reducing electrical energy costs is to negotiate with the supplier for a reduced tariff if reliance on grid electricity can be reduced by running back-up generators several days a year during peak energy demand on the grid.
ALTERNATIVE ENERGY SOURCES
Poultry producers have the option to reduce energy demand on the electrical grid, therefore reducing energy costs, by implementing alternative energy sources.
SOLAR
Existing fossil fuel energy consumption can be replaced by using photovoltaic (PV) cell systems (CEC 2009). The cells are designed to fit on available roof space which most poultry sheds are well suited to provide. At large tunnel ventilated farms, solar cells can be used to reduce peak electrical energy load during hot periods of the day. They are also useful at smaller, naturally ventilated chicken farms due to the ability to store energy for use in any energy intensive activity. As mentioned, decreasing peak load allows farm management to negotiate cheaper rates with power suppliers by reducing the burden on electrical infrastructure. However, the payback may not be worth the initial investment at smaller, low energy use poultry farms.
WIND
Wind power is a similar approach to solar when considering options to produce alternative, renewable energy. Wind turbines will also reduce peak electricity usage by providing back-up power when required. Poultry farms looking to install wind turbines must be located in geographical areas that receive consistent and meaningful wind speed.
WASTE TO ENERGY
Feasibility assessments by McGahan et al (2013) showed that anaerobic digestion has potential for smaller scale and on-farm processing of poultry litter, however the level of biodegradability for the range of poultry litters available in Australia must be quantified to determine whether existing litter materials are suitable for digestion. A threshold litter degradability requirement of 50% was identified for anaerobic processes to be feasible. Existing litter is likely to be at or below this level. Options for improving degradability could include substitution of more degradable base materials such as straw, use of multiple flock litter batches, and pre-treatment.
Conclusions
The energy monitoring at three meat chicken farms (four individual sheds) during 2011/2012 showed large differences in total electrical energy use. These results showed great potential to improve energy efficiency in the sheds. Electricity for the ventilation fans represented the largest portion of energy use. Other possible areas in which to improve energy use include heating, lighting, feed supply and pump motors. Evaluation of the performance of a single tunnel ventilated meat chicken shed showed large variations in the performance of fans at both low and high static pressures.
Energy efficiency can be improved by either implementing better management practices or installing new equipment. The following components of meat chicken farm are vital to energy efficiency; ventilation and cooling, heating, lighting, and management practices. Management practices include managing gas and fuel usage, managing peak energy loads, and operating pumps, feed systems and administration activities that require energy.
Reducing reliance on grid electricity under peak load will reduce energy costs. This can be achieved by managing the time peak load occurs or by supplementing energy use with generators or alternative power sources. Alternate energy sources warrant further investigation, including solar, wind and waste to energy technologies, such as anaerobic digestion.
ACKNOWLEDGEMENTS
The contribution of the RIRDC Chicken Meat program for funding this research is gratefully acknowledged, along with the cooperation and time contributed by the farm owners and managers in allowing the project team to access their properties and contribute to the data collection.
REFERENCES
Burrow, N. (2009). Energy Efficiency in Poultry House Lighting. Service Concepts. Indianapolis.
Casey, K.D., Wheeler, E.F., Gates, R.S., Xin, H., Topper, P.A., Zajaczkowski, J.S. et al. (2002), 'Quality assured measurements of livestock building emissions: Part 4. Building Ventilation Rate', in Proceedings of Symposium on Air Quality Measurement Methods and Technology, San Francisco, CA, November 13-15.
CEC 2009, Grid-connected PV systems - System design guidelines for Accredited Designers, Clean Energy Council, < www.cleanenergycouncil.org >.
Iowa State University.(2010). Farm Energy – Energy efficient fans for poultry production. Cooperative Extension Service, Iowa State University of Science and Technology, Iowa.
McGahan, E.J., Davis, R.J., and Poad, G (2012). Quantifying On-farm Energy Usage in the Australian Meat Chicken Industry.RIRDC Final Report. Project No. PRJ-005770.
McGahan, E.J., Barker, S.J., R.J., Poad, G.P., Wiedemann, S.G., Batestone, D. (2013). Conversion of Waste to Energy in the Chicken Meat Industry. RIRDC Final Report. Project No. PRJ-002964.


_1.jpg&w=3840&q=75)