INTRODUCTION
Heritage chickens are important for breeders and industry to protect valuable genes and traits over the long term. However, 50% or more of the genetic diversity is absent in commercial pure lines (FAO, 2007; Muir et al., 2008). Therefore, preserving potentially valuable genes by conducting research with heritage breeds is important. Changes in live weight and proportional growth of body components as affected by genotype and environmental factors are defined as growth, while those changes appearing in growth over time are defined as growth curves (Camdeviren and Tasdelen, 2002). Growth curves are widely used for mathematical description of growth in which growth parameters can be interpreted in a biological context (Kahm et al., 2010; Narincet al., 2014a). Growth curves can be used to describe genetic potential of growth, estimating daily nutrient requirements for different ages and genetic groups, improving efficiency of livestock production, detecting a measurable growth trait, getting information about the health status of farm animals, determining the most suitable slaughtering age, and evaluating the effect of selection programs on the parameters of a growth curve (Lopez et al., 2000; Schinckel et al., 2005; Narincet al., 2014b). Analyzing and interpretation of growth parameters should be carefully considered because precise growth models can help develop strategies ensure that animal production is efficient and cost-effective. Growth models describing genotype-specific growth curves can be used to dynamically estimate daily nutrient requirements at different ages, resulting in matching nutrient supply to the nutrient requirement. Robust ability to predict the growth pattern of individual birds is necessary to optimize poultry production systems. The Gompertz growth function describes a general sigmoidal growth curve and has been used for fitting the body weight (BW) data of different animal species with a large range in body size (chickens: Aggrey, 2002; pigs: Schinckel and Craig, 2002; and dairy cattle: Perotto et al., 1992). The Gompertz growth function is usually estimated once per genotype (multiple animals), such that a common mature weight (Wm) is estimated for each genotype, and a random error (eit) is associated with each individual bird i at age t in the model, which is assumed to be independent and normally distributed with mean of zero and a constant variance σ2. Since there is no random effect associated with Wit (weight of bird i at age t) in this model, it is a fixed-effect model. The outcome of such models would be imprecise as they would not account for individual variation in growth rates and mature body sizes, which we know exist in populations (Wang and Zuidhof, 2004).
Growth data usually consist of repeated measurements over time on the multiple subject(s). Although longitudinal data provide more information than cross-sectional data, some challenges, such as heterogeneity of variance and correlated errors of measurement, are associated with their analysis (Gibbons et al., 2010). For instance, heavier birds are typically heavier at multiple adjacent measurement points over time, and this will increase heterogeneity and autocorrelation issues in growth data. Mixed-effects regression models, which are widely used for analysing longitudinal data, are quite robust to the various violations from modeling assumptions such as homogeneity of variance and lack of autocorrelation among data. Furthermore, in contrast to traditional regression techniques, mixed-effects models are able to estimate fixed and random parameters simultaneously, which result in more accurate estimation for fixed parameters and their standard errors (Jiang and Li, 2010). Although several nonlinear mixed models (NLMM) have been used to model growth data (Schinckel et al., 2005; Aggrey, 2009; Karaman et al., 2013), the effect of accounting for individual sources of variation in growth models on the estimation accuracy of growth parameters has not been fully investigated and to our knowledge is mostly new to the poultry science literature.
Efficiency of production is increasingly important with escalation of feed costs and demands to minimize the environmental footprint. In this regard, improved growth models, as well as precision feeding (PF), would offer an opportunity to match nutrient supply to nutrient requirements of individual birds; this would result in improved production efficiency (Zuidhof,2020). Residual feed intake (RFI) is a biological indicator of energetic efficiency and defined as the difference between observed and predicted feed intake based on energy requirements for production and maintenance(Luiting, 1990; Kennedy et al., 1993). It has been reported that feed restriction improved production efficiency by lowering RFI (Metzler-Zebeli et al., 2019). Therefore, we hypothesized that minor feed restriction(feeding at the 95% of the ad-lib counterpart) would reduce RFI, thereby increasing production efficiency.
The objectives of the current study were 1) to evaluate different nonlinear mixed models with and without inclusion of random coefficients to account for knowable individual sources of variation using birds from 2heritage chicken lines; 2) to obtain estimated values for random coefficients of growth parameters including growth rate and mature BW; 3) to investigate the effect of minor feed restriction on production efficiency.
MATERIALS AND METHODS
The animal protocol for the study was approved by the University of Alberta Animal Care and Use Commit-tee for Livestock (AUP00000121) and followed the Canadian Council on Animal Care Guidelines andPolicies (CCAC, 2009).
Study Design
The current experiment consisted of a 2 x 2 x 2 factorial arrangement of treatments, with 2 heritage strains, New Hampshire (NH) and Brown Leghorn (BL), 2 sexes (male and female), and 2 feeding levels(ad libitum (AL) and restricted in which they were given 95% of the AL intake of a paired bird closest in BW). Each bird was an experimental unit.
Birds, Housing, and Management
A total of 32 birds (16 mixed-sex birds from each strain) were kept in an environmentally controlled facility at a stocking rate of 6.0 birds per m2 from hatch to17 wk of age. The birds were housed in a single pen containing 4 precision feeding stations. All birds on both treatments were fed individually by a PF system(Zuidhof et al., 2017) that could apply the feeding treatments to each individual bird. Therefore, every bird was an experimental unit. Room temperature was maintained at 33°C during the first 2 d, and from day3 onward temperature was gradually reduced to 20°C by week 5. A commercial standard mash starter diet was provided from 1 to 28 d of age, followed by a mash developer diet from 28 to 119 d of age. The ME(kcal/kg), CP, and digestible Lys were 2,800, 19.00,and 1.00% for the starter, and 2,980, 16.45, and 0.75%for the developer, respectively. Water was provided AL throughout the experiment. At 25 d of age, each individual bird was equipped with a wing band containing a radio frequency identification (RFID) transponder to be recognized by the PF system. Body weight and feed intake data were recorded by the PF system for each in-dividual bird throughout the experiment. Pair feeding was done from 12 to 17 wk of age. At 12 wk of age feed-restricted birds were paired with a bird closest in BW (23±14.6 g difference in BW of 2 pair birds), and pair-fed at 95% of the AL intake of its match. Pair feeding was implemented using the PF system software. Therefore, PF system was able to identify the birds’ RFID and then provide the right amount of feed based on the treatment of the bird.
The Nonlinear Mixed-Effect Gompertz Model
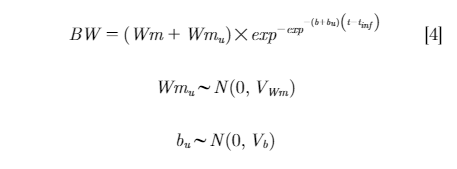
Four Gompertz functions were evaluated. The following fixed-effects model was the basic model:
Where Wm was mature BW; b was rate of maturing; t was age (d); and tinf was inflection point (d).
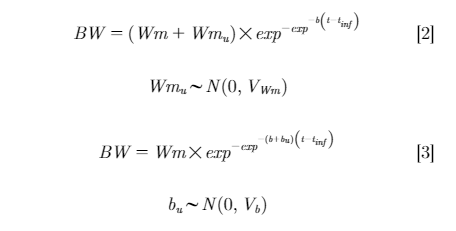
Models with inclusion of random coefficients, either Wmu or bu for individual Wm and b respectively, were considered in models 2 and 3:
Finally, the model with inclusion of both random coefficients (Wmu and bu) is shown in model 4:
The estimated fixed-effect parameters were Wm, b,and tinf; these were population-level estimates of mature BW, rate of maturing, and inflection point, respectively. The random-effect parameters were Wmu and bu, and these accounted for bird-specific variation in mature BW and rate of maturing, respectively.
Calculation of Residual Feed Intake
Observed energy intake was calculated by multiplying the observed daily feed intake (g) by the dietary energy content (kcal/g). Predicted energy intake was estimated using an empirical energy intake model and accounted for energy used for maintenance and BW gain. A nonlinear model of ME intake as a function of metabolic BW and average daily gain (ADG) was used to estimate RFI, which is shown in model 5 (Romero et al., 2009).
Where MEI was ME intake (kcal/d); a was estimated maintenance requirement or the average total heat production from 8 to 17 wk of age (kcal/kgb); BW was body weight (kg); c (kcal/g) was the coefficient representing energy requirement for gain (ADG, g/d); b and d were exponents for BW to calculate the degree to which BW affected the energy cost of maintenance and gain, respectively; ε was residual or unexplained error.
Then RFI was calculated as
RFI = observed MEI − predicted MEI
Statistical Analysis
BW measurements were fit to the fixed-effects model [1] and random-effects models [2, 3 and 4] using the NLMIXED procedure in SAS (Version 9.4, SAS Institute Inc., Cary, NC, 2012). The NLMIXED procedure was used to fit the energy partitioning model (equation [5]) as well. The energy initial values of covariance parameters for running PROC NLMIXED were obtained from covariance matrix of individual parameter estimates. Under normality assumptions, minimized value of −2 log-likelihood and the Akaike information criterion (AIC), Bayesian information criterion (BIC), and corrected version of AIC (AICC), provided by the software, were used for the evaluation of alternative models in terms of their fitting performance (Akaike, 1974; Schwartz,1978). The criteria were computed as follows:
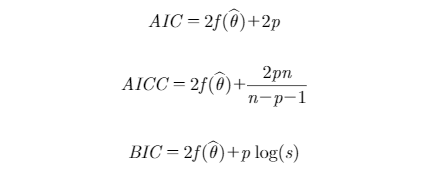
where ƒ was the negative of the marginal log-likelihood function, θˆ the vector of parameter estimates, p was the number of parameters, n was the number of observations, and s was the number of subjects. Lower values of these statistics reward preferred goodness of fit of the model to the data among alternative models, rewarding a more accurate explanation of variance. Adding more parameters into the model penalizes the fit statistic. For example, AIC will increase by 2 for every additional parameter (p) estimated. Growth parameters and their relevant random coefficients were estimated using the Dual Quasi-Newton optimization technique (Al-Baali and Fletcher, 1985). For models containing random effects, the Adaptive Gaussian Quadrature method was used as an integration method. A K-fold cross-validation method was used to evaluate the predictive performance of the models. The data set was randomly partitioned into 5 (K = 5) mutually exclusive equal subsets using the SURVEYSELECT procedure of SAS, and the procedure was repeated 10 times. Each time, K-1 subsets were used as a training set and one subset was used for testing. The R-square of the relationship between observed and predicted BW; the mean absolute error (MAE); the mean square error (MSE); and the root mean square error (RMSE) were calculated as cross-validation statistics for the testing data (Yang and Huang, 2014). Cross-validation statistics were computed as follows:
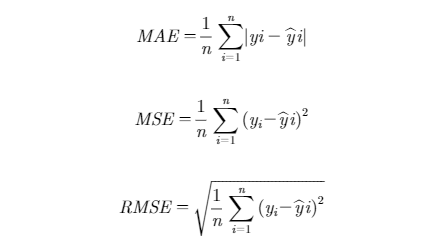
where yi was the ith BW observation, yi was the predicted value for the ith BW observation, and n was the number of observations.
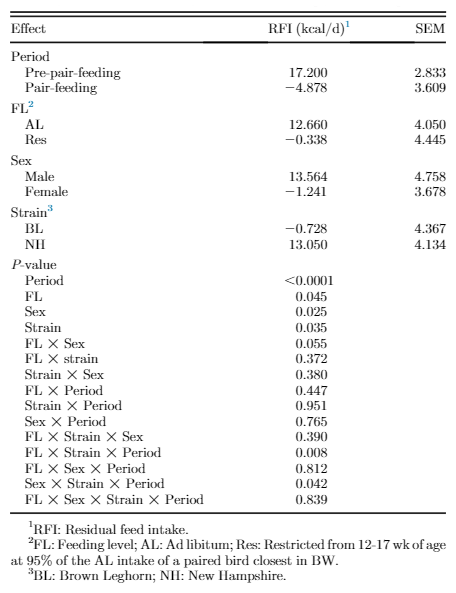
For nonlinear mixed models, SAS provides no straightforward way to assess the serial correlation of the residuals. To get insight into the residual serial correlation, we plotted the lag residuals vs. residuals for each model and conducted a regression analysis to compare R-square and regression coefficients of the models (Gooijer and MacNeill, 1999). Three-way analyses of variance were conducted on growth random coefficients (Wmu and bu) using the MIXED procedure of SAS, with the feed allocation treatment, sex, and strain as sources of variation. RFI was analyzed as a four-way ANOVA using MIXED procedure in SAS where feed allocation treatment, sex, strain, and period (pre-pair-feeding and pair-feeding) were considered as source of variations. Pairwise differences between means were determined with the PDIFF option of the LSMEANS statement and were reported as different when P ≤ 0.05. Trends were reported where 0.05 < P ≤ 0.10.
RESULTS
Model Comparison
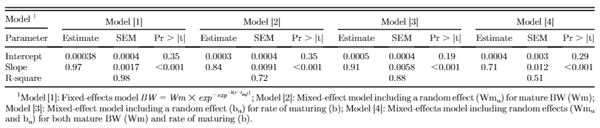
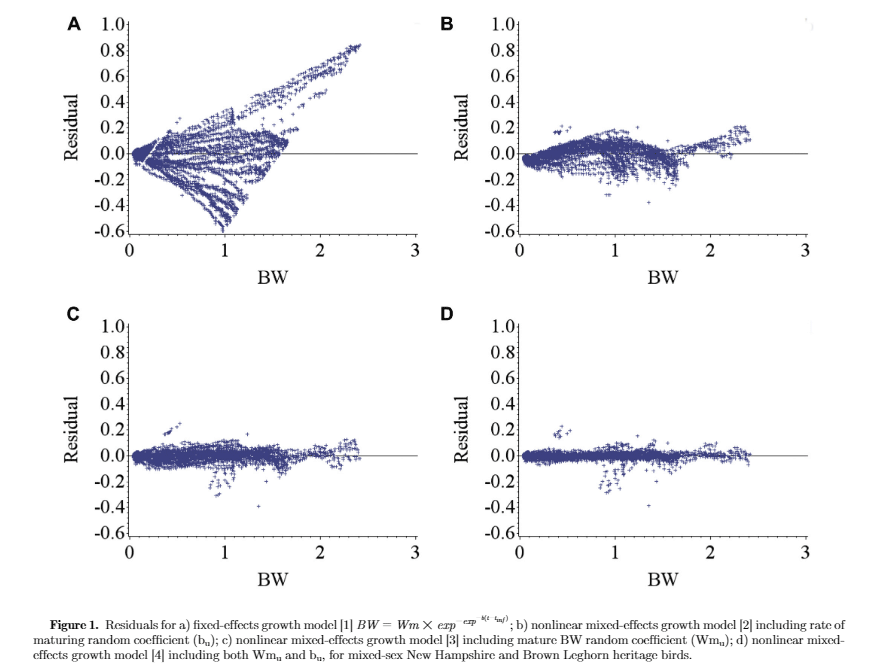
Figure 1 illustrates the residuals for fixed-effects and random-effects models. Inclusion of random effects accounted for bird-specific variation in Wm and b resulted in reduced bias (systemic error) in prediction of individual BW through increasing the homogeneity of residual variation. This confirms that the random effects accounted for a considerable amount of variation in the dependent variable. Estimates of nonlinear Gompertz growth parameters obtained with fixed and mixed-effects models along with model selection criteria are presented in Table 1. The residual variance decreased for models [2], [3], and [4] as compared with model [1] by 90.7, 96.4, and 98.1%, respectively, which indicated that more variation was accounted for. By incorporating a random effect into the fixed-effects model, part of the error variation (σ2e) was partitioned into bird-specific variation in Wm (σ2Wm in model [2]) and b (σ2b in model [3]), resulting in a lower residual variance for the models [2] and [3]. Further decline in the residual variance of model [4] was a result of further partitioning the error variation into individual differences in mature BW (Wm), the rate of maturing (b), and their covariance (σWm,b). The fitting criteria infer that model [4] was the preferred model because it diverted appropriate bird-specific variation from the residual error term. The log-likelihood, Akaike and Bayesian information criteria were all lower in model [4] compared with other models. Cross-validation statistics summarizing the predictive performance of the models is presented in Table 1. The coefficient of determination (R2) for random-effects models [2, 3, and 4] was higher than that for the fixed-effect model [1]. Model [4] had the highest coefficient of determination (R2 = 0.996) indicating that 99.6% of the variation in predicted BW of the testing data was explained by the observed BW data. Furthermore, model [4] had the lowest MAE, MSE, and RMSE among the models. Therefore, for the current data set, model [4] should be considered the model of choice to predict growth.
Table 1. Estimated growth parameters, standard errors, and model selection criteria from fixed- and mixed-effects growth models for mixed-sex New Hampshire and Brown Leghorn heritage birds.
Table 2. Regression analysis for lag-residual vs. residual for fixed- and random-effect growth models for mixed-sex New Hampshire and Brown Leghorn heritage birds.
Table 2 shows regression analysis of lag residual against residual for all models used in this trial to assess the serial correlation of the residuals. The coefficient of determination (R2) for random-effects models [2, 3, and 4] was lower than that for the fixed-effect model [1], with the lowest one for model [4] (R2 = 0.51), which means that only 51% of the variation in lag-residual in model [4] was explained by the residual. In other words, it showed a low degree of the relationship between adjacent residual and residual, which was preferred. Therefore, it could be concluded that including both random effects of mature BW (Wmu) and rate of maturing (bu) in model [4] reduced autocorrelation bias in longitudinal growth data.
Estimated Growth Parameters
Table 3 shows the estimated mature BW and rate of maturing along with their relevant random coefficients for model [4]. Overall Wm and b estimates for both the fixed and random-effects models were similar (Wm = 2.00 ± 0.106 and b = 0.0273 ± 0.00046) because the expected means of the mixed effect model were the same as that of the fixed-effect model and the data were balanced for all birds. The values for random coefficients of the growth parameters were bird-specific and should be interpreted such that Wm for the BL strain was 0.299 kg less than the overall mean Wm (2.00 kg), or 2.00–0.299 = 1.701 kg; correspondingly, Wm for the NH strain was 2.00 + 0.468 = 2.468 kg, and so on for all effects tested. Within the NH strain, the random coefficient for mature BW (Wmu) was greater for males, and for the AL treatment, and within the BL strain, Wm was greater for males and the AL treatment.
Table 3. Estimated mature BW + random coefficient (Wm + Wmu) and rate of maturing + random coefficient (b + bu) for strain, sex, and treatments by growth model [4] including random effects of mature BW and rate of maturing for mixed-sex New Hampshire and Brown Leghorn heritage birds under ad libitum and restricted feed intake pair-fed treatments
Table 4. Residual feed intake of mixed-sex New Hampshire and Brown Leghorn heritage birds under ad libitum and restricted feed intake pair-fed treatments prior to and during pair feeding.
Production Efficiency
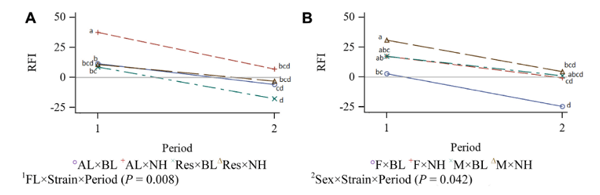
Residual feed intake data, as a sense of production efficiency, are presented in Table 4. An interaction effect was seen among feeding level, strain, and period (P = 0.008; Figure 2). The RFI was decreased with age for all groups, that is, the birds became more efficient as age advanced. Residual feed intake of the AL NH birds decreased in the second period, while there was not same decrease in RFI for feed-restricted group during the second period. However, minor feed restriction decreased RFI in BL strain, indicating an increased efficiency. The interaction effect among sex, strain, and period (P = 0.042) indicated greater efficiency for female BL and male NH during the second period as age advanced. There was a trend to reduced RFI for restricted fed males compared with AL males (P = 0.055).
Figure 2. Interaction effect of feeding level, strain, and period (Panel a), and sex, strain, and period (Panel b) on RFI value of New Hampshire and Brown Leghorn heritage birds under ad libitum and restricted feed intake pair-fed treatments.1FL: Feeding level; AL: Ad libitum; Res: Feeding level; AL: Ad libitum; Res: Restricted from 12 to 17 wk of age at 95% of the AL intake of a paired bird closest in BW; BL: Brown Leghorn; NH: New Hamp-shire.2F: Female; M: Male. The authors declare no conflict of interest.
Discussion
The pair-feeding results indicated a sex and strain-dependent effect of a minor feed restriction on production efficiency. In this regard, the results of other research (
Mebratie et al., 2017) showed a clear sex by genotype interaction in broilers, which indicated that the male BW records had a considerably larger residual environmental variance than female records, which means female records are more informative than male records. Overall, minor feed restriction increased production efficiency, but this was not confirmed for NH strain in the current study.
In this study, a nonlinear mixed-effects growth model was developed for growth data of NH and BL birds. The growth model with 2 random parameters for Wm and b was found to be the most parsimonious model based on fit statistics, and further analysis showed that it reduced autocorrelation bias in longitudinal growth data. The mixed-effects model provided an estimation of random coefficients for growth parameters of different subsets of the population. Mature BW (Wm) and rate of maturing (b) could be used in genetic selection programs. These random coefficients could be used as a tool in different scenarios of poultry production system such as stochastic prediction of BW of individuals at any age to better match nutrient supply to nutrient requirements, and to predict and evaluate the economic impact of management decisions on designing target growth curves, breeding programs, and nutritional management decisions.
Acknowledgment
Funding from Alberta Agriculture and Forestry (Edmonton, AB), Egg Farmers of Canada (Ottawa, ON), and Egg Farmers of Alberta (Calgary, AB), the Poultry Research Centre (Edmonton, AB), and technical assistance from Chris Ouellette and Mehdi Heidari is gratefully acknowledged.
Disclosures
The authors declare no conflict of interest.
This article was originally published in Poultry Science, Volume 100, Issue 5, May 2021, 101059. https://doi.org/10.1016/j.psj.2021.101059. This is an Open Access article distributed under a Creative Commons license. 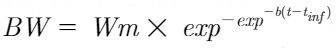


![Table 3. Estimated mature BW1random coefficient (Wm1Wmu) and rate of maturing1random coefficient (b+bu) for strain, sex, and treatments by growth model [4] including random effects of mature BW andrate of maturing for mixed-sex New Hampshire and Brown Leghorn heritage birds under ad libitum andrestricted feed intake pair-fed treatments](/_next/image/?url=https%3A%2F%2Fimages.engormix.com%2FE_articles%2F46916_414.gif&w=1200&q=75)


.jpg&w=3840&q=75)