Explore
Communities in English
Advertise on Engormix

Fast and Slow-Growing Management Systems: Characterisation of Broiler Caecal Microbiota Development throughout the Growing Period

Published: October 5, 2020
By: Laura Montoro-Dasi 1,2; Arantxa Villagra 3; María de Toro 4; María Teresa Pérez-Gracia 5; Santiago Vega 6 and Clara Marin 6.
Summary

Author details:

1 Instituto de Ciencia y Tecnología Animal, Universidad Politécnica de Valencia, 46022 Valencia, Spain; 2 Centro de Calidad Avícola y Alimentación Animal de la Comunidad Valenciana (CECAV), 12539 Castellón, Spain; 3 Centro de Investigación y Tecnología Animal, Instituto Valenciano de Investigaciones Agrarias, 12400 Castellón, Spain; 4 Plataforma de Genómica y Bioinformática, Centro de Investigación Biomédica de La Rioja, 26006 La Rioja, Spain; 5 Área de Microbiología, Departamento de Farmacia, Instituto de Ciencias Biomédicas, Facultad de Ciencias de la Salud, Universidad Cardenal Herrera-CEU, CEU Universities, Avenida Seminario s/n, 46113 Moncada, Spain; 6 Departamento de Producción y Sanidad Animal, Salud Pública Veterinaria y Ciencia y Tecnología de los Alimentos, Instituto de Ciencias Biomédicas, Facultad de Veterinaria, Universidad Cardenal Herrera-CEU, CEU Universities, Avenida Seminario s/n, 46113 Moncada, Spain.


Caecal microbiota and its modulation play an important role in poultry health, productivity and disease control. Moreover, due to the emergence of antimicrobial-resistant bacteria, society is pressing for a reduction in antibiotic administration by finding effective alternatives at farm level, such as less intensified production systems. Hence, the aim of this study was to characterise the caecal microbiota in two different broiler management systems, fast and slow-growing, using 16S rRNA sequencing analysis. To this end 576 broilers were reared in two different management systems (fast and slow-growing). Results showed that Firmicutes represented the dominant phylum for both systems. At the onset, Proteobacteria was the second prevalent phylum for fast and slow-growing breeds, outnumbering the Bacteroidetes. However, during the rest of the production cycle, Bacteroidetes was more abundant than Proteobacteria in both groups. Finally, regardless of the management system, the most predominant genera identified were Oscillospira spp., Ruminococcus spp., Coprococcus spp., Lactobacillus spp. and Bacteroides spp. In conclusion, fast and slow-growing broiler microbiota are in constant development throughout rearing, being relatively stable at 21 days of age. Regarding the genus, it should be noted that the three most abundant groups for both systems, Ruminococcus spp., Lactobacillus spp. and Bacteroides spp., are related to better productive performance and intestinal health.

Keywords: broiler; growing period; microbiota; biomarker; 16S rRNA analysis.
1. Introduction
Microbiota is defined as the microbial community, including commensal, symbiotic and pathogenic microorganisms, which colonise different areas of animals and have an important influence on animal health, productivity and disease control [1–9]. Hence, the presence of beneficial microbiota plays an important role in production, protection from pathogens, control of epithelial cell proliferation and differentiation, detoxification (controlling the behavioural and neurological functions of the host) and modulation of the immune system [6,9,10].
Principal factors affecting the microbiota are age, breed, maternal elements, sex, diet, housing, hygiene, temperature, litter, antibiotic administration and gastrointestinal location [6,11]. Referring to the last factor mentioned, the caecum is described as the organ with the greatest taxonomic diversity and abundance, which retains food for the longest period, with the greatest water absorption, and is responsible for urea regulation and carbohydrates fermentation [6].
Moreover, due to the emergence of antimicrobial-resistant bacteria, society is pressing for a reduction in antibiotic administration by finding effective alternatives to control infectious diseases at farm level [12–15]. Some of these alternatives are feed additives (prebiotics, probiotics, symbiotics, organic acids, enzymes, phytogenics and metals), alternative medical treatments (antibacterial vaccines, immunomodulatory agents, antimicrobial peptides and bacteriophages) and, finally, different, less intensified broiler management systems [16–22]. Although the beneficial effects of many of these alternatives have been demonstrated in vitro, the general consensus is that the effect of these products depends on the farm, farmer management and animal characteristics, such as the breed selected [11,14,23].
The variability obtained in different studies highlights the need to know, under production conditions, how the microbiota evolves, which could assist in decision-making in situ, especially at critical moments of the production period. For example, when the broiler reaches the farm from the incubator, an adaptation moment that will mark the development of the production cycle [9,11,24–26]; at the stage when the immune and digestive system is already mature, and therefore, will determine the potential of the breed in terms of growth and conversion [8,27,28]; or at the end of the cycle, a key moment, as it is the step before the animals are transferred to the slaughterhouse. The microbiota has been seen to be an important source of external and internal contamination of the carcass by bacteria of such great importance as Salmonella and Campylobacter during loading, transport and slaughter [29–32]. Therefore, having a broad knowledge of this composition throughout the cycle can help the sector choose the different control measures to be applied during rearing, which enhance the presence of beneficial microorganisms, as well as the immune system, and can control and even eliminate the presence of pathogenic microorganisms at critical moments in the production cycle [6,9,32]. However, today there is still a need to develop cost-effective and straightforward molecular techniques that can be used for this purpose at field level.
In this context, the aim of this study was to characterise the caecal microbiota in two different broiler management systems, fast and slow-growing, during their respective growing periods, using 16S rRNA sequencing analysis.
2. Materials and Methods
In this experiment, all animals were handled according to the principles of animal care published by Spanish Royal Decree 53/2013 [33]. All protocols were approved by the Ethical Review Panel of the Directorate-General for Agriculture, Fisheries and Livestock from the Valencian Community by the code 2018/VSC/PEA/0067.
2.1. Experiment Design 
The study was performed in an experimental poultry house in the Centre for Animal Research and Technology (CITA, in its Spanish acronym (Valencian Institute for Agrarian Research, IVIA, Segorbe, Spain)). To this end, 576 broilers (males and females) provided from the same hatchery were randomly housed in two identical poultry rooms (replicates A and B) and 288 animals were housed in each room (144 fast and 144 slow-growing breeds). In addition, animals were distributed in 24 pens (12 pens for each group, fast and slow-growing broiler management system) in a final stocking density of 35 kg/m2 for fast-growing management system, and in a final stocking density of 17 kg/m2 for slow-growing management system, with wood shavings as bedding material. Two management systems were evaluated: fast and slow-growing, and two commercial breeds were used (Ross® and Hubbard®, respectively). The fast-growing management is characterised by using an efficient feed conversion and good meat yield breed [34], with the appropriate feed, and an early slaughter age (42 days). In contrast, the slow-growing management system is a less intensified type of production, focused on the criteria of animal welfare and absence of antibiotics [35], with a different feed and a later slaughter age (63 days).
To simulate the real conditions of broiler production, the houses were supplied with programmable electric lighting, automated electric heating and forced ventilation. The environmental temperature was set at 32 C on arrival day and gradually reduced to 19 C by 41 days post hatch.
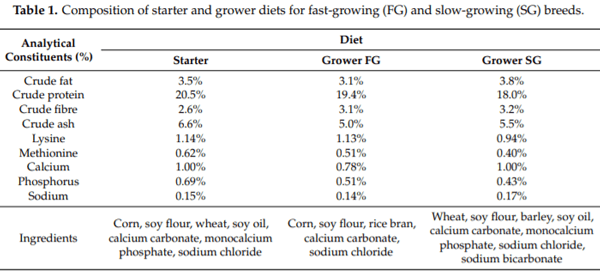
The birds received drinking water and were fed ad libitum. Nutritional and product safety analysis were assessed before the arrival of animals in the Poultry Quality and Animal Feed Centre of the Valencia Region (CECAV, in its Spanish acronym (Centro de Calidad Avícola y Alimentación Animal de la Comunidad Valenciana, Castellón, Spain)). Two different age commercial diets were offered to the animals: from arrival until 21 days post hatch, chicks were fed a pelleted starter diet, and from 21 days old to the slaughter day a pelleted grower diet was offered to animals. The diets for each management system were formulated to meet each breed’s metabolic requirements and to provide equal nutrient profiles [36]. The starter diet was the same for both breeds (Camperbroiler iniciación, Alimentación Animal Nanta, Spain), while the grower feed was the standard diet specific for each one: A-32 broiler and A-80 Pollos crecimiento (Alimentación Animal Nanta, Spain) for the fast and slow-growing breeds, respectively. Nutritional composition of the diets has been detailed in Table 1. Only one batch of feed per age (starter and grower) was manufactured. Moreover, no coccidiostats or antimicrobials were added to either diet, and high biosecurity levels were maintained in the experimental poultry house during the rearing. Mortality rates and diarrhoea presence were recorded daily. Finally, animals were weighed at weekly intervals and feed consumption per pen was recorded.
Fast and Slow-Growing Management Systems: Characterisation of Broiler Caecal Microbiota Development throughout the Growing Period - Image 1
2.2. Sample Collection 
To assess the development of microbiota composition throughout the growing period, animals from each experimental group were randomly selected and caecal samples were collected at different times of the growing period: on arrival day (1 day), at mid-period (21 days for both groups) and before slaughter (42 days of age in fast-growing, and 63 days in slow-growing). On arrival day, 30 animals per group (fast or slow-growing) were selected and sampled just before being assigned to the houses (n = 30/group). Later, at mid-period, and before slaughter, caecal samples from 30 animals per group and house were collected again at each sampling moment (n = 60/group/sampling moment). Caecal samples were taken individually and placed in sterile jars. The samples were processed immediately after collection.
2.3. DNA Extraction 
Caecal content was removed and homogenised. On the first day of rearing, five pools of six animals from each experimental group were prepared (n = 5/group). Then, for the mid and end period, five pools of six animals from each group and house were made (n = 10/group/sampling moment). DNA of the pool content was extracted according to the manufacturer’s instructions (QIAamp Power Fecal DNA kit, Qiagen, Hilden, Germany) and frozen at 80 C for shipment to the Centre for Biomedical Research of La Rioja (CIBIR, in its Spanish acronym, Logroño, Spain).
2.4. 16S rRNA Sequencing Analysis 
First, all samples received were analysed in a Fragment Analyzer (Genomic DNA 50 Kb kit, AATI) to ensure their integrity. Additionally, the initial DNA concentration was measured by means of a Qubit fluorometer (dsDNA HS Assay kit, Invitrogen). From 12.5 ng of DNA (evaluated in Qubit) of each sample, the library was prepared following the instructions of the 16S rRNA Metagenomic Sequencing Library Preparation (Illumina) protocol [37]. Primer sequences cover the V3–V4 regions of the 16S rRNA gene. The following primers also include the Illumina adapters: 16S Amplicon PCR Forward Primer = 50 (TCGTCGGCAGCGTCAGATGTGTATAAGAGACAGCCTACGGGNGGCWGCAG) and 16S Amplicon PCR Reverse Primer = 50 (GTCTCGTGGGCTCGGAGATGTGTATAAGAGACAGGACTACHVGGGTAT CTAATCC). The sequencing run was performed in a MiSeq (Illumina) system in 2 300 bp format.
The quality of the raw unprocessed reads was evaluated using the FastQC software [38]. After the removal of adapters by Trim Galore [39], the quality of clean reads was re-evaluated with FastQC. Then, because the fragments sequenced for each of the samples were overlapped in their central region, the V3–V4 region of the 16S rRNA gene was partially reconstructed into fragments of approximately 550–580 bp. The OTU (Operational Taxonomic Unit) picking and analysis was performed with QIIME (v1.9.1) pipeline [40], following the methodology “pick open reference OTUs” against the taxonomy reference base Greengenes 13.8 at 97% nucleotide identity. Finally, InteractiVenn software was used for Venn diagram construction [41].
Calculation of the alpha diversity indexes was done by QIIME (v1.9.1), which generates multiple rarefactions on the OTU table at different sequencing depths, calculates the alpha diversity indexes at each depth, and finally coheres the data, generating rarefaction graphs for each index. To Identify OTUs with differential abundance in this study, the analysis was performed using two tests: a non-parametric analysis (Kruskal–Wallis) and a parametric test (MetagenomeSeq). In both cases, analysis set out from the standardised and filtered table of OTUs to eliminate those OTUs that may be spurious. Analysis was carried out at three taxonomic levels: Phylum, Genera and OTU. Then, the alpha diversity indexes were statistically compared between groups of samples through the Python script “compare_alpha_diversity.py” included in the QIIME v1.9.1 package. It performs a two-sample t-test by using by default, as in our case, a non-parametric (Monte Carlo) method and permutation value of 999. The t-test value and a p-value (Bonferroni correction) were obtained for each couple of defined groups. In this study, a rarefaction depth of 72,060 reads was selected for this analysis [42].
Beta diversity was evaluated based on indices or coefficients of similarity, dissimilarity or distance between the samples from qualitative (presence/absence of OTUs) or quantitative (proportional abundance of each OTU) data. The OTU filtering and normalisation from the OTU table was performed using the QIIME v1.9.1 protocol. A threshold of 0.01% was applied, meaning that the OTU sequences with an abundance below the 0.01% are assigned as spurious sequences, and therefore removed from the analysis. The OTU table normalisation, applying the Cumulative Sum Scaling (CSS) method through the MetagenomeSeq package was chosen as an alternative to the rarefaction one, according to previous studies [43,44]. In QIIME’s metagenomics protocol, beta diversity was measured through a distance or dissimilarity matrix between each pair of samples. This matrix was visualised with Principal Coordinate Analysis (PCoA) graphs in 2D and 3D, which allow analysis of the distance between each pair of samples.
Moreover, to analyse the statistical significance of sample groupings by using beta diversity distance matrices, the “compare_categories.py” Qiime v1.9.1 script was used. This script, which uses the R vegan and ape packages, allows analysis of the strength and statistical significance of sample groupings. Several methods are available, and two of them were selected for this study: ANOSIM and Adonis. Both methods were applied to the three different calculated matrices (Bray–Curtis, Unweighted Unifrac and Weighted Unifrac). 
2.5. Data Availability
Bioproject: PRJNA612272.
BioSample: SAMN14365530: Fast and slow-growing broiler breeds. Caecal microbiota characterisation.
3. Results
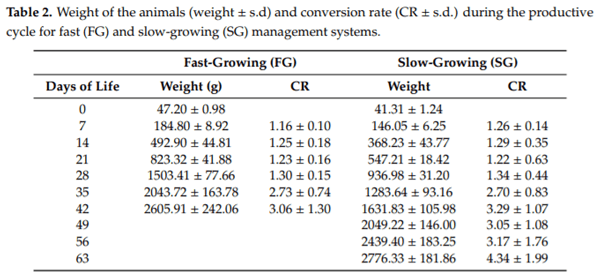
During this study, a total of 50 caecal pools (25 per experimental group) were collected, processed and sequenced. No clinical signs were observed during rearing, and the productive parameters obtained were in accordance with the breed standards (Table 2). There were no statistical differences between replicates (p-value > 0.05).
Fast and Slow-Growing Management Systems: Characterisation of Broiler Caecal Microbiota Development throughout the Growing Period - Image 2
3.1. 16 rRNA Profiling of Fast and Slow-Growing Management Systems
The MiSeq sequencing of the 50 samples produced a total of 14,143,246 sequencing reads with an average of 282,864.9 reads per sample. Quality and chimera filtering produced a total of 12,661,675 filtered reads with an average of 253,233.5 reads per sample and ranging from 109,447 to 356,331 reads.
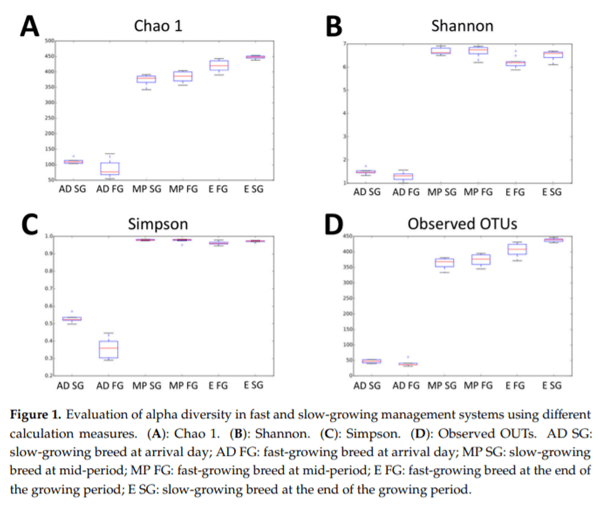
Assessment of rarefaction curves based on the Chao1, Shannon, Simpson and Observed OTUs biodiversity indexes calculated for the six sequence read groups (day-old chicks, mid-period and slaughter day results for fast and slow-growing management systems) indicated that four of the curves tended to reach a plateau (Tables S1–S4). However, samples from groups 1 and 2 (day-old chicks from both groups) are at the limit of the rarefaction, leaving a rarefaction number of 72,060 reads (Figure 1).
Fast and Slow-Growing Management Systems: Characterisation of Broiler Caecal Microbiota Development throughout the Growing Period - Image 3
The Chao1 alpha diversity index reveals a notable difference between the caecal microbiota depending on the moment of sampling (arrival, mid, end period) (Table 3). For the fast-growing management system, statistically significant differences (p-value < 0.05) were found between sampling moments. Samples from day-old chicks (88.3) displayed a lower level of complexity of the microbiota compared to that found at mid-period (384.4), and samples from mid-period animals displayed a lower level of complexity than the samples from the end of the growing period (420.3). Similarly, for the slow-growing management system, alpha diversity index increased throughout the growing period with statistically significant differences between sampling moments, with a result of 111.9, 373.8 and 447.2 on arrival day, at mid-period and at the end of the growing period, respectively.
Fast and Slow-Growing Management Systems: Characterisation of Broiler Caecal Microbiota Development throughout the Growing Period - Image 4
3.2. Differential Gut Microbiota Composition
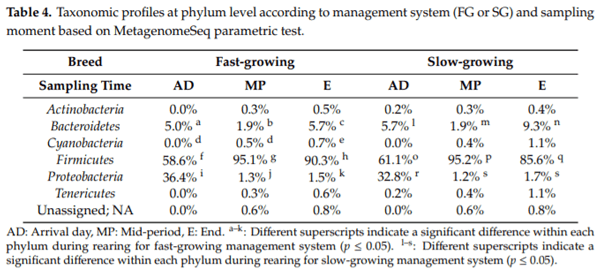
Inspection of predicted taxonomic profiles at phylum level for all samples based on a MetagenomeSeq parametric test is summarised in Table 4. This analysis showed that Firmicutes represented the dominant phylum of the caecal community in both management systems at all sampling times in the production cycle (p-value < 0.05). At the onset of the growing period, Proteobacteria was the second prevalent phylum for fast and slow-growing breeds, outnumbering the Bacteroidetes phylum. However, during the rest of the production cycle, the Bacteroidetes phylum was more abundant than Proteobacteria in both groups.
Fast and Slow-Growing Management Systems: Characterisation of Broiler Caecal Microbiota Development throughout the Growing Period - Image 5
For the fast-growing management system, there were statistically significant differences between the phyla prevalence and the time of sampling (arrival day, mid-period and end period). Proteobacteria and Bacteroidetes phyla were more abundant at the arrival day (36.4% and 5%, respectively). However, Firmicutes was the most prevalent phylum at mid-period (95.1%).
For the slow-growing management system, Bacteroidetes (5.7% at arrival day) and Firmicutes (95.2% at mid-period) showed the same pattern as in the fast-growing breed. However, statistically significant differences were shown between day-old chicks and the mid-period percentage of Proteobacteria (32.8% and 1.2%, respectively), which subsequently remained stable until the end of the cycle (1.7%).
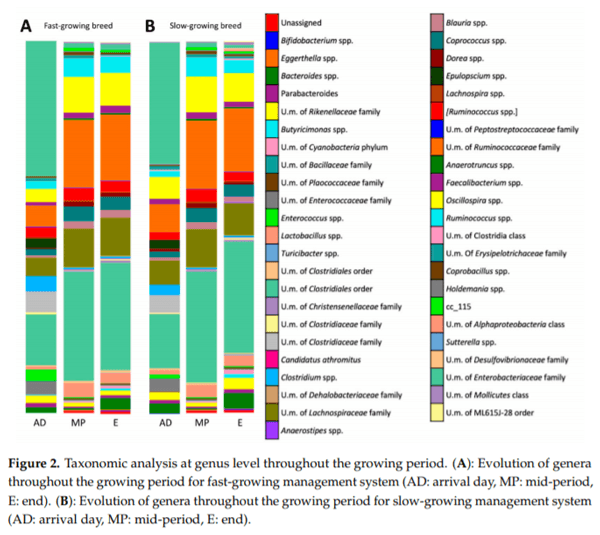
Furthermore, in this study 46 taxa were identified at genus level (Figure 2). Regardless of the management system and time point, the most predominant genera identified were Oscillospira spp. (7.5%), Ruminococcus spp. (3.6%), Coprococcus spp. (2.9%), Lactobacillus spp. (2.5%) and Bacteroides spp. (2.0%). In order to further identify microbiota composition for both breeds, we focused on 33 genera, which were shown to be present at an average relative abundance of more than 0.5% in at least one sample group [45].
In addition, it is important to highlight that 75% (24/32), 93% (40/43) and 97.8% (45/46) are common genera for both experimental groups at the beginning, mid- and end period, respectively (the different genera are detailed in Table S5).
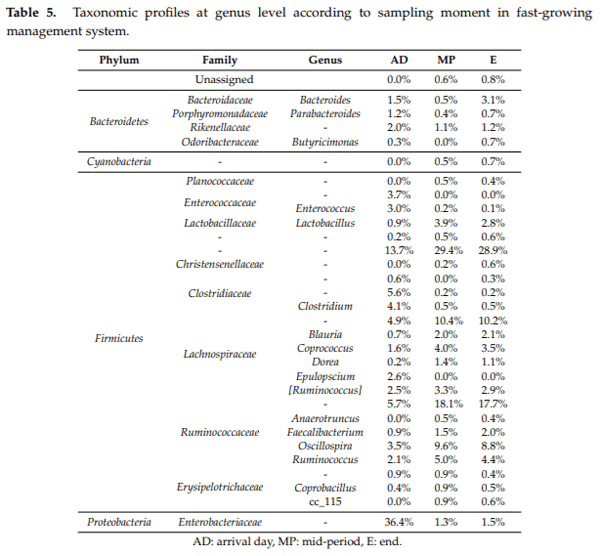
For the fast-growing management system, the results of the genera analysis are shown in Table 5. At arrival day, predominant bacteria of microbiota were Unclassified members (U. m.) of the Enterobacteriaceae family (36.4%), U. m. of the Clostridiaceae family (6.2%), U. m. of the Ruminococcaceae family (5.7%), U. m. of the Lachnospiraceae family (4.9%), Clostridium spp. (4.1%), U. m. of the Enterococcaceae family (3.7%), Oscillospira spp. (3.5%) and Enterococcus spp. (3.0%). At mid-period, the predominant genera in caecal samples were U. m. of the Ruminococcaceae family (18.1%), U. m. of the Lachnospiraceae family (10.4%), Oscillospira spp. (9.6%), Coprococcus spp. (4.0%), Lactobacillus spp. (3.9%) and [Ruminococcus] spp. (3.3%). Finally, at the end of the growing period, the most prevalent bacteria were U. m. of the Ruminococcaceae family (17.7%), U. m. of Lachnospiraceae family (10.2%), Oscillospira spp. (8.8%), Coprococcus spp. (3.5%) and Bacteroides spp. (3.1%).
Fast and Slow-Growing Management Systems: Characterisation of Broiler Caecal Microbiota Development throughout the Growing Period - Image 6
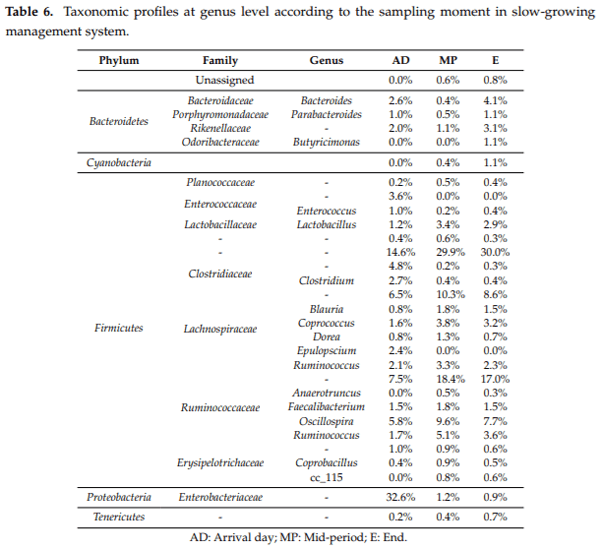
For the slow-growing management system, the results of the genera analysis are shown in Table 6. The pattern for day-old chicks was similar to that observed at this sampling time for the fast-growing group. The most abundant bacteria were U. m. of the Enterobacteriaceae family (32.6%), U. m. of the Ruminococcaceae family (7.5%), U. m. of the Lachnospiraceae family (6.5%), Oscillospira spp. (5.8%), U. m. of the Clostridiaceae family (4.8%) and U. m. of the Enterococcaceae family (3.6%). At mid-period, predominant genera were U. m. of the Ruminococcaceae family (18.4%), U. m. of the Lachnospiraceae family (10.3%), Oscillospira spp. (9.6%), Coprococcus spp. (3.8%), Lactobacillus spp. (3.4%) and Ruminococcus spp. (3.3%). Lastly, at slaughter day, U. m. of the Ruminococcaceae family (17.0%) were the most abundant bacteria, followed by U. m. of the Lachnospiraceae family (8.6%), Oscillospira spp. (7.7%), Coprococcus spp. (3.2%), Bacteroides spp. (4.1%) and Parabacteroides spp. (3.1%).
Fast and Slow-Growing Management Systems: Characterisation of Broiler Caecal Microbiota Development throughout the Growing Period - Image 7
 
Fast and Slow-Growing Management Systems: Characterisation of Broiler Caecal Microbiota Development throughout the Growing Period - Image 8
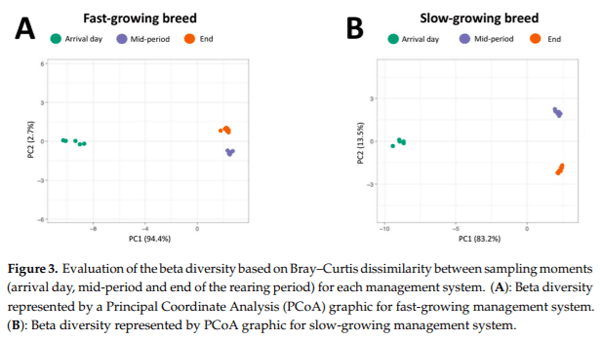
Finally, to assess differences in microbiota between sampling moments, beta diversity was analysed based on Bray–Curtis dissimilarity, Weighted UniFrac and Unweighted UniFrac indexes for these groups, after which the UniFrac distance matrix was represented through Principal Coordinate Analysis (PCoA). The R2 values obtained depending on the statistical test used were: Bray–Curtis R2 = 0.85, Unweighted UniFrac R2 = 0.73 and Weighted UniFrac R2 = 0.89 (these data are detailed in Table S6). These results support that microbiota diversity is significantly affected by the age of animals for both management systems (p-value = 0.001) (Figure 3). There is a notable difference between day-old chicks and the rest of the sampling moments for each group. However, mid-period and end sampling moments are also separated in PCoA graphics, indicating that microbiota diversity continued to increase, although to a lesser extent, until the end of the growing period.
Fast and Slow-Growing Management Systems: Characterisation of Broiler Caecal Microbiota Development throughout the Growing Period - Image 9
4. Discussion
The present study assessed the caecal microbiota in two different management systems: fast-growing and slow-growing, with two different genetic broiler breeds, during their respective growing periods. In fact, knowing the main microbiota composition during the growing period and how management practices could influence its modulation could help quick decisions be taken at farm level [46,47]. In this sense, it might be interesting to consider microbiota composition as a biomarker of poultry health and productive performance [7,9,48]. It is well demonstrated that a greater complexity of the gut microbiota is observed as animals grow [49–51]. Our findings showed that there is an important change in microbiota composition from animals’ arrival to the mid-period, and a less pronounced variation has been observed from mid-period to the end of rearing. Microbiota becomes relatively stable at 21 days of rearing, coinciding with the gut maturation in broilers [26,27,49,50]. Although some authors reported that bacterial diversity in the intestinal tract is higher in breeds with high feed efficiency [9,52], the results of this study showed a similar microbiota diversity for both breeds through the production cycle [26,53]. This evidences the importance of flock management during the production cycle in terms of microbiota balance control [9,11,54]. It is important that any antibiotic alternative introduced in farms, such as feed additives or management practices, should promote microbiota development of phyla related to gut health and productive performance.
Regarding gut microbiota composition, the predominant phyla obtained in this study for both management systems were Firmicutes and Bacteroidetes, followed by Proteobacteria [9,27,50,55]. The colonization of the gastrointestinal tract starts at the moment of hatching [2,9,56]. During the first days, it becomes successively colonized by Protebacteria, specially by the Enterobacteriaceae family, and by Firmicutes [11]. Afterwards, Firmicutes dominate the caecal population, followed by Bacteroidetes [55,57].
Firmicutes, constitutes a heterogeneous phylum containing bacterial groups with different metabolic activities, and several studies have shown that a high level of this phylum is correlated with good intestinal health [58,59]. The Bacteroidetes phylum is stable through the growing period for both systems, playing an important role in converting fermentable starch to simple sugars and these, in turn, to volatile fatty acids to meet the energy demand of the host, so their presence could be particularly affected by diet components [49,56,60]. At the onset of rearing, Proteobacteria are also found in a high concentration for both groups. An increment of this phylum is associated with dysbiosis and, consequently, with an increase in the presence of zoonotic bacteria belonging to this phylum, such as Salmonella or Campylobacter. For this reason, it is important to ensure strict management practices at the start of the growing period, as any stress could produce an increase in this phylum, and could result in a higher shedding of pathogenic bacteria and environmental contamination throughout rearing [9,58,61,62]. It is an important concern for the poultry sector to maintain these bacteria under control from the beginning to the end of rearing, the last step before loading, transport and processing of chickens at the slaughterhouse. Nowadays, Campylobacter and Salmonella are still the two most important causes of zoonotic diseases in Europe, and poultry products are the main source of human infection [63].
At genus level, it is important to highlight that 75%, 93% and 97.8% are common to both management systems, at the beginning, mid- and end period, respectively. These results could suggest that, despite management practices in the field, the microbiota could have a similar development for both broiler production systems [26,64]. Moreover, although there exist some variations at genus level, the results obtained in terms of microbiota composition are broadly similar for both management systems. According to other authors, slight changes in microbiota composition have not always entailed a performance consequence [53,65].
The most predominant genera were Oscillospira spp., Ruminococcus spp., Coprococcus spp., Lactobacillus spp. and Bacteroides spp., in line with data reported by other authors [27,47,55]. These genera are associated with higher production rates, so it might be said that high levels of these genera are indicators of adequate intestinal health in poultry [5,6,47,50]. Among these, Ruminococcus spp. is known for its ability to degrade complex carbohydrates and thus may have contributed to an improved degradation of dietary fibre [66,67]. Moreover, Lactobacillus spp. is an important probiotic in promoting healthy gut, as these bacteria are believed to be responsible for starch decomposition and lactate fermentation [6,47,50,56]. In turn, Bacteroidetes spp. plays an important role in breaking down complex molecules to simpler compounds which are also essential for growth of the host and gut microbiota development [56,66]. In this aspect, feed has a vital influence on genus development [58,68–70]. In this study, fast-growing birds were fed a corn-based diet and slow-growing birds were fed a wheat-based one. Different studies support that diets based on barley or wheat instead of corn-based ones increase the prevalence of Lactobacillus spp. at caeca level [69,71,72], but these diets also could favour the proliferation of Clostridium perfringens and predispose young chicks to necrotic enteritis [68,73,74]. Nevertheless, corn- or soy-based diets could be deficient in available phosphorus and supplementation is often necessary [75]. Therefore, the most important aspect of diet management is to meet the metabolic requirements of animals by using a balanced diet formulation [36,68]. The application at field level of management techniques that produce the correct balance of any group of microorganisms that benefit intestinal health could result in animal health and productivity. Likewise, management techniques that favour the development of undesirable bacterial groups always need to be discarded.
In short, there are numerous factors that influence on microbiota composition development, and all of them should be valued globally in situ, according to their specific production characteristics [11]. Therefore, developing molecular techniques that can be applied in the field to measure the balance of the microbiota in each specific case could help us assess the impact of different management techniques on day-to-day work, and could be a promising line of research for our sector.
5. Conclusions
In conclusion, fast and slow-growing broiler microbiota is in constant development throughout rearing, being relatively stable at 21 days of age. Firmicutes and Proteobacteria are the most abundant phyla at the onset of the production cycle. However, while the Firmicutes increased their concentration for the two management systems throughout the growing period, the Proteobacteria decreased until the end of the cycle. Regarding the genus, it should be noted that the three most abundant groups for both systems, R uminococcus spp., Lactobacillus spp. and Bacteroides spp., are related to better productive performance and intestinal health.
Supplementary Materials: The following are available online athttp://www.mdpi.com/2076-2615/10/8/1401/s1,Table S1. Statistical comparison of alpha diversity between sample groups based on Chao 1 index, Table S2. Statistical comparation of alpha diversity between sample groups based on Shannon index, Table S3. Statistical comparation of alpha diversity between sample groups based on Simpson index, Table S4. Statistical comparation of alpha diversity between sample groups based on Observed OTUs index, Table S5. Different taxonomic profiles at genus level according to the moment of the growing period in fast (FG) and slow-growing (SG) breeds, Table S6. Statistical comparison between beta diversity indexes calculated according to the di erent methods.
Author Contributions: Data curation, L.M.-D., M.T.P.-G., C.M. and S.V.; Formal analysis, L.M.-D., C.M. andM.d.T.; Funding acquisition, A.V.; Investigation, L.M.-D. and C.M.; Methodology, A.V.and C.M.; Writing—original draft, L.M.-D. and C.M.; Writing—review and editing, A.V., M.d.T., M.T.P.-G., S.V. and C.M. All authors have read and agreed to the published version of the manuscript.
Funding: This research was funded by the National Institute for Agricultural Research and Experimentation and the Ministry of Economy, Industry and Competitiveness (RTA 2017-00013, Programme: MINECO, Ministerio de Economía y Competitividad) and University CEU-UCH (INDI 19/20).
Acknowledgments: The authors wish to thank the “Improvement of Production System-related Food Safety andEnd Products” research group (Veterinary Faculty, University CEU-Cardenal Herrera) for their technical support. English text version was revised by N. Macowan English Language Service.
Conflicts of Interest: The authors declare no conflict of interest.
 
This article was originally published in Animals 2020, 10, 1401; doi:10.3390/ani10081401. This is an Open Access article distributed under the terms and conditions of the Creative Commons Attribution (CC BY) License (http://creativecommons.org/licenses/by/4.0/).
  1. Oakley, B.B.; Lillehoj, H.S.; Kogut, M.H.; Kim, W.K.; Maurer, J.J.; Pedroso, A.; Lee, M.D.; Collett, S.R.; Johnson, T.J.; Cox, N.A. The chicken gastrointestinal microbiome. FEMS Microbiol. Lett. 2014, 360, 100–112. [CrossRef] [PubMed]
  2. Stanley, D.; Hughes, R.J.; Moore, R.J. Microbiota of the chicken gastrointestinal tract: Influence on health, productivity and disease. Appl. Microbiol. Biotechnol. 2014, 98, 4301–4310. [CrossRef] [PubMed]
  3. Pourabedin, M.; Zhao, X. Prebiotics and gut microbiota in chickens. FEMS Microbiol. Lett. 2015, 362, 1–8. [CrossRef] [PubMed]
  4. Sender, R.; Fuchs, S.; Milo, R. Revised Estimates for the Number of Human and Bacteria Cells in the Body. PLoS Biol. 2016, 14. [CrossRef]
  5. Banerjee, S.; Sar, A.; Misra, A.; Pal, S.; Chakraborty, A.; Dam, B. Increased productivity in poultry birds by sub-lethal dose of antibiotics is arbitrated by selective enrichment of gut microbiota, particularly short-chain fatty acid producers. Microbiology (United Kingdom) 2018, 164, 142–153. [CrossRef]
  6. Clavijo, V.; Flórez, M.J.V. The gastrointestinal microbiome and its association with the control of pathogens in broiler chicken production: A review. Poult. Sci. 2018, 97, 1006–1021. [CrossRef]
  7. Pandit, R.J.; Hinsu, A.T.; Patel, N.V.; Koringa, P.G.; Jakhesara, S.J.; Thakkar, J.R.; Shah, T.M.; Limon, G.; Psifidi, A.; Guitian, J.; et al. Microbial diversity and community composition of caecal microbiota in commercial and indigenous Indian chickens determined using 16s rDNA amplicon sequencing. Microbiome 2018, 6, 1–13. [CrossRef]
  8. Shang, Y.; Kumar, S.; Oakley, B.; Kim, W.K. Chicken gut microbiota: Importance and detection technology. Front. Vet. Sci. 2018, 5. [CrossRef]
  9. Carrasco, J.M.D.; Casanova, N.A.; Miyakawa, M.E.F. Microbiota, gut health and chicken productivity: What is the connection? Microorganisms 2019, 7, 374. [CrossRef]
  10. Sekirov, I.; Russell, S.L.; Caetano, M.; Antunes, L.; Finlay, B.B. Gut microbiota in health and disease. Physiol. Rev. 2010, 90, 859–904. [CrossRef]
  11. Kers, J.G.; Velkers, F.C.; Fischer, E.A.J.; Hermes, G.D.A.; Stegeman, J.A.; Smidt, H. Host and environmental factors a ecting the intestinal microbiota in chickens. Front. Microbiol. 2018, 9, 1–14. [CrossRef] [PubMed]
  12. WHO|Antimicrobial Resistance: Global Report on Surveillance 2014; World Health Organization: Geneva, Switzerland, 2014.
  13. Alós, J. Resistencia bacteriana a los antibióticos: Una crisis global. Enferm. Infecc. Microbiol. Clin. 2015, 33, 692–699. [CrossRef] [PubMed]
  14. Gadde, U.; Kim, W.H.; Oh, S.T.; Lillehoj, H.S. Alternatives to antibiotics for maximizing growth performance and feed e ciency in poultry: A review. Anim. Health Res. Rev. 2017, 18, 26–45. [CrossRef]
  15. Montoro-Dasi, L.; Villagra, A.; Sevilla-Navarro, S.; Pérez-Gracia, M.T.; Vega, S.; Marin, C. The dynamic of antibiotic resistance in commensal Escherichia coli throughout the growing period in broiler chickens: Fast-growing vs. slow-growing breeds. Poult. Sci. 2020, 99, 1591–1597. [CrossRef] [PubMed]
  16. Hancock, R.E.W.; Nijnik, A.; Philpott, D.J. Modulating immunity as a therapy for bacterial infections for bacterial infections. Nat. Rev. Microbiol. 2012, 10, 243–254. [CrossRef] [PubMed]
  17. Cheng, G.; Hao, H.; Xie, S.; Wang, X.; Dai, M.; Huang, L.; Yuan, Z. Antibiotic alternatives: The substitution of antibiotics in animal husbandry? Front. Microbiol. 2014, 5, 1–15. [CrossRef]
  18. Castellini, C.; Bosco, A.D. Animal Welfare and Poultry Meat in Alternative Production Systems (and Ethics of Poultry Meat Production); Elsevier Ltd.: Amsterdam, The Netherlands, 2017; ISBN 9780081007631.
  19. Polycarpo, G.V.; Andretta, I.; Kipper, M.; Dadalt, J.C.; Rodrigues, P.H.M.; Albuquerque, R. Meta-analytic study of organic acids as an alternative performance-enhancing feed additive to antibiotics for broiler chickens. Poult. Sci. 2017, 96, 3645–3653. [CrossRef]
  20. Suresh, G.; Das, R.K.; Brar, S.K.; Rouissi, T.; Ramirez, A.; Chorfi, Y.; Godbout, S. Critical Reviews in Microbiology Alternatives to antibiotics in poultry feed: Molecular perspectives. Crit. Rev. Microbiol. 2017, 1–18. [CrossRef]
  21. Alagawany, M.; Abd El-Hack, M.E.; Farag, M.R.; Sachan, S.; Karthik, K.; Dhama, K. The use of probiotics as eco-friendly alternatives for antibiotics in poultry nutrition. Environ. Sci. Pollut. Res. 2018, 25, 10611–10618. [CrossRef]
  22. Sevilla-Navarro, S.; Marín, C.; Cortés, V.; García, C.; Vega, S.; Catalá-Gregori, P. Autophage as a control measure for Salmonella in laying hens. Poult. Sci. 2018, 97, 4367–4373. [CrossRef]
  23. Kogut, M.H.; Yin, X.; Yuan, J.; Broom, L. Gut health in poultry. CAB Rev. Perspect. Agric. Vet. Sci. Nutr. Nat. Resour. 2017, 12. [CrossRef]
  24. Pedroso, A.A.; Menten, J.F.M.; Lambais, M.R. The Structure of Bacterial Community in the Intestines of Newly Hatched Chicks. J. Appl. Poult. Res. 2005, 14, 232–237. [CrossRef]
  25. Oakley, B.B.; Morales, C.A.; Line, J.; Berrang, M.E.; Meinersmann, R.J.; Tillman, G.E.; Wise, M.G.; Siragusa, G.R.; Hiett, K.L.; Seal, B.S. The Poultry-Associated Microbiome: Network Analysis and Farm-to-Fork Characterizations. PLoS ONE 2013, 8. [CrossRef] [PubMed]
  26. Richards, P.; Fothergill, J.; Bernardeau, M.; Wigley, P. Development of the caecal microbiota in three broiler breeds. Front. Vet. Sci. 2019, 6. [CrossRef]
  27. Xi, Y.; Shuling, N.; Kunyuan, T.; Qiuyang, Z.; Hewen, D.; ChenCheng, G.; Tianhe, Y.; Liancheng, L.; Xin, F. Characteristics of the intestinal flora of specific pathogen free chickens with age. Microb. Pathog. 2019, 132, 325–334. [CrossRef]
  28. Brisbin, J.T.; Gong, J.; Sharif, S. Interactions between commensal bacteria and the gut-associated immune system of the chicken. Anim. Health Res. Rev. 2008, 9, 101–110. [CrossRef]
  29. Rasschaert, G.; Houf, K.; Godard, C.; Wildemauwe, C.; Pastuszczak-Frak,? M.; De Zutter, L. Contamination of carcasses with Salmonella during poultry slaughter. J. Food Prot. 2008, 71, 146–152. [CrossRef]
  30. Ellerbroek, L.I.; Lienau, J.A.; Klein, G. Campylobacter spp. in broiler flocks at farm level and the potential for cross-contamination during slaughter. Zoonoses Public Health 2010, 57. [CrossRef]
  31. Sevilla-Navarro, S.; Marin, C.; Cortés, V.; García, C.; Catalá-Gregori, P. Campylobacter prevalence and risk factors associated with exceeding allowable limits in poultry slaughterhouses in Spain. Vet. Rec. 2020, 186. [CrossRef]
  32. Kogut, M.H. The e ect of microbiome modulation on the intestinal health of poultry. Anim. Feed Sci. Technol. 2019, 250, 32–40. [CrossRef]
  33. Spain 2013. Royal Degree 53/2013, 1st of Febrary, por el que se Establecen las Normas Básicas Aplicables Para la Protección de los Animales Utilizados en Experimentación y Otros Fines Científicos, Incluyendo la Docencia; Boletín Oficial del Estado: Madrid, Spain, 2013; Volume 34, pp. 11370–11421.
  34. Ross. Ross 308/Ross 308 FF broiler: Performance Objectives. Available online: http://es.aviagen.com/assets/Tech_Center/Ross_Broiler/Ross308-308FF-BroilerPO2019-EN.pdf (accessed on 17 June 2020).
  35. Valls, M. Reproductoras y Pollos de Crecimiento Lento Como Producto Diferenciado. Available online: https://avicultura.info/reproductoras-y-pollos-de-crecimiento-lento/ (accessed on 17 June 2020).
  36. Santomá, G.; Mateos, G.G. Necesidades Nutricionales para Avicultura: Normas FEDNA, 2nd ed.; FEDNA (Fundación Española Desarrollo Nutrición Animal): Madrid, Spain; ISBN 9788409065295.
  37. Illumina Support. 16S Metagenomic Sequencing Library Preparation. Available online: https://support.illumina.com/documents/documentation/chemistry_documentation/16s/16s-metagenomic-library-prep-guide-15044223-b.pdf (accessed on 17 June 2020).
  38. Babraham Bioinformatics. FastQC A Quality Control tool for High Throughput Sequence Data. Available online: https://www.bioinformatics.babraham.ac.uk/projects/fastqc/ (accessed on 17 June 2020).
  39. Babraham Bioinformatics. Trim Galore! Available online: https://www.bioinformatics.babraham.ac.uk/projects/trim_galore/ (accessed on 17 June 2020).
  40. Caporaso, J.G.; Kuczynski, J.; Stombaugh, J.; Bittinger, K.; Bushman, F.D.; Costello, E.K.; Fierer, N.; P?a, A.G.; Goodrich, J.K.; Gordon, J.I.; et al. QIIME allows analysis of high-throughput community sequencing data. Nat. Methods 2010, 7, 335–336. [CrossRef] [PubMed]
  41. Heberle, H.; Meirelles, V.G.; da Silva, F.R.; Telles, G.P.; Minghim, R. InteractiVenn: A web-based tool for the analysis of sets through Venn diagrams. BMC Bioinform. 2015, 16. [CrossRef] [PubMed]
  42. Qiime (Quantitative Insights Into Microbial Ecology). Compare_alpha_diversity.py–This Script Compares Alpha Diversities Based on a Two-Sample t-test Using Either Parametric or Non-Parametric (Monte Carlo) Methods. Available online: http://qiime.org/scripts/compare_alpha_diversity.html (accessed on 18 June 2020).
  43. Paulson, J.N.; Colin Stine, O.; Bravo, H.C.; Pop, M. Di erential abundance analysis for microbial marker-gene surveys. Nat. Methods 2013, 10, 1200–1202. [CrossRef] [PubMed]
  44. McMurdie, P.J.; Holmes, S. Waste Not, Want Not: Why Rarefying Microbiome Data Is Inadmissible. PLoS Comput. Biol. 2014, 10. [CrossRef]
  45. Mancabelli, L.; Ferrario, C.; Milani, C.; Mangifesta, M.; Turroni, F.; Duranti, S.; Lugli, G.A.; Viappiani, A.; Ossiprandi, M.C.; van Sinderen, D.; et al. Insights into the biodiversity of the gut microbiota of broiler chickens. Environ. Microbiol. 2016, 18, 4727–4738. [CrossRef]
  46. Wahlström, A.; Sayin, S.I.; Marschall, H.U.; Bäckhed, F. Intestinal Crosstalk between Bile Acids and Microbiota and Its Impact on Host Metabolism. Cell Metab. 2016, 24, 41–50. [CrossRef]
  47. Hasan, N.; Yang, H. Factors a ecting the composition of the gut microbiota, and its modulation. PeerJ 2019, 8, 1–31. [CrossRef]
  48. Wang, J.; Nesengani, L.T.; Gong, Y.; Yang, Y.; Lu, W. 16S rRNA gene sequencing reveals e ects of photoperiod on cecal microbiota of broiler roosters. PeerJ 2018, 2. [CrossRef]
  49. Lu, J.; Idris, U.; Harmon, B.; Hofacre, C.; Maurer, J.J.; Lee, M.D. Diversity and Succession of the Intestinal Bacterial Community of the Maturing Broiler Chicken. Appl. Environ. Microbiol. 2003, 69, 6816–6824. [CrossRef]
  50. Mohd Shaufi, M.A.; Sieo, C.C.; Chong, C.W.; Gan, H.M.; Ho, Y.W. Deciphering chicken gut microbial dynamics based on high-throughput 16S rRNA metagenomics analyses. Gut Pathog. 2015, 7, 1–12. [CrossRef]
  51. Ocejo, M.; Oporto, B.; Hurtado, A. 16S rRNA amplicon sequencing characterization of caecal microbiome composition of broilers and free-range slow-growing chickens throughout their productive lifespan. Sci. Rep. 2019, 9, 1–14. [CrossRef]
  52. Stanley, D.; Denman, S.E.; Hughes, R.J.; Geier, M.S.; Crowley, T.M.; Chen, H.; Haring, V.R.; Moore, R.J. Intestinal microbiota associated with di erential feed conversion e ciency in chickens. Appl. Microbiol. Biotechnol. 2012, 96, 1361–1369. [CrossRef] [PubMed]
  53. Schokker, D.; Veninga, G.; Vastenhouw, S.A.; Bossers, A.; de Bree, F.M.; Kaal-Lansbergen, L.M.T.E.; Rebel, J.M.J.; Smits, M.A. Early life microbial colonization of the gut and intestinal development di er between genetically divergent broiler lines. BMC Genom. 2015, 16. [CrossRef] [PubMed]
  54. Qu, A.; Brulc, J.M.; Wilson, M.K.; Law, B.F.; Theoret, J.R.; Joens, L.A.; Konkel, M.E.; Angly, F.; Dinsdale, E.A.; Edwards, R.A.; et al. Comparative metagenomics reveals host specific metavirulomes and horizontal gene transfer elements in the chicken cecum microbiome. PLoS ONE 2008, 3. [CrossRef]
  55. Wei, S.; Morrison, M.; Yu, Z. Bacterial census of poultry intestinal microbiome. Poult. Sci. 2013, 92, 671–683. [CrossRef]
  56. Rychlik, I. Composition and function of chicken gut microbiota. Animals 2020, 10, 103. [CrossRef]
  57. Ballou, A.L.; Ali, R.A.; Mendoza, M.A.; Ellis, J.C.; Hassan, H.M.; Croom, W.J.; Koci, M.D. Development of the chick microbiome: How early exposure influences future microbial diversity. Front. Vet. Sci. 2016, 3. [CrossRef]
  58. Ducatelle, R.; Goossens, E.; De Meyer, F.; Eeckhaut, V.; Antonissen, G.; Haesebrouck, F.; Van Immerseel, F. Biomarkers for monitoring intestinal health in poultry: Present status and future perspectives. Vet. Res. 2018, 49, 1–9. [CrossRef]
  59. Yacoubi, N.; Saulnier, L.; Bonnin, E.; Devillard, E.; Eeckhaut, V.; Rhayat, L.; Ducatelle, R.; Van Immerseel, F. Short-chain arabinoxylans prepared from enzymatically treated wheat grain exert prebiotic e ects during the broiler starter period. Poult. Sci. 2018, 97, 412–424. [CrossRef]
  60. Kumar, S.; Chen, C.; Indugu, N.; Werlang, G.O.; Singh, M.; Kim, W.K.; Thippareddi, H. E ect of antibiotic withdrawal in feed on chicken gut microbial dynamics, immunity, growth performance and prevalence of foodborne pathogens. PLoS ONE 2018, 13, 1–23. [CrossRef]
  61. Neal-McKinney, J.M.; Lu, X.; Duong, T.; Larson, C.L.; Call, D.R.; Shah, D.H.; Konkel, M.E. Production of Organic Acids by Probiotic Lactobacilli Can Be Used to Reduce Pathogen Load in Poultry. PLoS ONE 2012, 7. [CrossRef]
  62. Shin, N.R.; Whon, T.W.; Bae, J.W. Proteobacteria: Microbial signature of dysbiosis in gut microbiota. Trends Biotechnol. 2015, 33, 496–503. [CrossRef] [PubMed]
  63. The European Union One Health 2018 Zoonoses Report. EFSA J. 2019, 17. [CrossRef]
  64. Zhao, L.; Wang, G.; Siegel, P.; He, C.; Wang, H.; Zhao, W.; Zhai, Z.; Tian, F.; Zhao, J.; Zhang, H.; et al. Quantitative genetic background of the host influences gut microbiomes in chickens. Sci. Rep. 2013, 3. [CrossRef]
  65. Torok, V.A.; Hughes, R.J.; Mikkelsen, L.L.; Perez-Maldonado, R.; Balding, K.; MacAlpine, R.; Percy, N.J.; Ophel-Keller, K. Identification and characterization of potential performance-related gut microbiotas in broiler chickens across various feeding trials. Appl. Environ. Microbiol. 2011, 77, 5868–5878. [CrossRef] [PubMed]
  66. Flint, H.J.; Scott, K.P.; Duncan, S.H.; Louis, P.; Forano, E. Microbial degradation of complex carbohydrates in the gut. Gut Microbes 2012, 3. [CrossRef]
  67. Siegerstetter, S.C.; Schmitz-Esser, S.; Magowan, E.; Wetzels, S.U.; Zebeli, Q.; Lawlor, P.G.; O’Connell, N.E.; Metzler-Zebeli, B.U. Intestinal microbiota profiles associated with low and high residual feed intake in chickens across two geographical locations. PLoS ONE 2017, 12, 1–23. [CrossRef]
  68. Jha, R.; Singh, A.K.; Yadav, S.; Berrocoso, J.F.D.; Mishra, B. Early Nutrition Programming (in ovo and Post-hatch Feeding) as a Strategy to Modulate Gut Health of Poultry. Front. Vet. Sci. 2019, 6. [CrossRef]
  69. Yadav, S.; Jha, R. Strategies to modulate the intestinal microbiota and their e ects on nutrient utilization, performance, and health of poultry. J. Anim. Sci. Biotechnol. 2019, 10, 1–11. [CrossRef]
  70. Zhu, X.Y.; Zhong, T.; Pandya, Y.; Joerger, R.D. 16S rRNA-based analysis of microbiota from the cecum of broiler chickens. Appl. Environ. Microbiol. 2002, 68, 124–137. [CrossRef]
  71. Rodríguez, M.L.; Rebolé, A.; Velasco, S.; Ortiz, L.T.; Treviño, J.; Alzueta, C. Wheat- and barley-based diets with or without additives influence broiler chicken performance, nutrient digestibility and intestinal microflora. J. Sci. Food Agric. 2012, 92, 184–190. [CrossRef]
  72. Paraskeuas, V.; Mountzouris, K.C. Broiler gut microbiota and expressions of gut barrier genes a ected by cereal type and phytogenic inclusion. Anim. Nutr. 2019, 5, 22–31. [CrossRef] [PubMed]
  73. Pan, D.; Yu, Z. Intestinal microbiome of poultry and its interaction with host and diet. Gut Microbes 2014, 5, 108–119. [CrossRef] [PubMed]
  74. Chen, J.; Tellez, G.; Richards, J.D.; Escobar, J. Identification of potential biomarkers for gut barrier failure in broiler chickens. Front. Vet. Sci. 2015, 2. [CrossRef] [PubMed]
  75. Fernandes, J.I.M.; Lima, F.R.; Mendonça, C.X.; Mabe, I.; Albuquerque, R.; Leal, P.M. Relative bioavailability of phosphorus in feed and agricultural phosphates for poultry. Poult. Sci. 1999, 78, 1729–1736. [CrossRef]
Related topics
Authors:
Laura Montoro Dasí
Follow
Join to be able to comment.
Once you join Engormix, you will be able to participate in all content and forums.
* Required information
Would you like to discuss another topic? Create a new post to engage with experts in the community.
Create a post
Join Engormix and be part of the largest agribusiness social network in the world.
LoginRegister