Evaluating Uniformity in Broilers
Evaluating Uniformity in Broilers - Factors Affecting Variation
1) Characteristics of the uniformity of a broiler flock.
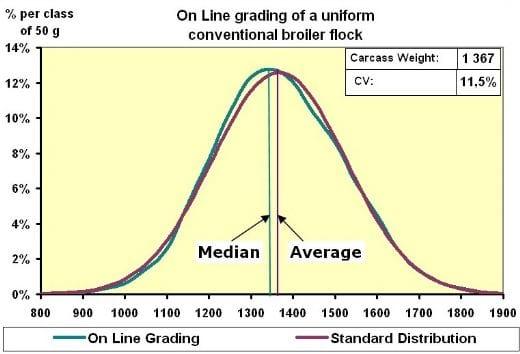
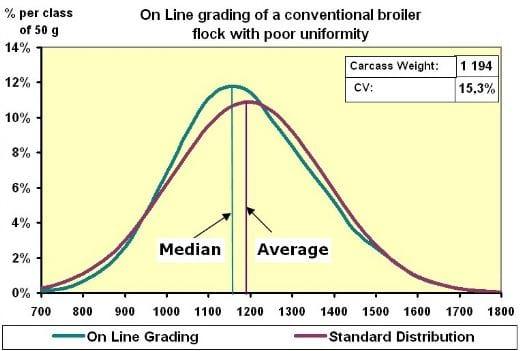
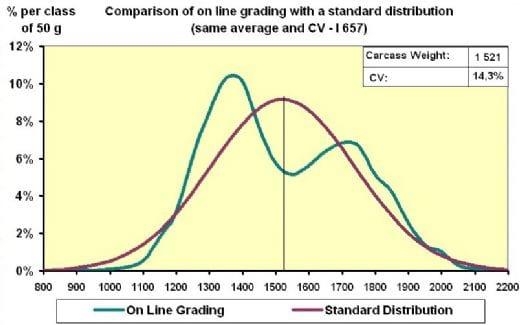
Before reviewing the principal factors affecting uniformity, it is necessary to define the characteristics of a "standard" broiler population. In practice the standard method is to calculate uniformity on +/- 10%. However this calculation only gives a very partial picture of the characteristics of a population. The following graphs explain the preference for the use of "Coefficient of Variation" (C.V.) (the standard deviation divided by the average). Some on line systems calculate this automatically.
Graphs 1: Comparison of the on line carcass weights of 2 flocks of as hatched conventional broilers with the same standard distribution curve for the average and uniformity (C.V.).
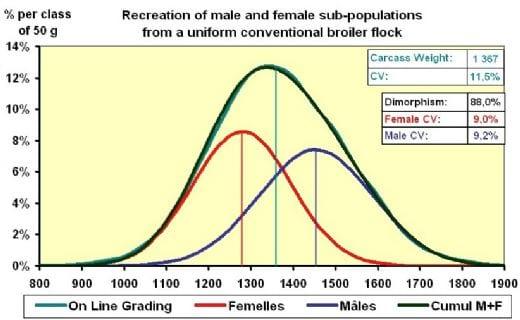
The first reason is purely statistical. It is explained by the fact that a flock of "as hatched" broilers consists of equal amounts of males and females, each with their own level of uniformity. Let's suppose, arbitrarily, that the C.V. of the two sexes is identical, the standard deviation for males is larger and therefore the percentage of birds in each division is lower. Because of this the male curve is flatter than that of the females.
Graphs 2: Sub-populations of males and females taken from as hatched conventional broiler flocks, redrawn to show the characteristics of on line weighing.
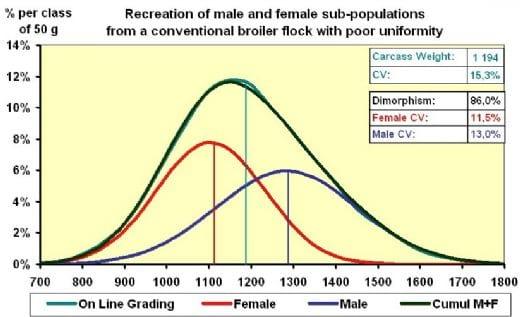
Graphs 3: Sub-populations of males and females taken from as hatched Label broilers, redrawn to show the characteristics of on line weighing.
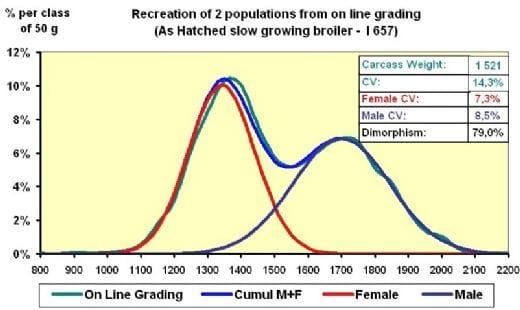
The model used to show the cumulative of the two sub-populations using on line weighing plays with the variation of the three parameters, which are dimorphism, C.V. of the males and of the females, assuming that the number of birds in two sexes is identical.
2) Factors of variation of uniformity in broiler flocks: Management of the breeders
Day old chick weight is proportional to the age of the breeders between 25 and 35 weeks and tends to stabilize progressively thereafter. Additionally, achieving the breeder bodyweight target with regular weekly weight gain during the first 6-8 weeks of their life, the subsequent feed management and the correct level of sexual maturity for the breed are the most important criteria that will determine the uniformity of the chicks. This requires good brooding conditions, moderate feed restriction before 6 weeks, black out rearing and sufficient feed equipment.
Incubation conditions and mixing of the chicks
Trying to achieve maximum chick uniformity by weighing the eggs from the many different aged donor flocks or by storing eggs from a few breeder flocks, does not guarantee good final flock uniformity. On the one hand, stored eggs for over 7 days and eggs from very young breeder flocks require longer incubation time than the others. The first chicks to hatch risk dehydration, waiting for the completion of the hatch. On the other hand, experience shows that mixing of the different "donor flock" micro-organisms may compromise the sanitary level of the whole hatch.
Brooding conditions
Inadequate brooding conditions are usually the first cause of poor uniformity. During this period the daily weight gain is considerable. During the first 10 days, the chicks increase their weight by 20% per day compared to 4% between 30 and 40 days, provided that they do not have to struggle to survive. When chicks are struggling to survive, they use the small amount of available energy to maintain vital body functions. It is always useful to remember that chicks:
• cannot regulate their body temperature before 10-15 days of age
• are stimulated to eat by light
• limit their intake when access to water or feed is difficult.
The chicks are not all equal when they arrive at the farm. Firstly, at hatch they have different maternal origins and embryonic conditions. Furthermore, because they hatch at different times, have been transported in different positions in the delivery vehicle and finally, because the living conditions are never perfectly equal throughout the whole house. It is not uncommon to observe chicks suffering from cold air currents due to a poorly insulated door in winter, huddling together to warm themselves and two meters down the house conditions are optimal. This demonstrates that their ability to find the conditions to suit them is at best limited.
Sanitary problems
Sanitary problems have a variable impact on uniformity. Let's take an example of highly infective Gumboro disease affecting a flock at 25 days of age. The survivors are generally uniform. The only explanation is that the birds with poor immunity are dead and that the others have all or nearly all been affected with the same intensity.
Ventilation
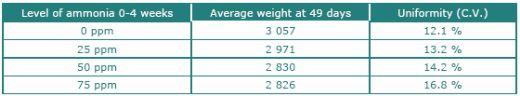
Ammonia is well known to lower the feed intake and delay growth, but less for causing poor uniformity. An experiment was conducted in 2002 at the University of Mississippi to evaluate the effect of exposure to ammonia during the first 4 weeks on growth and uniformity at 7 weeks. The reported results speak for themselves.
Nutrition
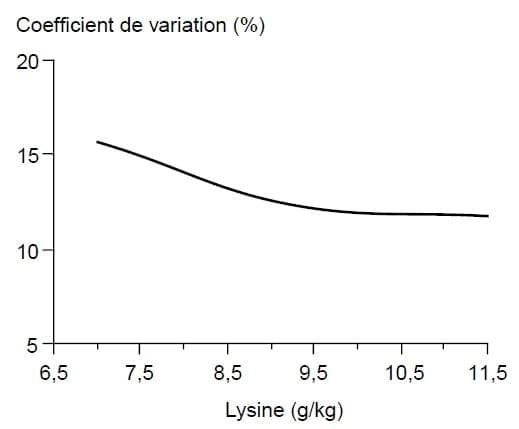
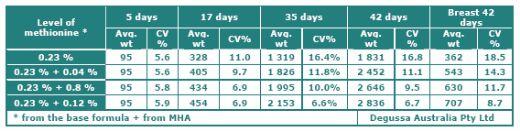
Deficiency of lysine, as with other amino acids, induces poor uniform growth (Leclercq et al 1994). The effect is not linear (see graph to the left) and stabilizes when the requirements for growth are attained.
3) Conclusions
Any artificial system established to assess the uniformity of non-sexed broilers and used as a quality indicator of the production process, will prove to be a delicate and laborious exercise, because of the characteristics of the different populations.
Evaluation of non-sexed broiler uniformity, is best accomplished by analysing the on line weighing information (or when on line weighing is not available organise a representative sample of carcasses) taken from some average flocks. After a period of trial necessary to calibrate this method, it can be used as a supplementary production indicator in the same way as growth rate, mortality or FCR.
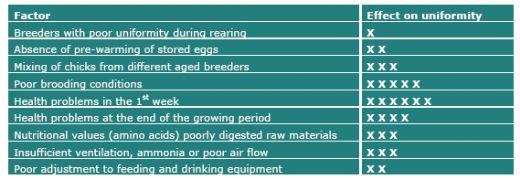
Suggested causes of poor uniformity and their effect


Dear Sir,
I am really thankful for this technical article on Uniformity in Broilers which will help
us out to look after the microlevel to avoid the Flock uniformity in future at field level.
I have one doubt in my mind, if you look after the table in atrticle showing
relationship of Methionine level in feed with the flock uniformity CV[percent]. Please confirm
us wheteher highlighted figure is a typing error or that is a fact.
Level of Methinonine 5 Days 17 Days 35 Days 42 Days Breast 42 Days
Avg.Wt CV[percent] Avg.Wt CV[percent] Avg.Wt CV[percent] Avg.Wt CV[percent] Avg.Wt CV[percent]
0.23[percent] 95 5.6 328 11 1319 16.4 1831 16.8 362 18.5
0.23[percent]+0.04[percent] 95 5.6 405 9.7 1826 11.8 2452 11.1 543 14.3
0.23[percent]+0.8[percent] 95 5.8 434 6.9 1995 10 2646 9.5 630 11.7
0.23[percent]+0.12[percent] 95 5.9 454 6.9 2153 6.6 2836 6.7 707 8.7
Note: I feel stongly that the value highlighted should be 0.23[percent] + 1.2[percent] Thanks & regards,
Dr Jaydip


.jpg&w=3840&q=75)