Introduction
In recent years, several peer-reviewed papers have been published regarding the dLYS or other amino acid requirements of modern high-lean genotype broilers (Dozier et al., 2009a,b, 2010 and Everett et al., 2010). In addition, recommendations for nutrient levels at various phases and levels of broiler production have also been published (Tillman, 2007, 2008, 2010, 2011; Rostagno, 2011).
In this paper, a set of data from Dozier et al. (2010) will be utilized and examined in detail. In particular, the data from experiment 2 of that paper for body weight, body weight gain, feed conversion, carcass weight and breast meat weight will be evaluated. The experiment under review examined the dLYS requirement of male Cobb 700 broilers from day 28 to 42 across nine (9) titrated levels from 0.64% to 1.20%. The low and high dLYS diets, representing the basal and summit titration diets respectively, were formulated and manufactured and then blended in appropriate proportions so as to make seven (7) intermediate titration diets providing dLYS increments of 0.07% points. Each titration diet, as well as the 0.99% control diet was replicated across 12 pens, and were equalized to contain 23 birds each on day 28 providing 0.09 m2 of space per bird. Temperature and lighting regimes were maintained according to strict protocol as defined within the published paper. At day 43, 5 birds from each pen were processed to measure carcass weight and yield along with breast weight and yield. As weight is the commodity ultimately sold and therefore has a direct impact upon revenue generation and profitability, only carcass and breast meat weight be discussed here. Optimal dLYS levels, based upon fitting the data to quadratic broken-line analysis were reported for the performance and processing variables measured. In this report, the use of additional models and approaches will be used to fit the data for comparative purposes. This will be done using both Static : Production and Dynamic : Market analysis.
Static : Production Analysis
There are numerous models that can be used in determining a breakpoint or requirement point within a given set of data (Eits et al., 2005a; Sakomura and Rostagno, 2007, Pesti et al. 2009c). Several of these models generate plateaus where a maximum response is defined with the linear broken line (LBL) and Quadratic Broken Line (QBL) models being specific in this regard. The LBL always gives a lower requirement estimate than does the QBL and may be considered as under-estimating the requirement. The QBL model, due to its inherent diminishing response, near the breakpoint, is a better estimate for a biological response than is the LBL. Both the LBL and QBL models have been used extensively over time and so will not be further defined here. Another quite common model is the quadratic polynomial (QPmax); it provides a maximum response point that is usually quite high and may be considered as providing an over-estimation of the requirement. Because of this, it is quite common to see reported values as being some percentage (90%-95%) of the QPmax, for example. In this analysis, a factor of 90% of the QPmax is reported (QPmax90) as shown in Figures 1-5. Another model employed here uses a quadratic portion initially followed by a linear portion, where the linear portion is not forced into defining a plateau. It will be referred to as the Quadratic and Linear 2-slope broken line (Q&L 2-S BL) model. The Q&L 2-S BL model can mathematically be written as : Y = b0 + b1(X-Reqr) + b2(Reqr-X)2, where Y = Static : Production response (bodyweight gain, feed conversion, carcass weight, etc.), Reqr = dLYS requirement, (X-Reqr) = 0 if X < Reqr and (Regr-X) = 0 if X>Reqr. This model is somewhat similar to the QBL except that the linear portion can have either a positive or a negative slope, rather tan being a plateau with a slope of zero. The above four mentioned models can statistically provide an indication or measurement of fit through their respective R2 and sum square error (SSE) terms. While a larger R2 is desirable, a smaller SSE is even more desirable, so using an assessment that encompasses both of these terms can provide an indication as to which model best describes the dataset. As shown in Table 1, the models of the three performance variables and the two processing variables, which gave the best R2 and a SSE was the Q&L 2-S BL model (shown in italics), being just slightly better than the QBL.
As such, the Q&L 2-S BL model will be used in the Dynamic : Market analysis for determining the dLYS level, which maximized profitability.
Table 1. Static : Production model responses of Cobb 700 males from 28-42 days.
Another assessment of the requirement invokes evaluating a single point of overlap (i.e., an intercept) between different models. One approach outlined by Sakomura and Rostagno (2007) used the common models, which typically provide the lowest and highest estimates, namely the LBL and the QPmax. As the LBL model doesn’t represent a true biological response, we have instead proposed and have also included the intercept point of the QBL and the QPmax in this paper, as another point of consideration. The results from these two intercept model analyses are included in Figures 1-5 and were in every case lower than either the QBL or the Q&L 2-S BL model estimates.
Static : Production (Performance) Measurements
The value of 0.97% dLYS calculated for QPmax90 was basically the same as that observed from the model intercept models. The combination of body weight gain curves and feed per gain curves were used to predict feed intake at any given dLYS level. For example, at a dLYS of 0.90%, the feed conversion ratio is projected at 1.82 whereas at a dLYS of 1.00% the feed conversion ratio would be 1.79, for an improvement of 3 points. This improvement in feed utilization drops feed intake by 17 grams per bird while increasing body weight gain by 14 grams per bird. These positive changes from feeding the higher dLYS level have the potential to increase profitability and so merit being examined further.
Static : Production (Processing) Measurements.
The above requirement estimates shows the difficulty in settling upon one level of dLYS to use as a formulation constraint. However, using the four models from this analysis, which converge close to each other and have a narrow range in their requirement estimates, might be a starting point as an approach for consideration. In general, the intercept model approach and QPmax90 gave lower dLYS estimates than either the QBL or the Q&L 2-S BL models. Still though there is a slight range of values, so how does one choose a particular level to base a formulation constraint upon? Oftentimes this is done via an estimated guess based upon prior ‘knowledge’, ‘belief’, ‘feeling’ or perhaps even ‘faith’. It further raises the question as to what is the ultimate targeted goal : lowest cost per pound of meat?, lowest cost per calorie (i.e., calorie conversion)?, or should it be maximum profitability? Formulating a diet to the perceived lowest cost per pound of meat tends to drive nutrient density downwards and is not the same as formulating to maximize profitability. Clearly, the goal should be to maximize profitability and the only way to correctly set the optimal nutrient level to meet this target is through appropriate analysis. The resulting targeted dLYS level will change to some degree depending upon market conditions of feed cost and meat prices and should therefore not be a static value.
Dynamic : Market Analysis
Several papers have discussed the concept of choosing nutrient levels that will maximize profitability (DeBeer, 2009, 2010; Eits et al., 2005a,b; Lemme, 2005; Pack et al., 2003; Pesti et al., 2009a, b, c and Ziggers, 2011). In this analysis, using the Q&L 2-S BL model for body weight gain, feed conversion, carcass weight and breast meat weight, along with feed costs and market meat prices, the dLYS level to maximize profitability was determined. Extremes in feed ingredient prices from 2000 to 2011 were used to determine low and high values for corn, soybean meal, animal-vegetable fat blend, corn distillers dried grains with solubles (DDGS) and meat & bone meal to use in formulation. Corn DDGS, allowed up to 7.5% of the feed, was priced at 80% of corn and meat and bone meal, allowed up to 3.5% of the feed, was pried at 110% of soybean meal. The low and high ingredient prices were used to generate low and high extremes in overall formulated feed costs. As outlined by Dozier et al. (2010), a low 0.64% dLYS diet and a high 1.20% dLYS diet was formulated. At the low ingredient prices, feed costs had a spread of $35.80, being $90.48 and $126.28 per ton, respectively; whereas at the high ingredient prices, feed costs were $304.76 and $365.73 per ton, with a spread of $60.97. Ingredient costs, formulated feed costs and market prices are shown in Table 2 for the low and high price scenarios.
Table 2. Ingredient Input Costs and Output Prices used in Dynamic : Market Analysis.
Two separate regression equations, once each for low and high priced feed, were generated to predict feed cost at any given dLYS level within the formulated range. As previously noted, feed intake was predicted using bodyweight gain and feed conversion equations and feed costs per bird were calculated from feed intake and the respective cost of the dLYS formula as determined via the appropriate regression equation. Total costs were comprised of feed costs and other costs (chick costs, grower costs, live haul costs, processing costs, etc).
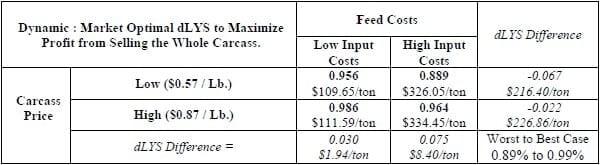
Low and high market prices for carcass and breast meat were used from 2000 to 2011 to evaluate extremes in commodity market prices across this time. Carcass price scenarios were evaluated at $0.57 and $0.87 per pound and the optimal dLYS level, which maximized profitability, from the Dynamic : Market analyses are shown in Table 3. The predicted weight of the whole bird carcass coupled with carcass market price was used to determine the total revenue or value generated from selling the whole carcass. Profit was calculated as the difference between total revenue and total costs and was maximized via multiple software iterations across the range of dLYS levels offered.
Over the time period and pricing extremes evaluated, the best-case scenario (low feed costs and high carcass price) gave the highest dLYS level, for maximizing carcass profit, of 0.986%. Conversely, the lowest dLYS estimates (0.889%) from the Dynamic : Market analysis occurred at the worst-case scenario of high feed cost and low carcass price. These requirement estimates provide a dLYS spread of ~ 0.10% points (0.89% to 0.99%), across the wide feed cost and carcass price range. As expected, when carcass price increased or as feed costs decreased, the model maximized profit at a higher dLYS level. At the low carcass price of $0.57 per pound, a significant increase in feed cost, lowered the optimal dLYS level by 0.067% points (0.956% to 0.889%), as the higher feed cost an extra $216.40 per ton. Similarly, at the higher carcass price ($0.87 per pound), a decline of 0.022% points in the optimal dLYS level occurred, since the higher feed cost an additional $226.86 per ton. For the main effect of carcass price, at low feed costs, an increase of $0.30 per pound raised the dLYS recommendation by 0.030% points and at high feed costs, the dLYS estimate increased by 0.075% points. While it is of interest to note the relationships between these four scenarios in terms of optimal dLYS recommendations and changes in feed costs, what is ultimately and vastly more important are changes in carcass or whole bird profitability.
It is estimated the US broiler industry feeds a dLYS of ~ 0.90% during the phase from 28 to 42 days of age and that diet would cost $327.26 per ton using the prices in Table 2. Based upon high feed costs and carcass prices of $0.87 per pound, similar to situation in the 3rd quarter of 2011, the optimal dLYS level for maximizing profit was 0.964%, 0.064% points higher than industry practice. By feeding dLYS, which maximizes profitability, it is projected from this analysis that carcass weight would be increased by 17 grams, feed conversion improved by 2.5 points, feed intake decreased by 11 grams per bird, revenue increased by 2.5 cents per bird and profitability increased by 0.6 cents per bird ($6,000 per million birds). The overall implication from this analysis is that increasing the industry dLYS level by ~ 0.06% points during this phase and at high input costs, while increasing feed cost by $7.19 per ton or 1.7 cents per bird, profitability is nonetheless increased due to improved overall performance and efficiencies. This also occurs even though the feed cost per kg of carcass produced increases by 0.4 cents per bird. This sheds doubt on the concept of formulating feeds to a minimum cost per pound of meat produced, which is reality just drives the dLYS and overall nutrient density downwards, while simultaneously reducing performance and decreasing profitability.
Table 3. Dynamic : Market Analysis of Digestible Lysine that maximizes Carcass Profit.
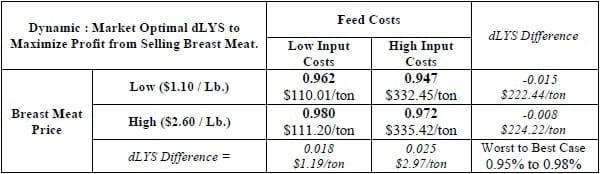
Breast meat prices were evaluated at $1.10 and $2.60 per pound and the optimal dLYS level, which maximized profitability, from the Dynamic : Market analyses are shown in Table 4. The predicted weight of breast meat coupled with the breast meat market price was used to determine the total revenue from breast meat. As other cut-up parts from the carcass also impact revenue, fixed prices for wings and leg quarters were also used in the analysis and estimated weights of those parts were based upon a fixed percentage of the predicted breast weight for each part. As noted above, profit was calculated as the difference between total revenue minus total costs and was done via multiple software iterations across the range of dLYS levels offered.
As with carcass profit optimization, the lowest determined dLYS recommendation (0.947%) from the Dynamic : Market analysis for maximizing breast meat profit occurred at the worst-case scenario of high feed cost and low breast meat price. The inverse best-case scenario of low feed cost and high breast meat price optimized breast meat profit at 0.98% dLYS, which was the highest estimate. These recommendations provide a rather narrow dLYS spread of ~ 0.03% points (0.95% to 0.98%), across a wide feed cost and carcass pricing range. As expected, when breast meat price increased or as feed costs decreased, the prediction model maximized profit at a higher dLYS level. At the low breast meat price of $1.10 per pound, and with a significant change in feed costs, the optimal dLYS level only fell by 0.015% points (0.962% to 0.947%), even though the higher feed cost an extra $222.40 per ton. Similarly, at the high breast meat price ($2.60 per pound), only a 0.008% point change in the optimal dLYS level (0.980% to 0.972%) was noted, even though the higher priced feed cost an additional $224.22 per ton. For the main effect of breast meat price, at low feed costs, increasing breast meat price to $2.60 increased the dLYS recommendation by 0.018% points and at high feed costs, the dLYS optimum increased by 0.025% points with feed costing an addition $1.19 and $2.97 per ton, respectively. While it is of interest to note the relationships between these four scenarios in terms of optimal dLYS recommendations and changes in feed costs, what is ultimately and vastly more important are changes in breast meat profitability.
Based on the analysis conducted here under high feed costs and low breast meat prices of $1.10 per pound, which is somewhat similar to situation in the 3rd quarter of 2011, the optimal dLYS level for maximizing profit was determined to be 0.047% points higher at 0.947% than the 0.90% dLYS the industry uses. By feeding dLYS at the level, which maximizes profitability, it is projected from this analysis that breast meat weight would be increased by 7 grams, feed conversion improved by 2.1 points, feed intake decreased by 7 grams per bird, revenue increased by 2.1 cents per bird and profitability increased by 0.6 cents per bird (an additional $6,000 in profit per million birds). The overall implication from this analysis is that increasing the industry dLYS level by ~ 0.05% points during this phase, at the high input or feed costs, while increasing feed cost by $5.19 per ton or 1.2 cents per bird, profitability is nonetheless increased. This also occurs even though the feed cost per kg of breast meat produced increases by 0.5 cents per bird at the higher dLYS. This again sheds doubt on the concept of formulating feeds to a minimum cost per pound of breast meat produced, which is reality just drives the dLYS and overall nutrient density downwards, while simultaneously reducing performance and decreasing profitability.
In late August of 2011, breast meat price was actually around $1.50 per pound. Under this commodity price scenario, the Market : Dynamic model optimized at a dLYS level of 0.956%, or 0.056% points higher than the current industry practice. By feeding dLYS at the level which maximizes profitability, it is projected from this analysis that breast meat weight would be increased by 8 grams, feed conversion improved by 2.4 points, feed intake decreased by 9 grams per bird, revenue increased by 3.0 cents per bird and profitability increased by 1.3 cents per bird (an additional $13,000 in profit per million birds). The overall implication from this analysis is that increasing the industry dLYS level by ~ 0.06% points during this phase, at the high input and feed costs experienced during this time, while increasing feed cost by $6.36 per ton or 1.5 cents per bird, profitability is significantly increased. This also occurs even though the feed cost per kg of breast meat produced increases by 0.6 cents per bird. This further sheds doubt on the concept of formulating feeds to a minimum cost per pound of breast meat produced, which drives the dLYS and overall nutrient density downwards, while simultaneously reducing performance and decreasing profitability.
Table 4. Dynamic : Market Analysis of Digestible Lysine that maximizes Breast Meat Profit.
Conclusion
From this analysis, it is noted that several models and approaches can provide similar estimates of the dLYS requirement of Cobb 700 male broilers from 28 to 42 days of age as there is some convergence across their respective estimates. These dLYS values are between 0.94% and 1.03% for optimizing Static : Production variables such as bodyweight, bodyweight gain, feed conversion, carcass weight and breast meat weight, based on the four central models. Even though this range is narrowed with the exclusion of the LBL and QPmax models, it still leaves a great deal of interpretation as to the optimal level to set as a constraint within feed formulation. The averages from the 4-model approach for carcass and breast weight however are 1.00% and 0.97% dLYS, respectively and do a respectable job of approximating the dLYS optimum, under the best-case scenarios of 0.99% and 0.98% for optimizing carcass and breast meat profit. This leaves in question though the level of dLYS to use during times when conditions are not near the best-case scenario. A more accurate approach of evaluating the optimal dLYS that will maximize profitability is through Dynamic : Market analysis, which uses Static : Production data to predict the response from various dLYS levels, but couples that predicted response to current commodity market prices. In this case, the key market prices of interest are feed ingredient prices, which ultimately drive feed formulation costs, making up 70% of the cost of production, and the selling or market price for broiler meat on ether a carcass or a parts (breast meat) basis. Using the results from Dynamic : Market analysis, the range of dLYS levels to maximize profitability, across a wide range of feed costs and market prices, for carcass weight ranged from 0.89% to 0.99%; whereas those for maximizing breast meat profitability ranged from only 0.95 to 0.98% dLYS. Using this iterative computer model generated approach along with a specific carcass or breast meat selling price, a single quantitative dLYS level can be provided, which will optimize profitability. Of course, the Dynamic : Market approach to evaluating the level of a nutrient to feed, to optimize profitability, can also be applied to any nutrient in which a dose titration response can be predicted. It has often been stated that poultry industry profitability increases when feed costs are high – namely because production cut backs ultimately raise the meat selling price, which is the real driver in revenue generation. Attempting to increase profitability through reducing nutrient density just leads to decreased performance and increased inefficiencies of production. As such, during tough times when feed costs are very high, reducing nutrient density will inevitably lead to a reduction in overall broiler profitability.
References
1.De Beer, M. 2009. Adjusting nutrient density when faced with volatile markets. Arkansas Nutrition Conference. September. Rogers, Arkansas.
2. De Beer, M. 2010. Nutrition for maximum profit – Do the math. Aviagen Brief. October. 5 pages.
3. Dozier III, W.A., A. Corzo, M.T. Kidd, P.B. Tillman and S.L. Branton. 2009a. Digestible lysine requirements of male and female broilers from fourteen to twenty-eight days of age. Poultry Science 88:1676-1682.
4. Dozier III, W.A., A. Corzo, M.T. Kidd, P.B. Tillman, J.L. Purswell and B.J. Kerr. 2009b. Dietary lysine requirement of male broilers from 14 to 28 days of age subjected to different environmental conditions. Journal of Applied Poultry Research 18:690-698.
5. Dozier III, W.A., A. Corzo, M.T. Kidd, P.B. Tillman, J.P. McMurtry and S.L. Branton, 2010. Digestible lysine requirements of male broilers from twenty-eight to forty-two days of age. Poultry Science 89:2173-2182.
6. Eits, R.M., R.P. Kwakkel, M.W.A. Verstegen, and L.A. Den Hartog. 2005a. Dietary balanced protein in broiler chickens. 1. A flexible and practical tool to predict dose-response curves. British Poultry Science. 46, 3. 300-309.
7. Eits, R.M., G.W.G. Giesen, R.P. Kwakkel, M.W.A. Verstegen, and L.A. Den Hartog. 2005b. Dietary balanced protein in broiler chickens. 1. An Economic Analysis. British Poultry Science. 46, 3. 310- 317.
8. Everett, D.L., A. Corzo, W.A. Dozier III, P.B. Tillman and M.T. Kidd. 2010. Lysine and threonine responses in Ross TP16 male broilers. Journal of Applied Poultry Research 19:321-326.
9. Lemme, Andreas. 2005. Optimum dietary amino acid levels for broiler chicken from proceedings of the II International Symposium on Nutritional Requirements of Poultry and Swine. Editors: Horacio Santiago Rostagno and Luiz Fernando Teixeira Albino, held in Vicosa, MG, Brazil. March 29-31. Pages 117-143.
10. Pack, M., D. Hoehler and A, Lemme. 2003. Economic assessment of amino acid responses in growing poultry, in Amino Acids in Animal Nutrition. 2nd edition. J.P.F. D’Mello Editor. CABI Publishing, Wallingford, UK. Pages 459-483.
11. Pesti, G., N. Sriperm and M. Wetzstein. 2009a. Optimizing profitability in difficult times. Part 1. Feedstuffs. February 23rd. 16-17.
12. Pesti, G., N. Sriperm and M. Wetzstein. 2009b. Optimize profitability in hard times. Part 2. Feedstuffs. May 25th. 22-25.
13. Pesti, G.M., D. Vedenov, J.A. Cason and L. Billard. 2009c. A comparison of methods to estimate nutritional requirements from experimental data. British Poultry Science 50,1. 16-32.
14. Rostagno, H.S. 2011. Brazilian Tables for Poultry and Swine. Composition of Feedstuffs and Nutritional Requirements. 3rd Edition. Editor. Presented at the III International Symposium on Nutritional Requirements of Poultry and Swine.. Vicosa – Minas Gerais – Brazil. March 31, 2011. 251 pages.
15. Sakomura, N.K. and H.S. Rostagno. 2007. Metodos de pesquisa em nutricao de monogastricos. Chapter 5. Metodo dose-resposta para determiner exigencies nutricionais. ISBN:978-85-87632-97-5. 283 pages.
16. Tillman, P.B. 2007. Practical application of L-Threonine in broiler nutrition Arkansas Nutrition Conference. September 12th Rogers, Arkansas.
17. Tillman, P.B. 2008. Amino acid nutrition and incorporating L-Threonine in broiler formulas. Mid-Atlantic Nutrition Conference (3/27). MD.
18. Tillman, P.B. 2010. An update on amino acid requirements for broilers and layers. (Actualización de la nutrición con aminoacididos para pollos y gallina de postura). XXI Congreso Centroamericano y del Caribe de Avicultura. San Jose, Costa Rica. June 16-18.
19. Tillman, P.B. 2011. Special considerations for amino Acids in broiler nutrition. III International Symposium on Nutritional Requirements of Poultry and Swine. March 29-31. Vicosa, Brazil.
20. Ziggers, D. 2011. Optimising nutrient density in a volatile market. All About Feed. Vol. 2., No. 3. 18- 20.
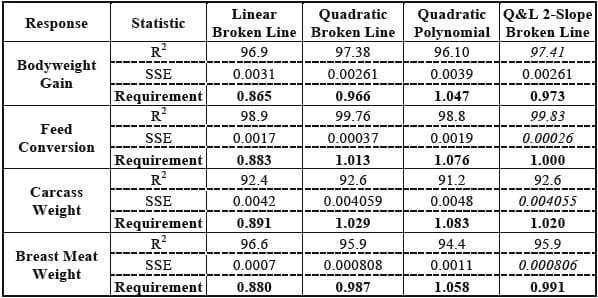
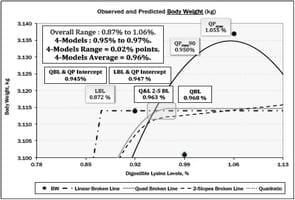 Figure 1. Static : Production Models to predict Body Weight.
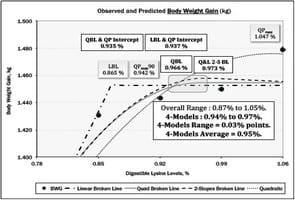
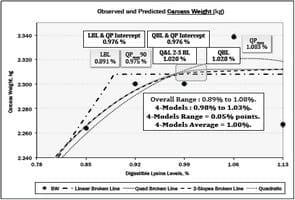
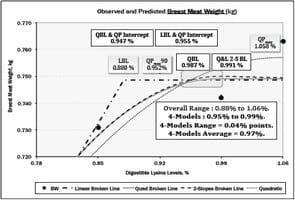 Figure 5. Static : Production Models to predict Breast Meat Weight.
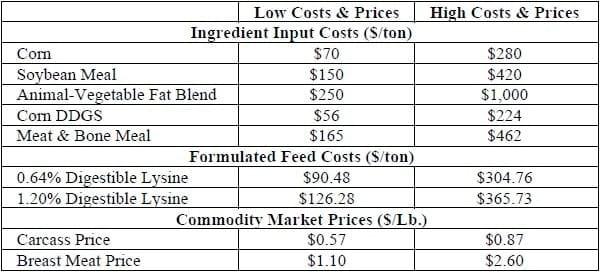


.jpg&w=3840&q=75)