1. Introduction
Commercial poultry farming is one of the fastest growing and most promising industries in Bangladesh. Intensive production system, however, depends solely on compound feeds and ingredients cost of which represents 65–70% of total production cost of the poultry farming. Animal originated feed protein materials such as fish meal and meat & bone meal are usually added to poultry feed as high protein sources. Driven by a booming need for livestock production in Bangladesh, the consumption of animal originated feed protein materials in 2018 has amounted to about 300,000 metric tons in manufacturing 4 million metric tons of commercial feeds. The inclusion of these feed ingredients in poultry diets has been dependent upon its nutrient contents particularly in protein content. Therefore, the evaluation of nutritional quality of these feed ingredients is essential in order to supply adequate amount of nutrients to maximize the production, cost effectively (Khaleduzzaman et al. 2017).
Due to the strong link between feed and food, the quality and safety of animal-derived feed protein materials are of public concern, especially since the emergence of bovine spongiform encephalopathy (Thiry et al. 2004). The Fish Feed and Animal Feed Act 2010 has gazette by the government of Bangladesh to ensure the safe use of feed protein materials. The effective enforcement of these regulations requires efficient and accurate analytical tools. Currently, traditional wet chemistry analyses are commonly employed and mainly focus on targeted parameters or properties of fish meal and meal & bone meal. Although traditional analyses in the laboratory provide valuable information but most of them involve time-consuming, laborious and expensive. Near-infrared reflectance spectroscopy (NIRS), based on light absorption at near-infrared wavelengths by the molecules constituting the sample, is a nondestructive, rapid and predictive technique. Furthermore, NIRS technique is often presented as one of the most suitable approaches for online quality control of agricultural products (Kawasaki et al. 2008). The technique has extensive application for the analysis of constituents of agricultural crops, feeds and foods (Osborne et al. 1993; Williams 2001; Roberts et al. 2004). NIR spectroscopy, while much simpler and more rapid than traditional analytical methods typically requires grinding a sample to a fine particle size to give a smooth and homogeneous surface for reflection and increased precession. This analytical tool requires no chemical reagents, therefore, avoids the problems of organic and other chemical waste disposal. Once calibrations are in place, it takes just a minute to have the result of one or more constituents where by conventional chemistry may take hours or days for this analysis. Currently, NIRS of whole grains at the grain elevator is used widely in the USA, Canada, Australia and Europe for the evaluation of protein and moisture content of grains (Sandra et al. 2005). However, little is known about the potential of NIR spectroscopy for the nutritional evaluation of locally available ingredients in Bangladesh as well as other parts of Southeast Asia. In addition, quick prediction of nutritional quality of feed ingredients in the feeds is necessary for achieving sustainable poultry production. Therefore, the aim of this study was: (a) to develop local calibration procedures using NIRS and validation of calibrations for the evaluation of locally available fish meal and meat & bone meal from avian sources and (b) to determine the nutritive value of large number of fish meal and meat & bone meal within the shortest possible time.
2. Materials and methods
2.1. Sample collection and preparation
A total of 944 Fish meal samples and 675 meat & bone meal samples were collected from the different commercial feed mills and local feed markets available in Bangladesh from 2015 to 2018. Samples were ground through 2.0 mm screen for the homogeneous particle size using Cemotec Grinding Mill (Foss Tecator, Sweden) before reflectance measurements and dried at 60°C for wet chemistry analysis.
2.2. Spectroscopic and laboratory analysis of the sample
The identification of appropriate samples was the first step in utilizing a combination of NIRS and laboratory analysis. Ground fish meal and meat & bone meal samples were scanned in duplicate (scanning number 32, resolution 8) with an FT-NIRS (Bruker, MPA, Germany) systems monochromator (700–2400 nm). Samples were packed into a Qurtz cup sample holder which holds the sample into a clear glass window and to maintain good contact between the granular sample and window. Monochromatic light was focused on to a concave mirror which separated the light into its composing wavelengths. Required wavelength was selected by which the near-infrared light was fallen on to the feed samples. The amount of this light reflected by the fish meal and meat & bone meal was measured to obtain the absorption corresponding to selected wavelength. The graph depicting the wavelength tested versus the absorption is called the spectrum, and an example spectrum is presented in the top right corner. Spectral reference curves were measured each of the fish meal and meat & bone meal sample and the data were stored in selected folder. Sample moisture, crude protein (CP), crude fat (EE), total ash, calcium (Ca) and phosphorus (P) were determined according to the procedure of AOAC (2000).
2.3. Development of calibration model
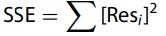
For the development of calibration model in the present experiment, multivariate analysis was performed by a commercial analysis program Optical User Software (OPUS) and Opus Lab provided by Bruker, MPA, Germany, to relate the spectral data and corresponding concentration values for each nutrient component (Moisture, CP, EE, total ash, Ca and P) of broiler and layer feed samples. The model was developed using Partial Least Squares (PLS) algorithm and the spectral data were processed by a suitable mathematical method e.g. first derivative, second derivative, vector normalization, subtraction of straight line, etc. PLS uses eigenvectors and eigen values to perform a decomposition of the spectral and constituent concentration data simultaneously. The decomposition process is a systematic means to determine the most important variations in the data. PLS uses constituent concentration information during spectral decomposition, which weights spectra containing higher constituent concentrations more heavily. The term ‘factor’ or ‘rank’ is used to describe a linear combination of spectral data. PLS reconstructs a spectrum that represents the predicted constituent values. This predicted spectrum is subtracted from the actual spectrum to determine residuals. Therefore, the residual (Res) is the difference between the true and fitted value. Thus the sum of squared errors (SSE) is the quadratic summation of these values:
The standard error of calibration or root mean square error of estimation (RMSEE) is calculated from this sum, with M being the number of standards and R the PLS factors or rank:
Appropriate frequency range of the spectrum was selected to get good correlation between the changes in spectral and the concentration data.
2.4. Validation of the calibration model
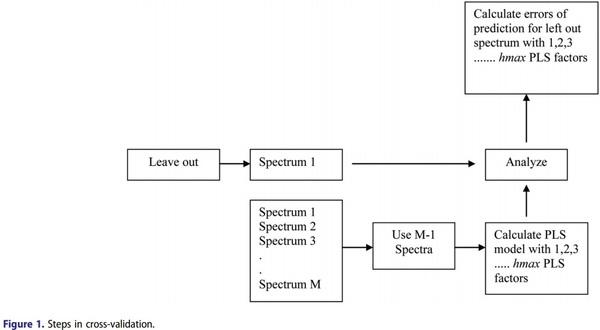
The suitability of the chosen data processing method and the frequency range for method development was evaluated during validation. In the case of cross-validation, individual samples were taken from the calibration set. Using the remaining samples, a calibration model was established and used to analyse the previously extracted samples. This procedure of removing samples, analysing them, and returning them to the calibration data set was continued successively until all the samples had been analysed once (Figure 1).
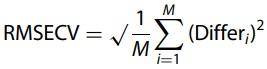
A comparison of the resulting analysis values with the original raw data allowed the calculation of the predictive error of the complete data system, the root mean square error crossvalidation (RMSECV):
Besides, coefficient of determination (R2) from the linear regression of measured values of nutrient component
determined by analytical laboratory versus predicted values by the NIR calibration was calculated to give the accuracy of the model. During the validation, potential outliers could be detected easily and only after all outliers had been removed from the calibration data set, and finally after the optimum parameters had been found, the calibration model was established.
3. Results
3.1. Calibrations for nutrients evaluation in fish meal and meat & bone meal
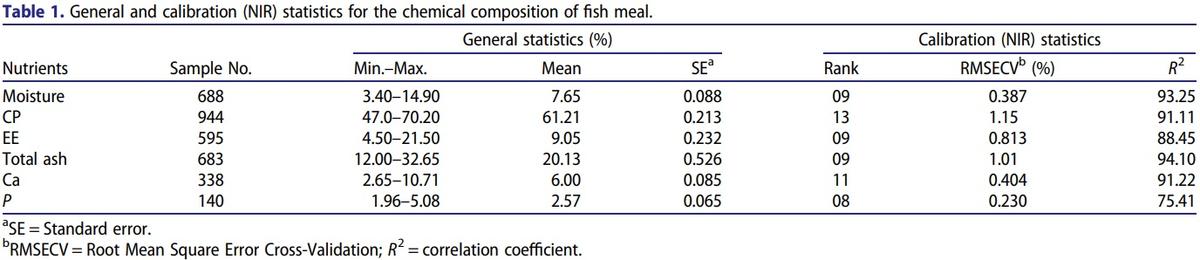
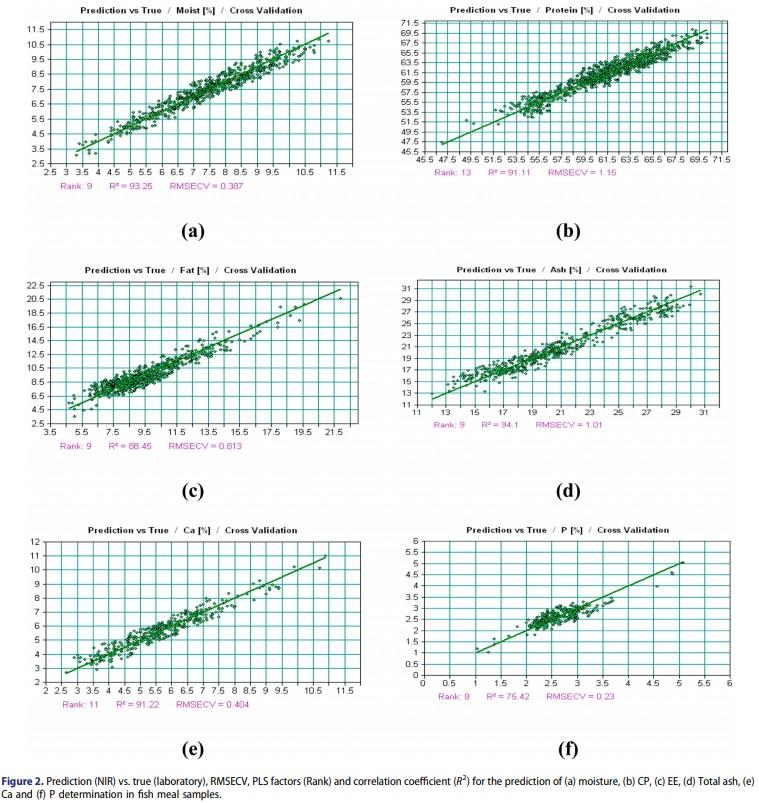
The range of moisture, CP, EE, total ash, Ca and P contents in fish meal were 3.40–14.90%, 47.0–70.20%, 4.50–21.50%, 12.00– 32.65%, 2.65–10.71% and 1.96–5.08% with SE values were 0.088%, 0.213%, 0.232%, 0.526%, 0.085% and 0.065%, respectively (Table 1). The RMSECV for the prediction of moisture, CP, EE, total ash, Ca and P contents in fish meal by NIRS were 0.387%, 1.15%, 0.813%, 1.01%, 0.404% and 0.230% having correlation coefficient (R2) between laboratory values and NIRS predicted values were 93.25, 91.11, 88.45, 94.10, 91.22 and 75.41, respectively (Figure 2). The number of samples in developing local calibration equations for the prediction of moisture, CP, EE, total ash, Ca and P contents in fish meal were 688, 944, 595, 683, 338 and 140, respectively.
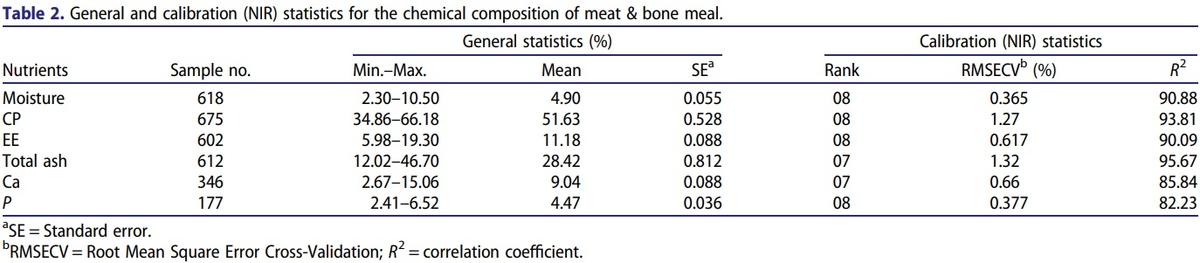
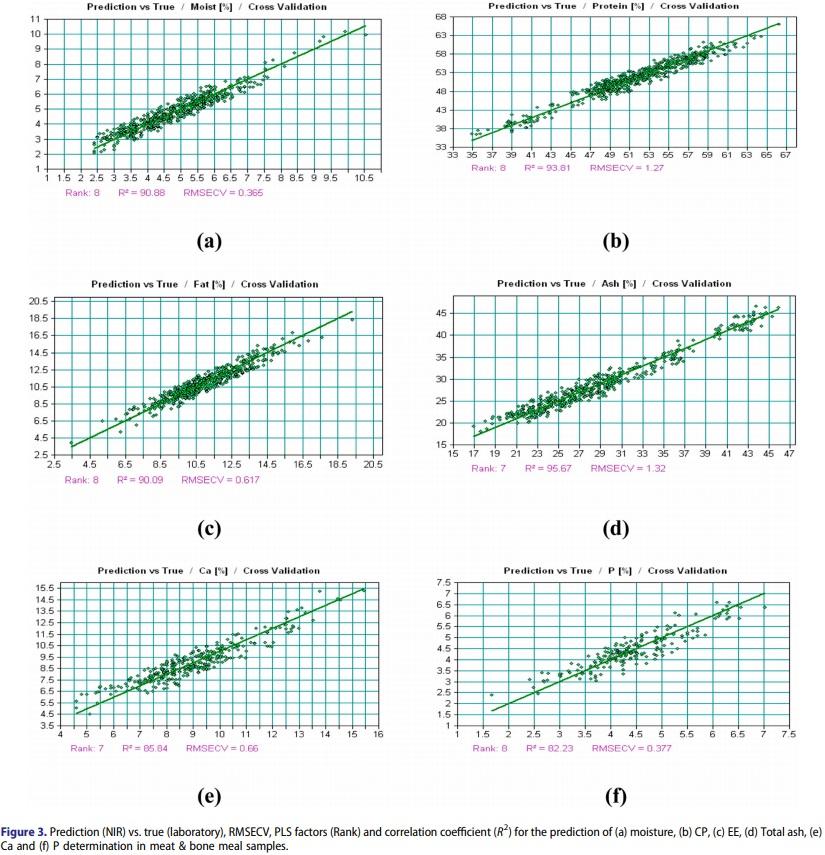
In the present experiment, the range of moisture, CP, EE, total ash, Ca and P in meat and bone meal samples were 2.30–10.50%, 34.86–66.18%, 5.98–19.30%, 12.02–46.70%, 2.67– 15.06% and 2.41–6.52% with SE of 0.055%, 0.528%, 0.088%, 0.812%, 0.088% and 0.036%, respectively (Table 2). The RMSECV for the prediction of moisture, CP, EE, total ash, Ca and P contents in meat & bone meal by NIRS were 0.365, 1.27, 0.617, 1.32, 0.66 and 0.377, respectively with R2 were 90.88, 93.81, 90.09, 95.67, 85.84 and 82.23, respectively (Figure 3). The number of samples in developing local calibration equations for the prediction of moisture, CP, EE, total ash, Ca and P contents in meat & bone meal were 618, 675, 602, 612, 346 and 177, respectively.
4. Discussion
Reliable information on the chemical contents of feed protein materials can help manufacturers to efficiently arrange their formulations and to ensure that their products meet legitimate expectations with minimal costs. The chemical contents of feed protein materials are affected by many factors such as species, particle sizes and processing technique and thus, price can vary substantially. The NIR calibration and cross-validation statistics for the prediction of nutrients in fish meal and meat & bone meal samples from avian sources are shown in Table 1. According to the procedure of Conzen (2003), multivariate calibration was developed and the commercial software analysis program OPUS had the opportunity to use all possible mathematical models to develop calibrations with least errors. In the present experiment, the correlation (R2 = 93.25) between actual (wet chemistry) and predicted value of moisture content in fish meal indicated that moisture could be accurately predicted by NIRS. The measurement of moisture by NIRS might be uncomplicated due to the high absorptivity of the moisture O–H bands (Chen et al. 2013).
The standard error (SE) after cross-validation of local calibration equations (RMSECV) for the prediction of moisture, EE, Ca and P contents in fish meal samples were 0.387, 0.813, 0.404 and 0.230, respectively which are in close to the SE of cross-validation observed by Cozzolino et al. (2002) in fish meal for the prediction of moisture, CP and total ash. Meanwhile, the SE for the determination of CP and total ash of fishmeal in the present experiment by NIR were relatively high that might be due to large variations of the CP and total ash contents in the calibration samples. Cozzolino et al.(2002) investigated the spectral characterization of fish meal and found that the bands at 1490 nm (N–H stretch first overtone), 2060 nm (carbonyl stretch of the primary amide) and 2168– 2180 nm (N–H bend second overtone, C–H stretch/C=O stretch combination, C=O stretch/N–H in-plane bend/C–N stretch combination) derived from the peptide absorption of the amide group and had high correlations with fish meal
crude protein and total volatile nitrogen. However, Fontaine et al. (2001) found SE of 1.99 for the prediction of CP in fish meal by NIRS. In the present experiment, the samples were collected from different locations of Bangladesh and variety of the samples might be the possible reasons for higher variations of nutrients. In developing local calibrations for the prediction of CP contents in fish meal, the number of factors were 13 (Rank). Sometimes, if too many factors (rank) have chosen, the model tries to account even the smaller changes in data set which creates spectral noise (‘overfitting’). In this case, spectral information, unspecific for the sample is included in the model and the deterioration of the analysis results is also to be expected from the model (Conzen 2003). However, the R2 between the laboratory analysis and NIR analysis of CP contents of fish meal was 91.11 having SECV 1.15 indicates the close relation of laboratory and NIRS analysis and the accuracy of the calibration model. The strong correlation between actual value and the predicted value of CP contents of fish meal was observed by Fontaine et al. (2001) where R2 and SECV were 93.0 and 1.99, respectively. Niu (2005) found a very good correlation (R2 = 93.0, SECV = 2.56) between actual and predicted value of CP contents in fish meal. The highest correlation could be due to large number of samples included in calibration set for the prediction (Niu 2005).
Fat is the main factor for determining energy level in feed. Compared to moisture and CP, fat content is more difficult to be accurately predicted, especially in plant protein materials. However, in the present experiment, the correlation (R2 = 88.45, SECV = 0.81) between actual and predicted value for determining fat content in fish meal is relatively better than fat content predicted by NIRS in plant protein materials (Chen et al. 2013). Similarly, the fat content in fish meal was accurately predicted by Tan (2008) with high correlation (R2 = 0.91) and low error (MARE = 4.53). Besides, a good similar prediction for the determination of fat content in fish meal (R2 = 0.96) with RMSEP = 0.57 observed by Niu (2005). From the spectral point of view, fat content can be successfully evaluated because some characteristic wavelengths associated with fat exist in the NIR region. In addition, fish meal has relatively higher fat content (about 9%) that can result in good predictability of its fat content (Tan 2008).
Total ash is the inorganic residue remaining after the water and organic matter have been removed by heating in the presence of oxidizing agents. Ash content provides a measure of the total amount of minerals in feed materials. Ash content in most feed protein materials was analysed by NIRS with R2 > 0.65 and RMSEP < 1.5%. From the result of the present local calibration for the prediction of total ash content in fish meal RMSECV (1.01) is relatively higher because the ash residue mainly made up of mineral elements which has no characteristic NIR absorption bands. However, previous studies have proved that NIRS is capable of predicting mineral elements in plant feed materials (Prince et al. 2003; Fernandez-Cabanas et al. 2008). It is proposed that NIRS can be used to evaluate mineral constituents due to the correlation between the minerals and the organic components, either through associations with organic molecules or by forming salts, affecting hydrogen bonds in samples (Fernandez-Cabanas et al. 2008). This indirect correlation may also be responsible for good prediction results for ash content in fish meals in the present experiment. However, the correlation (R2 = 75.41) between actual and predicted value for the determination of P contents in fish meal was not satisfactory which could be due to small number of samples (n-140) in calibration set (Table 1). On the other hand, the prediction of P content in fish meal by using NIRS was unsatisfactory due to lower P contents in fish meal which is challenging for NIRS analysis (Baeten and Dardenne 2002). However, this correlation could be improved by the addition of large number of homogeneous samples in calibration sets.
The standard error (RMSECV) after cross-validation of local calibration equations for the prediction of moisture, EE, Ca and P contents in meat & bone meal samples were 0.365, 0.617, 0.660 and 0.377, respectively those are in almost similar to the SE of cross-validation observed by the Cozzolino et al. (2002) in fish meal for the prediction of moisture, CP and total ash having SE were 0.390, 0.570 and 0.470 respectively. Meanwhile, as in the case of fish meal, the SE for the prediction of CP and total ash of meat and bone meal in the present experiment by NIR were 1.27 and 1.32 respectively that were relatively high could be due to large variations of the CP and total ash contents of meat & bone meal in the calibration samples. However, Fontaine et al. (2001) found SE of 1.99 for the prediction of CP in fish meal and other protein concentrates detected by NIRS. In the present experiment, the samples were collected from different locations of Bangladesh and variety of the samples might be the possible reasons for higher variations of nutrients. Meanwhile, the accuracy of the analysis using NIRS depends on many factors, among which sample preparation plays an important role (Alomar et al. 1999). The highest accuracy of estimation is obtained when dried and ground 0.3– 1.0 mm samples are used, mainly due to the homogeneity of the sample particles (Osborne et al. 1993). However, in the present study the particle sizes of the samples were 2.0 mm which might be led to increase higher variation in calibration
set. In addition, the R2 between the laboratory analysis and NIR analysis of CP and total ash contents in meat and bone meal were 93.85 and 95.67, respectively, indicated the close relation of laboratory and NIRS analysis and the accuracy of the calibration model.
From the result of the present local calibrations, the correlations between laboratory values and NIR values in predicting Ca and P contents in meat & bone meal were 85.84 and 82.23 that were relatively lower because of Ca and P mainly mineral elements, has no characteristic NIR absorption bands. It is proposed that NIRS can be used to evaluate mineral constituents due to the correlation between the minerals and the organic components, either through associations with organic molecules or by forming salts, affecting hydrogen bonds in samples (Fernandez-Cabanas et al. 2008). This indirect correlation may also be responsible for good prediction results for Ca and P contents in meat & bone meal in the present experiment. This correlation could be improved by the addition of large number of homogeneous samples in calibration sets.
5. Conclusion
It is concluded that NIRS is obligatory to predict nutrient contents of fish meal and meat & bone meal in quick feed manufacturing process. The NIRS should be preferred as the most convenient tool due to nondestructive analytical method which does not require any chemical reagents, does not have any organic or chemical waste, and hence environmentally sound technology for rapid feed analysis.
This article was originally published in Journal of Applied Animal Research 2020, VOL. 48, NO. 1, 257–263. https://doi.org/10.1080/09712119.2020.1776715. This is an Open Access article distributed under the terms of the Creative Commons Attribution License (http://creativecommons.org/licenses/by/4.0/). 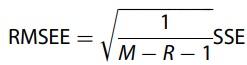


.jpg&w=3840&q=75)