Practical response to Bio-MosTM in nursery pigs: a meta-analysis
Published: November 12, 2007
By: J.C. MIGUEL, S.L. RODRIGUEZ-ZAS and J.E. PETTIGREW (Courtesy of Alltech Inc.)
This paper evaluates the economically important responses to one such product, Bio-Mos, a mannan oligosaccharide product from Alltech, Inc. The focus is on nursery pigs, which are more responsive to antibiotics and other feed ingredients and additives than are older pigs.
The principal approach is a meta-analysis: a systematic analysis of all pertinent data. The assembled data set consists of both published data (including abstracts and other non-refereed publications) and unpublished data. Most of the unpublished data come from the files of Alltech, Inc. Our agreement to conduct this study and prepare this paper was contingent on our receiving all data from Alltech’s files. That is critical because a fundamental assumption of a meta-analysis is that a complete, or at least unbiased, data set is included in the analysis. We await results from one large study, which are not available at the time of this writing.
We attempted a comprehensive analysis of variance of the data, using in the statistical model several independent variables thought likely to alter the response of pigs to Bio-Mos. Unfortunately, the size and structure of the data set did not allow clear separation of the effects of these variables, presumably because of correlations among the independent variables. It is not possible to avoid such correlations in a data set such as this one assembled from many independent studies, as it is in a designed experiment.
We also failed to achieve adequate error control with this approach, meaning the analysis was quite insensitive. Therefore, we reverted to the analysis of the response variable difference between Bio-Mos and control responses expressed as a percentage of the control response. For each variable of interest, we simply subdivided the data set into the classes of interest, and compared the Bio-Mos responses by simple analysis of variance. This approach does not facilitate exploration of interactions among independent variables, and allows confounding between the effect under study and other effects not in these simple models.
The data
There are a total of 49 comparisons of Bio-Mos vs no Bio-Mos in the data set, a big increase from the 17 comparisons available only two years ago (Pettigrew, 2000). These 49 comparisons come from 26 separate experiments and 19 research teams. Most of the increase consists of new trials, but a change in the data treatment accounts for nine of them. Where multiple levels of Bio-Mos were compared in the same experiment, Pettigrew (2000) averaged the data for a single comparison to the control values. In the present analysis, each level is considered a separate comparison.
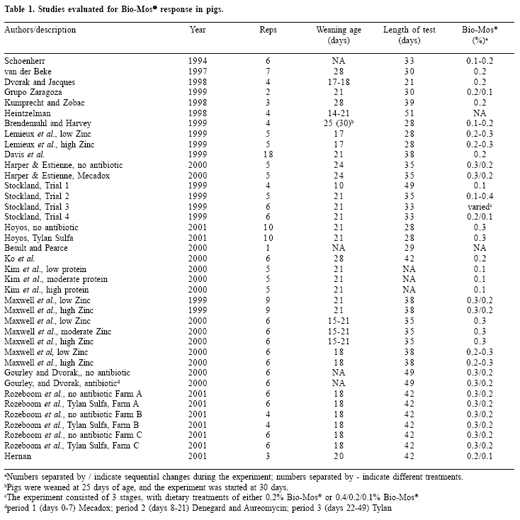
The current size of the data set is much larger and stronger than are the data sets on most competing products, and represents a significant investment by Alltech. Most of the data were generated in conventional research facilities. However, a substantial number of comparisons were made on commercial farms, bringing both advantages and disadvantages. There is often less control of extraneous factors on commercial farms, reducing the power of those experiments. However, the inferences to be drawn from analysis of the data set will be applied to commercial farms. The fact that some of the data come from environments similar to those in which the results will be applied lends substantial confidence in the results. Table 1 identifies the studies included in the data set.
Click here to enlarge the image
Overall response
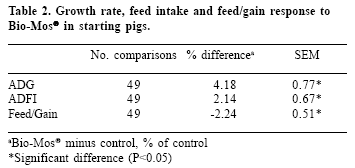
The mean percentage responses in growth rate, feed intake and feed efficiency (Table 2) are significantly (P<0.05) different from zero, showing clearly that Bio-Mos improved growth performance in these studies. The response in growth rate was largest, and can be partitioned roughly into components due to feed intake and to feed efficiency. This pattern is seen also in responses to antibiotics. The response to Bio-Mos is not as large as responses usually reported for antibiotics or for spray-dried plasma. However, it is large enough to be useful.
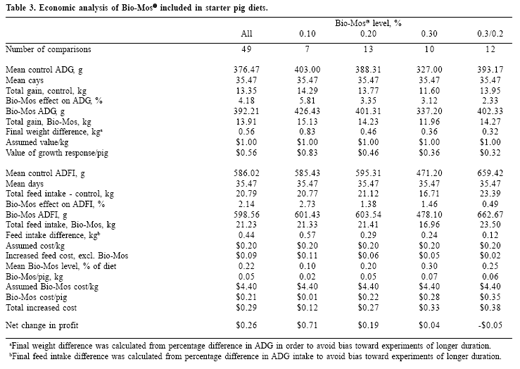
A simple economic analysis (Table 3) suggests a net gain of US$0.26/pig from the use of Bio-Mos. This analysis assumes all pigs would be in the nursery for the same number of days, the mean duration of the comparisons in the database. Pigs fed Bio-Mos consumed more feed than did the controls; and we assume that feed would have been the last one provided in the nursery. We assigned a relatively high cost of US$0.20/kg for that feed. We did not assume that the additional final weight of the pigs fed Bio-Mos would improve their subsequent growth performance, so we valued the additional weight at a conservative US$1.00/kg. Overall, we consider our estimates of economic benefit to be conservative.
Having shown that overall there were beneficial biological and economic responses to Bio-Mos, we now turn to questions of other factors that may influence the size of that response.
Click here to enlarge the image
Bio-Mos use level
In the various experiments, Bio-Mos was utilized at dietary concentrations ranging from 0.1 to 0.4%, and often at concentrations that declined as the pigs grew. There were enough observations in four use rates to support comparisons (Table 4). This summary indicates that as the concentration of Bio- Mos in the diet increased, the response to Bio-Mos declined, as measured in average daily gain (ADG) and average daily feed intake (ADFI).
Pigs fed Bio-Mos at 0.2% had a significantly higher growth rate compared to pigs offered the control diet (P<0.05). The smallest increases were seen in starting pigs offered a diet that included a high dietary concentration (0.3%) of Bio-Mos in the first diet after weaning and then a lower dietary concentration (0.2%) during the second feeding phase of the nursery period. These comparisons are complicated by the fact that the treatment with declining concentrations (0.3/0.2%) was applied disproportionately in trials of long duration.
However, the analysis indicates that the differences between 0.3/0.2% and the control were not significant. There were no significant differences seen in feed intake of pigs fed any level of Bio-Mos compared to the controls. Feed efficiency was significantly improved for the pigs fed the 0.3% (P <0.01) and 0.3/0.2% (P <0.05) Bio-Mos diets in comparison to pigs fed a control diet.
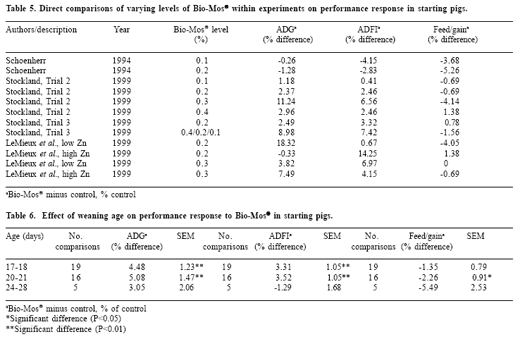
Direct comparisons of dose levels within experiments do not support the pattern of response indicated in Table 4. These data indicate that as the concentration of Bio-Mos in the diet increased, there was either a numerical increase or decrease in performance compared to the control pigs (Table 5).
In three separate comparisons, Stockland (1999) fed diets that included 0.1, 0.2, 0.3 or 0.4% Bio- Mos. As the concentration of Bio-Mos in the diet increased, there was a corresponding increase in growth rate, feed intake and feed efficiency with the exception of the diet that included 0.4% Bio- Mos. In a different experiment, Stockland (1999) fed pigs one of two diets that included Bio-Mos concentrations of 0.2% or 0.4/0.2/0.1% (concentration decreased as the pigs entered different phases of the nursery period). In this experiment, pigs that started out on a high level of Bio-Mos (0.4%) and then were gradually lowered to 0.1%, performed better than control pigs or pigs fed only the 0.2% Bio-Mos diet throughout the experiment. Schoenherr (1994) reported a reduction in growth rate and feed intake in pigs fed diets containing 0.1 or 0.2% Bio-Mos compared to pigs fed a control diet.
However, the pigs fed Bio-Mos were more efficient than control pigs. LeMieux et al. (1999) conducted an experiment in which pigs were fed either 0.2 or 0.3% Bio-Mos in a diet with low or high zinc oxide. Pigs fed the diet that contained 0.2% Bio-Mos and a low level of zinc oxide had a larger improvement in both growth rate and feed efficiency compared to control pigs than pigs fed 0.2% Bio- Mos with a high level of zinc oxide and pigs fed 0.3% Bio-Mos with low or high levels of zinc oxide. The length of the experiment is likely not a confounding factor, as all of these experiments ranged from 28-35 days in length.
Overall, the data are remarkably unhelpful in establishing the optimal Bio-Mos dosing regimen.

Click here to enlarge the image
Click here to enlarge the image
Weaning age
The comparisons were grouped according to weaning age in three definitive categories (Table 6). The results suggest that the effect of Bio-Mos on growth rate and feed intake in pigs weaned at 20-21 days was numerically larger than the response in those weaned at 17-18 and 24-28 days.
Weaning at 17-18 or 20-21 days of age resulted in a significantly higher (P<0.01) growth rate and average daily feed intake (P<0.01) in pigs fed Bio-Mos compared to pigs fed the control diet.
Although pigs weaned at 20-21 days had a slightly larger improvement than seen in pigs weaned at 17-18 days, the difference was not conclusive. Age is only one factor in the performance response of pigs to Bio-Mos. Performance can also be influenced by the concentration of Bio-Mos in the diet, length of the trial, health of the pigs, and the environment in which the study was conducted.
It appears that Bio-Mos fed to pigs weaned at a later age (24-28 days) did not respond to the same extent as those weaned at an earlier age (17-18 and 20-21 days). In fact, Bio-Mos actually reduced ADFI in these pigs. However, the pigs weaned at a later age had a numerically larger (P<0.1) improvement in feed efficiency. The lower growth rate and feed intake response seen in the pigs weaned at 24-28 days is not due to the duration of the trial.
The average length of the trial for the three weaning age groups (17-18 days, 20-21 days, and 24-28 days) was 36.5, 34.3, and 36.2 days. The average levels of Bio-Mos for these three respective age groups were 0.26, 0.20 and 0.22%. With the concentration for the 24-28 day weaning age group being between the other two age groups, it appears that Bio-Mos concentration probably did not affect the performance of these pigs. Although the data indicate that trial length and Bio-Mos concentration were probably not factors in the lowered performance level of pigs weaned at 24- 28 days, a definitive conclusion cannot be reached with only six comparisons available in the data set. Overall, the data are consistent with a larger effect of Bio-Mos in pigs weaned at less than 24 days of age, but the differences are small and inconclusive.
Length of trial
The comparisons were grouped into three different periods that incorporated the majority of the data (Table 7). These periods were selected based on the similar number of experiments within each category. The results indicate that the response to Bio-Mos was statistically significant in the trials that were 28-30 days in length. Growth rate was significantly higher (P<0.05) in pigs fed Bio-Mos compared to control pigs. A higher (P=0.1622) feed intake and improved (P<0.01) feed efficiency ratio was observed in pigs fed Bio-Mos for a period of 28-30 days. This analysis gives a clear indication that Bio-Mos can be utilized to its full potential if included in the pig’s diet for a period of up to four weeks.

Click here to enlarge the image
The data produced significant, but smaller differences in growth rate response in the other two trial length comparisons. As the trial increased in length, the performance response to Bio-Mos declined in comparison to the response seen during the 28-30 day trials. However, pigs fed Bio-Mos during the longest period (42-51 days) had a higher (P<0.05) growth rate than pigs fed Bio-Mos for 33-39 days.
There was also an improvement in feed intake and efficiency seen in the pigs included in the trial of longer duration. This may be due to differences within individual experiments. One would expect a linear change in performance responses, rather than the irregular responses obtained from this data set. This suggests that the results obtained from pigs fed Bio-Mos for 33-39 days may actually be influenced by one or more trials in which the pigs responded at a level that was less than expected, thereby affecting the overall average performance response obtained from these experiments. The improvement in performance may also be attributed to the fact that the pigs included in the trials of longer duration had an average weaning age of 19.3 days compared to 20.6 days of age for those on the trial of moderate length.
Stage of nursery period
Several reports provided growth performance data for not only the entire period but also for a short (7- 15 days) initial period. The response to Bio-Mos during the initial period was markedly larger than the response observed during the remainder of the nursery period (Table 8). There was a higher response during the initial period seen in growth rate (P<0.01) and ADFI (P<0.05) in pigs fed Bio-Mos compared to pigs fed the control diet. There was an average 10.12% increase in growth rate in pigs fed Bio-Mos compared to pigs fed a control diet during this initial nursery period. This gives an indication that Bio-Mos can be utilized with great efficiency during the first two weeks in comparison to the performance obtained when it is offered beyond this initial period.
During this initial period, the pigs fed Bio-Mos show larger responses in growth rate, feed intake and feed efficiency than observed during the remainder of the trial. By separating the data set into two distinct stages, it becomes obvious that Bio-Mos can be an effective agent for improving the performance of nursery pigs during the initial 2 weeks post-weaning. This is consistent with the observation that the Bio-Mos effect is larger in experiments of shorter duration after weaning.

Click here to enlarge the image
Level of performance
The perceived mode of action of Bio-Mos is a combination of protection against enteric pathogens and stimulation of the immune system (Pettigrew, 2000). That concept leads to the inference that Bio- Mos may be more effective in situations where pigs are less healthy. We would like to test that inference by relating the size of the Bio-Mos response to a measure of health; unfortunately, we have no direct measure of health. Perhaps the best index of health status in our data set is the growth rate of the control pigs, so we related the Bio-Mos response to it (Tables 9 and 10). This analysis is complicated by the fact that our measure of health (control ADG) is heavily influenced by other factors, notably weaning age and length of trial.
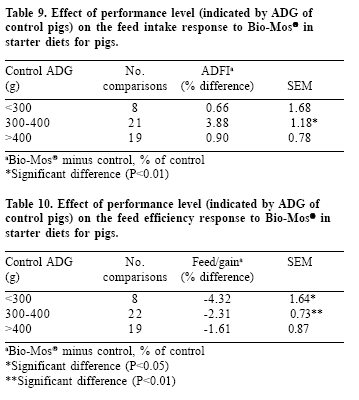
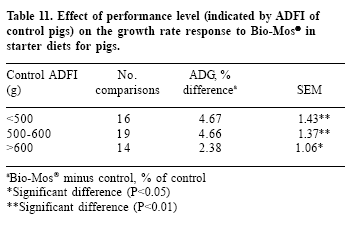
There is a further complication in the analysis of growth rate in that ADG of the control pigs is used in the calculation of the dependent variable, the percent response of ADG to Bio-Mos. Under that circumstance, it is inappropriate to use the same value as an independent variable. Therefore, for analysis of growth rate, we used the ADFI of the control pigs as the index of health (Table 11).
When comparing both ADFI and feed efficiency to the control ADG, the comparisons were conducted within three different levels of growth rate obtained from this data set. Although the majority of the observations were at the 300 g/day or higher, there were still a number of pigs that gained less than 300 g/day that were included in this analysis of performance. For ADFI, pigs fed Bio-Mos consumed more (P<0.01) feed than the control pigs gaining 300-400 g/day. Although these pigs consumed more feed, they were able to convert feed into weight gain more efficiently (P<0.01) than the pigs fed the control diet.
However, Bio-Mos did have an impact on pigs that had a low growth rate. Pigs gaining less than 300 g/day had the best feed efficiency response to Bio-Mos (P<0.05) in comparison to the control group. This indicates that although these pigs were consuming less feed, they were more efficient at converting feed into weight gain. As a measure of health status, pigs gaining weight at less than 400 g/day appear to respond more in feed efficiency to Bio-Mos than pigs with a higher growth rate.
As for the effect of Bio-Mos on ADG, it is apparent that pigs consuming less than 500 g feed/ day or 500-600 g feed/day have a higher (P<0.01) growth rate response, but pigs consuming feed at a rate above 600 g feed/day did not. Apparently, Bio- Mos has its most significant impact on growth rate when nursery pigs consume a low to moderate amount of feed on a daily basis.
Mortality and morbidity
Reports from several of the trials included mortality rates, and in some cases the frequency of medical treatments required. Van der Beke (1996) lost fewer pigs in the Bio-Mos group compared to the control group. The loss was by death, serious scours or from not eating. Stockland (1999) reported the death of two pigs fed 0.2% Bio-Mos during the first trial, and none from the control treatment. Gourley and Dvorak (2000) compared the effect of Bio-Mos inclusion in the diet, with or without antibiotics, on death/cull rate.
The addition of antibiotics to the control diet resulted in fewer deaths compared to the control diet without antibiotics. The combination of antibiotics and Bio-Mos resulted in a higher mortality rate in comparison to the Bio-Mos diet without antibiotics. Rozeboom et al. (2001) found varying results in the mortality of pigs fed a 0.3/ 0.2% Bio-Mos diet. The data of Rozeboom et al. (2001) indicated that the inclusion of antibiotics (Tylan sulfa) in the diet in combination with Bio- Mos resulted in fewer deaths and culls in each of the three experiments.
When treatment was deemed necessary, Rozeboom et al. (2001) utilized either tylosin/excenel or penicillin.
As stated earlier, the occurrence of scours in pigs fed Bio-Mos was absent or kept at a minimum. Harper and Estienne (1999) reported no observed cases of scours or notably loose stools. The data from Hernan (2001) indicate that 33.3% of the control group and 11.7% of the Bio-Mos group had scoured by the end of the trial. Van der Beke (1996) reported 0.25 and 0.23 treatments for scours per started piglet on the control diet and the Bio- Mos diet.
Based on the numbers reported from these studies, it appears that the incidence of mortality and scours is reduced or absent in pigs fed Bio-Mos. However, before making a definitive conclusion, it must be pointed out that the results may vary depending on the environment in which the pigs are raised. The diet is only one factor that affects the overall health of an animal.
The responses to Bio-Mos appear to be maximized by at least a 0.2% use level, at an early weaning age (17-21 days) and during the first two weeks after weaning. Under those conditions, the responses to Bio-Mos are substantial.
With 17-21 days of age being the typical weaning age for the majority of swine operations, Bio-Mos appears to be a promising replacement for antibiotic growth promoters in the starter diet, as was seen in the majority of the experiments. The reduction or absence of the occurrence of scours, as well as low mortality and morbidity rates seen in pigs fed starter diets that included Bio-Mos is another positive aspect of this product. Overall, the results indicate that Bio-Mos can substantially improve the performance of pigs post-weaning, a period that is often characterized by poor growth rates due to the transition to a new diet and environment.
References
Besult, J.B. and G. Pearce. 2000. Efficacy of infeed compounds for the treatment of swine dysentery and enhancement of performance in pigs kept under commercial conditions. Thesis. MSc programme at Abderdeen University.
Brendemuhl, J.H. and M.R. Harvey. 1999. Evaluation of Bio-Mos (mannan oligosaccharide) in diets for pigs. I. Growth performance response during nursery and growing-finishing phases. University of Florida, Gainesville, Florida, USA. Report to Alltech, Inc.
Davis, M.E., C.V. Maxwell, E.B. Kegley, B.Z. de Rodas, K.G. Friesen, D.H. Hellwig and R.A. Dvorak. 1999. Efficacy of mannan oligosaccharide (Bio-Mos) addition at two levels of supplemental copper on performance and immunocompetence of early weaned pigs. J. Anim. Sci. 77(Suppl. 1):63 (Abstr.).
Dvorak, R. and K.A. Jacques. 1998. Mannan oligosaccharide, fructooligosaccharide and Carbadox for pigs days 0-21 post-weaning. J. Anim. Sci. 76(Suppl. 2):12 (Abstr.).
Gourley, G.G. and R.A. Dvorak. 2000. Bio-Mos for nursery pigs: growth performance. Swine Graphics Enterprises, Webster City, Iowa. Report to Alltech, Inc.
Grupo Zaragoza. 1999. Use of Bio-Mos in piglets. Department of Production, Pork Division, Nutricion Animal Biotechnologia.
Harper, A.F. and M.J. Estienne. 2000. Efficacy of carbadox antibiotic and a mannan oligosaccharide source as growth promoters for weanling pigs. J. Anim. Sci. 78(Suppl. 2):64 (Abstr.).
Heintzelman, S. 1998. Summary of field data: response to Bio-Mos in nursery pigs. Report to Alltech, Inc.
Hernan, D.B. 2001. AASA trial with Bio-Mos. Universidad Iberoamericana de Ciencias y Tecnologia, Chile. Report to Alltech, Inc.
Hoyos, G. 2001. Weaned piglets fed with diets including Bio-Mos compared to Tylan-Sulfa diets. International Institute of Animal Investigation, Mexico. Report to Alltech, Inc.
Kim, J.D., Y. Hyun, K.S. Sohn, T.J. Kim, H.J. Woo and I.K. Han. 2000. Effects of mannan oligosaccharide and protein levels on growth performance and immune status in pigs weaned at 21 days of age. J. Anim. Sci. and Tech. 42:489.
Ko, T.G., J.D. Kim, S.H. Bae, Y.K. Han and I.K. Han. 2000. Study for the development of antibiotics-free diet for weanling pigs. Kor. J. Anim. Sci. 42:37.
Kumprecht, I. and P. Zobac. 1998. Study of the effect of a combined preparation containing Enterococcus faecium M-74 and mannan oligosaccharides in diets for weaning piglets. Czech. J. Anim. Sci. 43.
LeMieux, F.M., T.D. Bidner and L.L. Southern. 1999. Effect of 0.2 and 0.3% Bio-Mos with and without 3,000 ppm zinc on growth performance of weanling pigs. Louisiana State University, Baton Rouge, LA. Report to Alltech, Inc.
Maxwell, C., K. Friesen, E.B. Kegley, B. de Rodas, D. Hellwig and E. Davis. 1999. Efficacy of Bio- Mos in improving gain and efficiency in early weaned pigs fed diets with and without growth promoting levels of Zn. University of Arkansas, Fayetteville, Arkansas, USA. Report to Alltech, Inc.
Maxwell, C., K. Friesen, E.B. Kegley and E. Davis. 2000. Effect of Bio-Mos addition with and without zinc oxide supplementation on performance and immunocompetence in weanling pigs. University of Arkansas, Fayetteville, Arkansas, USA. Report to Alltech, Inc.
Pettigrew, J.E. 2000. Bio-Mos effects on pig performance: a review. In: Biotechnology in the Feed Industry: Proceedings of Alltech’s 16th Annual Symposium (T.P. Lyons and K.A. Jacques, eds), Nottingham University Press, Nottingham, UK, pp. 31-44.
Rozeboom, D.W., D.T. Shaw, J.E. Pettigrew and A. Connolly. 2001. Comparative effects of mannan oligosaccharide and an antibiotic in nursery diets on performance of pigs reared on three different farms. J. Anim. Sci. 79(Suppl. 1):211 (Abstr.).
Schoenherr, W.D. 1994. Comparison of MacroGard-S with Bio-Mos and Diamond V “XP” yeast culture in nursery pigs. Premiere Research and Technology Center.
Stockland, W.L. 1999. Practical solutions to maximize production: The commercial application of oligosaccharides in starter pig diets. In: Concepts in Pig Science. The 1st Annual Turtle Lake Pig Science Conference (T.P. Lyons and D.J.A. Cole, eds), Nottingham University Press, Nottingham, UK.
van der Beke, N. 1997. The use of mannan oligosaccharides (Bio-Mos) and lactic acid bacteria (Lacto-Sacc) in piglet feed. Thesis. Department Biotechnological Sciences, Landscape Management and Agriculture, Gent, Belgium
Authors: J.C. MIGUEL, S.L. RODRIGUEZ-ZAS and J.E. PETTIGREW
Department of Animal Sciences, University of Illinois, Urbana, IL, USA
Related topics
Recommend
Comment
Share

Would you like to discuss another topic? Create a new post to engage with experts in the community.





.jpg&w=3840&q=75)