More Accurate Breeding for Conformation
Published: October 29, 2007
By: Abe Huisman, Hypor R&D
An important trait for breeding animals is physical soundness. Animals need to be structurally sound to carry out their normal functions and to maximize their longevity and productive performance. Animals that cannot maintain minimum levels of physical soundness will be culled in the selection (as breeding candidates) process or will be culled relatively early from the breeding herd resulting in an adverse effect on longevity and economic losses. Leg weakness is an important reason for involuntary culling in the pig industry (e.g. Serenius, 2004; Tarrés et al., 2006). Leg weakness among pigs is thought to have a multifactorial background, which involves hereditary predisposition as well as nutritional and housing conditions.
Currently in most breeding programs, pigs that do not meet conformation standards as specified are culled based on phenotypic observation. This independent cu lling for conformation may undermine the efforts to improve other traits that may have significantly higher economic importance. Further more clients expect sound and well structured animals from their genetic supplier when they buy their breeding stock. Standardized scoring of conformation in Hypor, in the past many years for a variety of traits, has provided a valuable data resource for genetic analysis. Variance components can be estimated and if there appears to be significant heritability for these traits, breeding values for conformation can be calculated. This enables genetic selection for conformation which in turn would lead to improved accuracy in selection for conformation. At the moment subjective scores for legs, claws, ham, loin, shoulder, length and stature are collected as part of the routine data collection in the Hypor breeding program.
Dataset for Conformation Scores
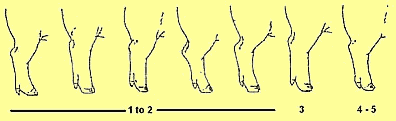
Standardized data collected since 1990 from a Landrace (dam line) and since 2001 for a Duroc (sire line) were used for genetic analyses of conformation scores. The conformation traits are all scored on a 1 to 5 scale. For legs and claws a 1 represents a bad score and a 5 represents an excellent score. For ham, loin and shoulders a 1 represents an extremely light animal and a 5 an extremely heavy animal. For length and stature the scores reflect the frame size of the animal on an increasing scale. The average for each conformation trait is approximately 3, which represents the average phenotype.
The "true type score" or breeding objective will be different in sire and dam lines. For leg and claws 5 is the true type score, while for ham, loin, length, shoulder and stature it varies per line from 3 to 5, depending on the position of the line in the crossbreeding scheme.
Table 1 shows the average conformation (morphology) scores as estimated from the historical dataset.
Table 1 - Average conformation (morphology) scores as estimated from the historical dataset
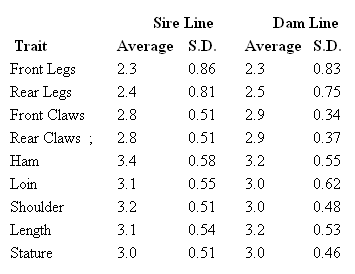
From Table 1 it can be seen that both Front Legs and Rear Legs are scored somewhat more harshly than the other conformation traits. This is reflected in the culling reasons as well. Most animals were culled because of poor legs.
Another observation that can be made from this Table is that the sire line pigs score higher for Ham, Loin and Shoulder, although not st atistically different.
Analysis
The model used for analysis of the conformation traits included the fixed effect of batch. To account for management, housing and seasonal effects, the effect of sex, and the effect of way of testing, where pigs were either group-housed (feeder stations) or group-housed (no feeder stations). Also included in the model were the random components for animal genetic effect and litter effect.
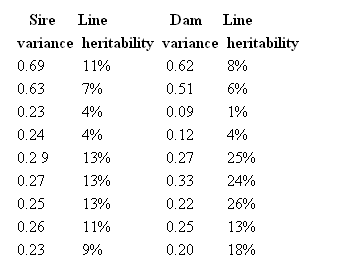
Litter effect accounted for approximately 1 - 3% of the total variation in these traits. The variation for most traits was very similar for the sire and the dam line. However, the variation in front and rear claws in the sire line was close to double the variation in front and rear claws in the dam line (Table 2). Estimated heritabilities (h²) were similar for both lines for the leg and claw traits, whereas the heritabilities for Ham, Loin, Shoulder, Length and Stature were higher in the dam line (Table 2).
Table 2 - Estimated variance components and heritabilities for the conformation traits for both sire- and dam-line
Index
Separate conformation indices were developed for the dam- and sire-lines based on the desired true type for each line. In a dam-line index, legs and claws are comparatively more critical than in sire lines, while in the sire lines, traits that determine body frame characteristics will get relatively more emphasis. Further, the indices were fine-tuned based on the traits that have the most significant need for improvement in that breed.
Predicting ability of Index
An analysis was run to test the predicting ability of the defined indices. To investigate this 10% of the conformation score data was deleted and a BLUP analysis was performed. Animals were grouped based on index values into three groups, high, medium, and low. Average phenotypes were calculated for the traits that are included in the index. This process was repeated 10 times, results presented are the average of those 10 replicates.
Table 3 - Average phenotypes based on index grouping
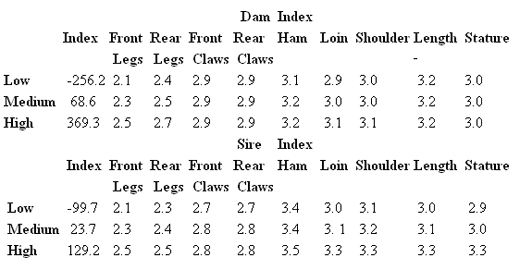
For the dam index, where more emphasis is put on legs and claws, it is clear that animals in the high index group have, on average, a higher score for front and rear legs. Whereas the differences between the high and low index groups for the other traits are less obvious. The sire index puts more evenly distributed emphasis on feet and claws and the other traits. The high and low sire index groups show a difference in favour of the high group for all traits. The differences between low and high index groups for the claw traits are not so clear. This is most likely due to the fact that the heritabilities for front and rear claws were low compared to the heritabilit ies for the other traits (Table 2). Reason for the lower heritabilities might be that the trait is less standardized. Various claw defects might be scored at the same level, while it would be more accurate to treat them as different claw traits.
Implications for the breeding program
Estimates of variance components and predicting ability show that genetic selection for conformation scores can be improved significantly through the use of conformation indices. It has been demonstrated that both the sire and the dam index are capable of predicting which animals will get better conformation scores. Additionally it will be possible to select nucleus replacement breeding stock much more accurately for conformation traits, since not only the animal itself but also the relatives will play a role in determining its conformation index level. In this way we can differentiate between a boar which is acceptable but has very bad relatives and a boar that gets equal scores but has relatives with excellent conformation. The breeding value of the latter will be higher and its offspring will have higher probability of scoring better in conformation. The presented indices and analyses show that through im plementation of the conformation index the accuracy of selection (for conformation) is significantly improved. It will lead to a more efficient usage of selection information and a significant improvement of soundness and body structure of Hypor breeding animals in the near future.
References
Serenius, T. (2004) Genetics of sow efficiency in the Finnish Landrace and Large White populations. Doctoral dissertation. Agrifood Research Reports 58. MTT Agrifood Research Finland, Finland.
Serenius, T., Sevon-Aimónen, M.-L., Kause, A., Mäntysaari, E.A., Mäki-Tanila, A. (2004) Genetic associations of prolificacy with performance, carcass, meat quality, and leg conformation traits in the Finnish Landrace and Large White populations. J. Anim. Sci. 82: 2301-2306.
Serenius, T., Stalder, K.J. (2006) Selection for sow longevity. J. Anim. Sci. 84: E166-E171.
Tarrés, J., Bidanel, J.P., Hofer, A., Ducrocq, V. (2006) An alysis of longevity and exterior traits on Large White sows in Switzerland. J. Anim. Sci. 84: 2914-2924.
For more information
This article is published on behalf of Hypor Research and Development.
Hypor is one of the world's leading suppliers of swine genetics. Hypor is committed to providing superior genetics, which support profitability in the pork meat value chain. With its head office located in Kitchener, Ontario, Canada, the company has strategically located breeding centers in North America, Europe and Asia.
Hypor is the Pig Breeding Division of multi-species breeding company Hendrix Genetics B.V. Hendrix Genetics is headquartered in Boxmeer, the Netherlands. With a number of wholly owned operations and joint ventures across the world in 24 countries on 4 continents, it serves the world's poultry and pork industry in more than 100 countries with about 1,000 employees.
Related topics
Join to be able to comment.
Once you join Engormix, you will be able to participate in all content and forums.
* Required information
Would you like to discuss another topic? Create a new post to engage with experts in the community.
Create a post


You may be interested in
.jpg&w=3840&q=75)
Phileo by Lesaffre